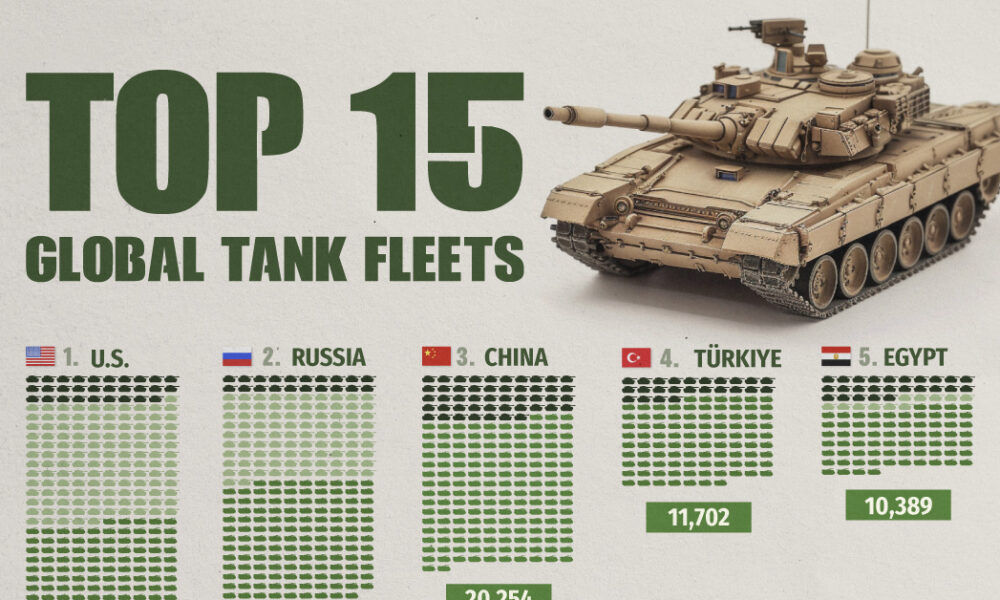
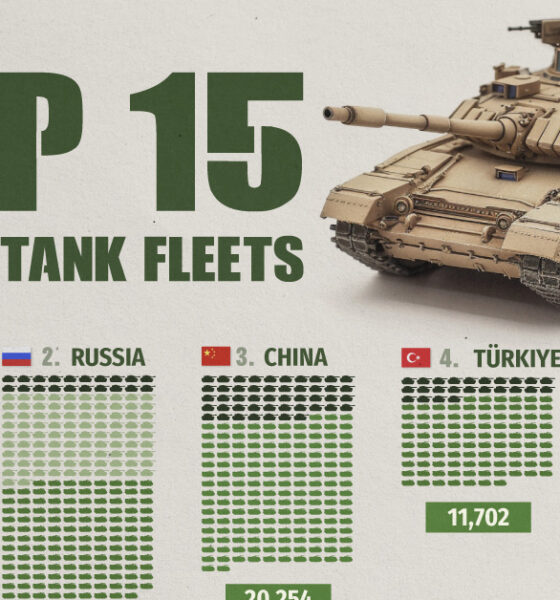
Heavily armed and armored, the modern tank is a versatile and mobile weapons platform, and a critical piece of contemporary...
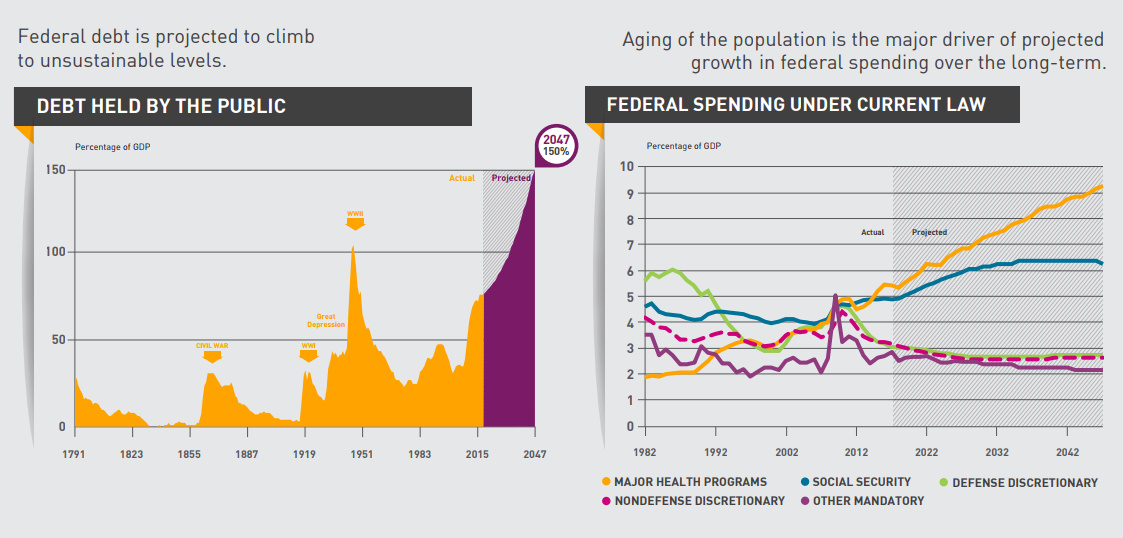
The national debt keeps growing and growing. But what's driving that trend, and when will the situation reach a critical mass of attention?
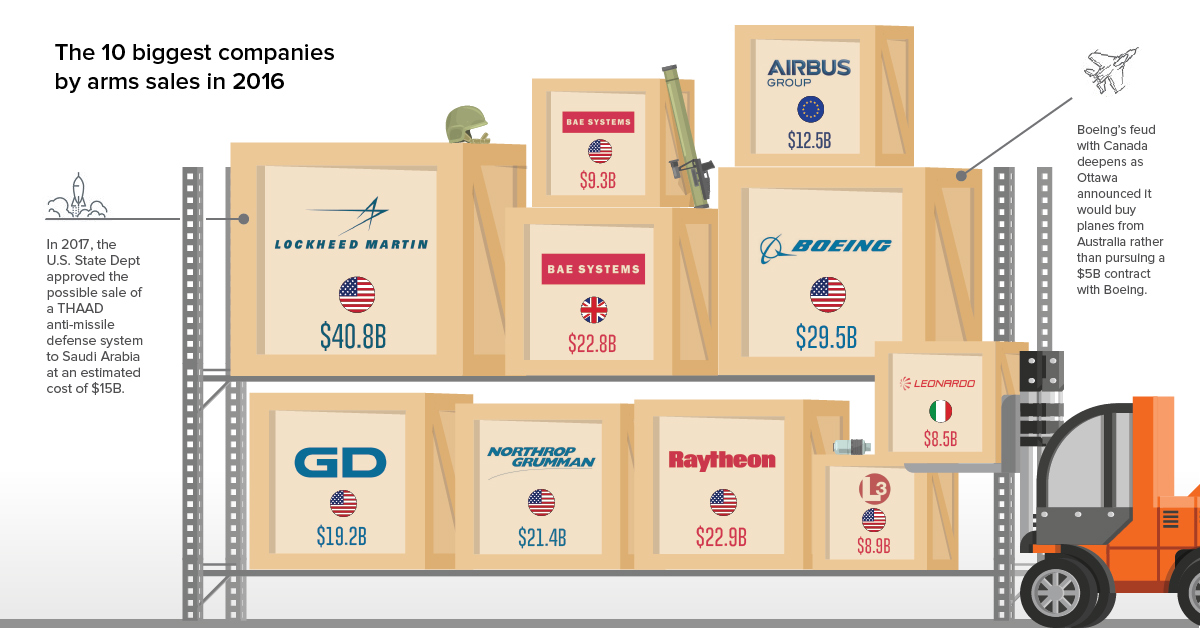
Want a fighter jet or a new tank? These ten companies - most of them based on the U.S. - are the firms that sell the...
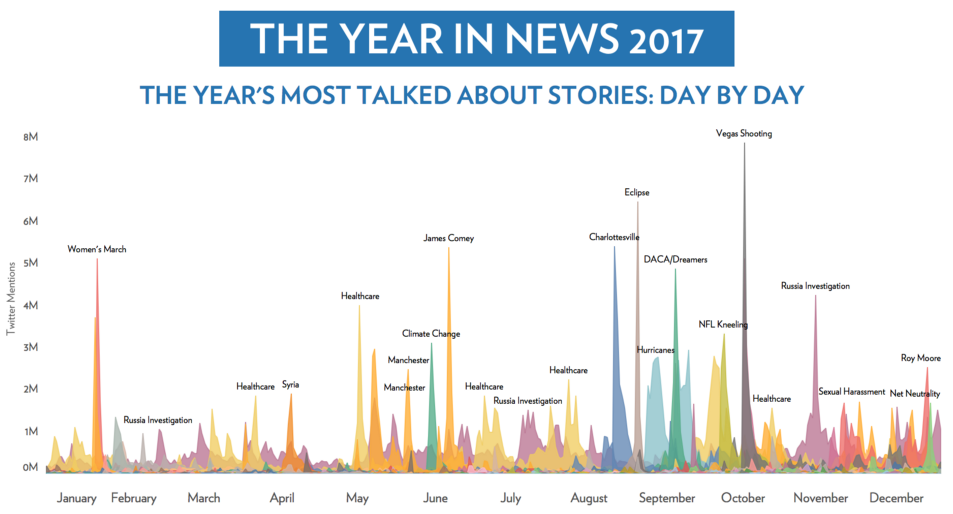
What were the most talked about news stories of 2017? This infographic crunches the data on 2.8 billion tweets to find out.
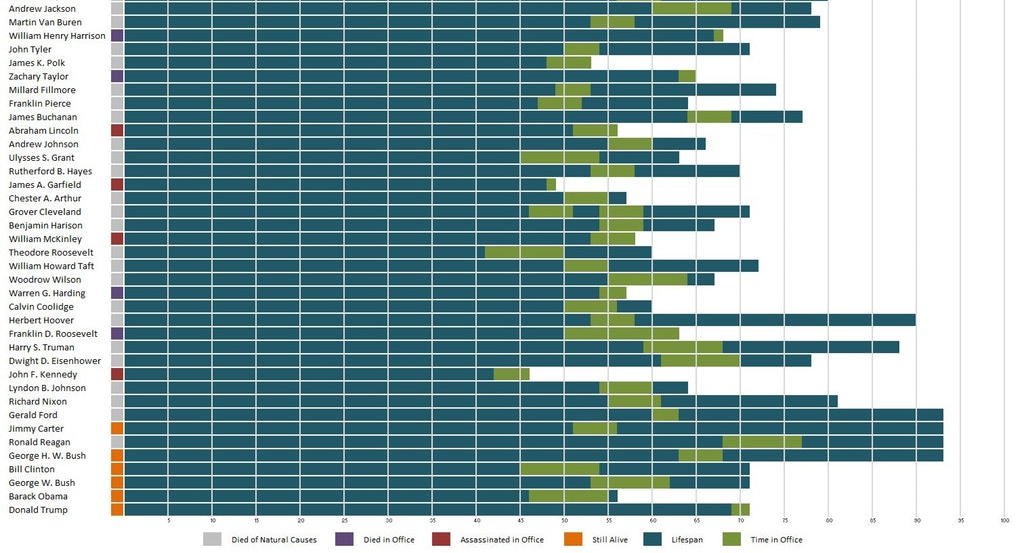
When do presidents start their first terms, on average? Who were the youngest and oldest presidents? It's all here in this visualization.
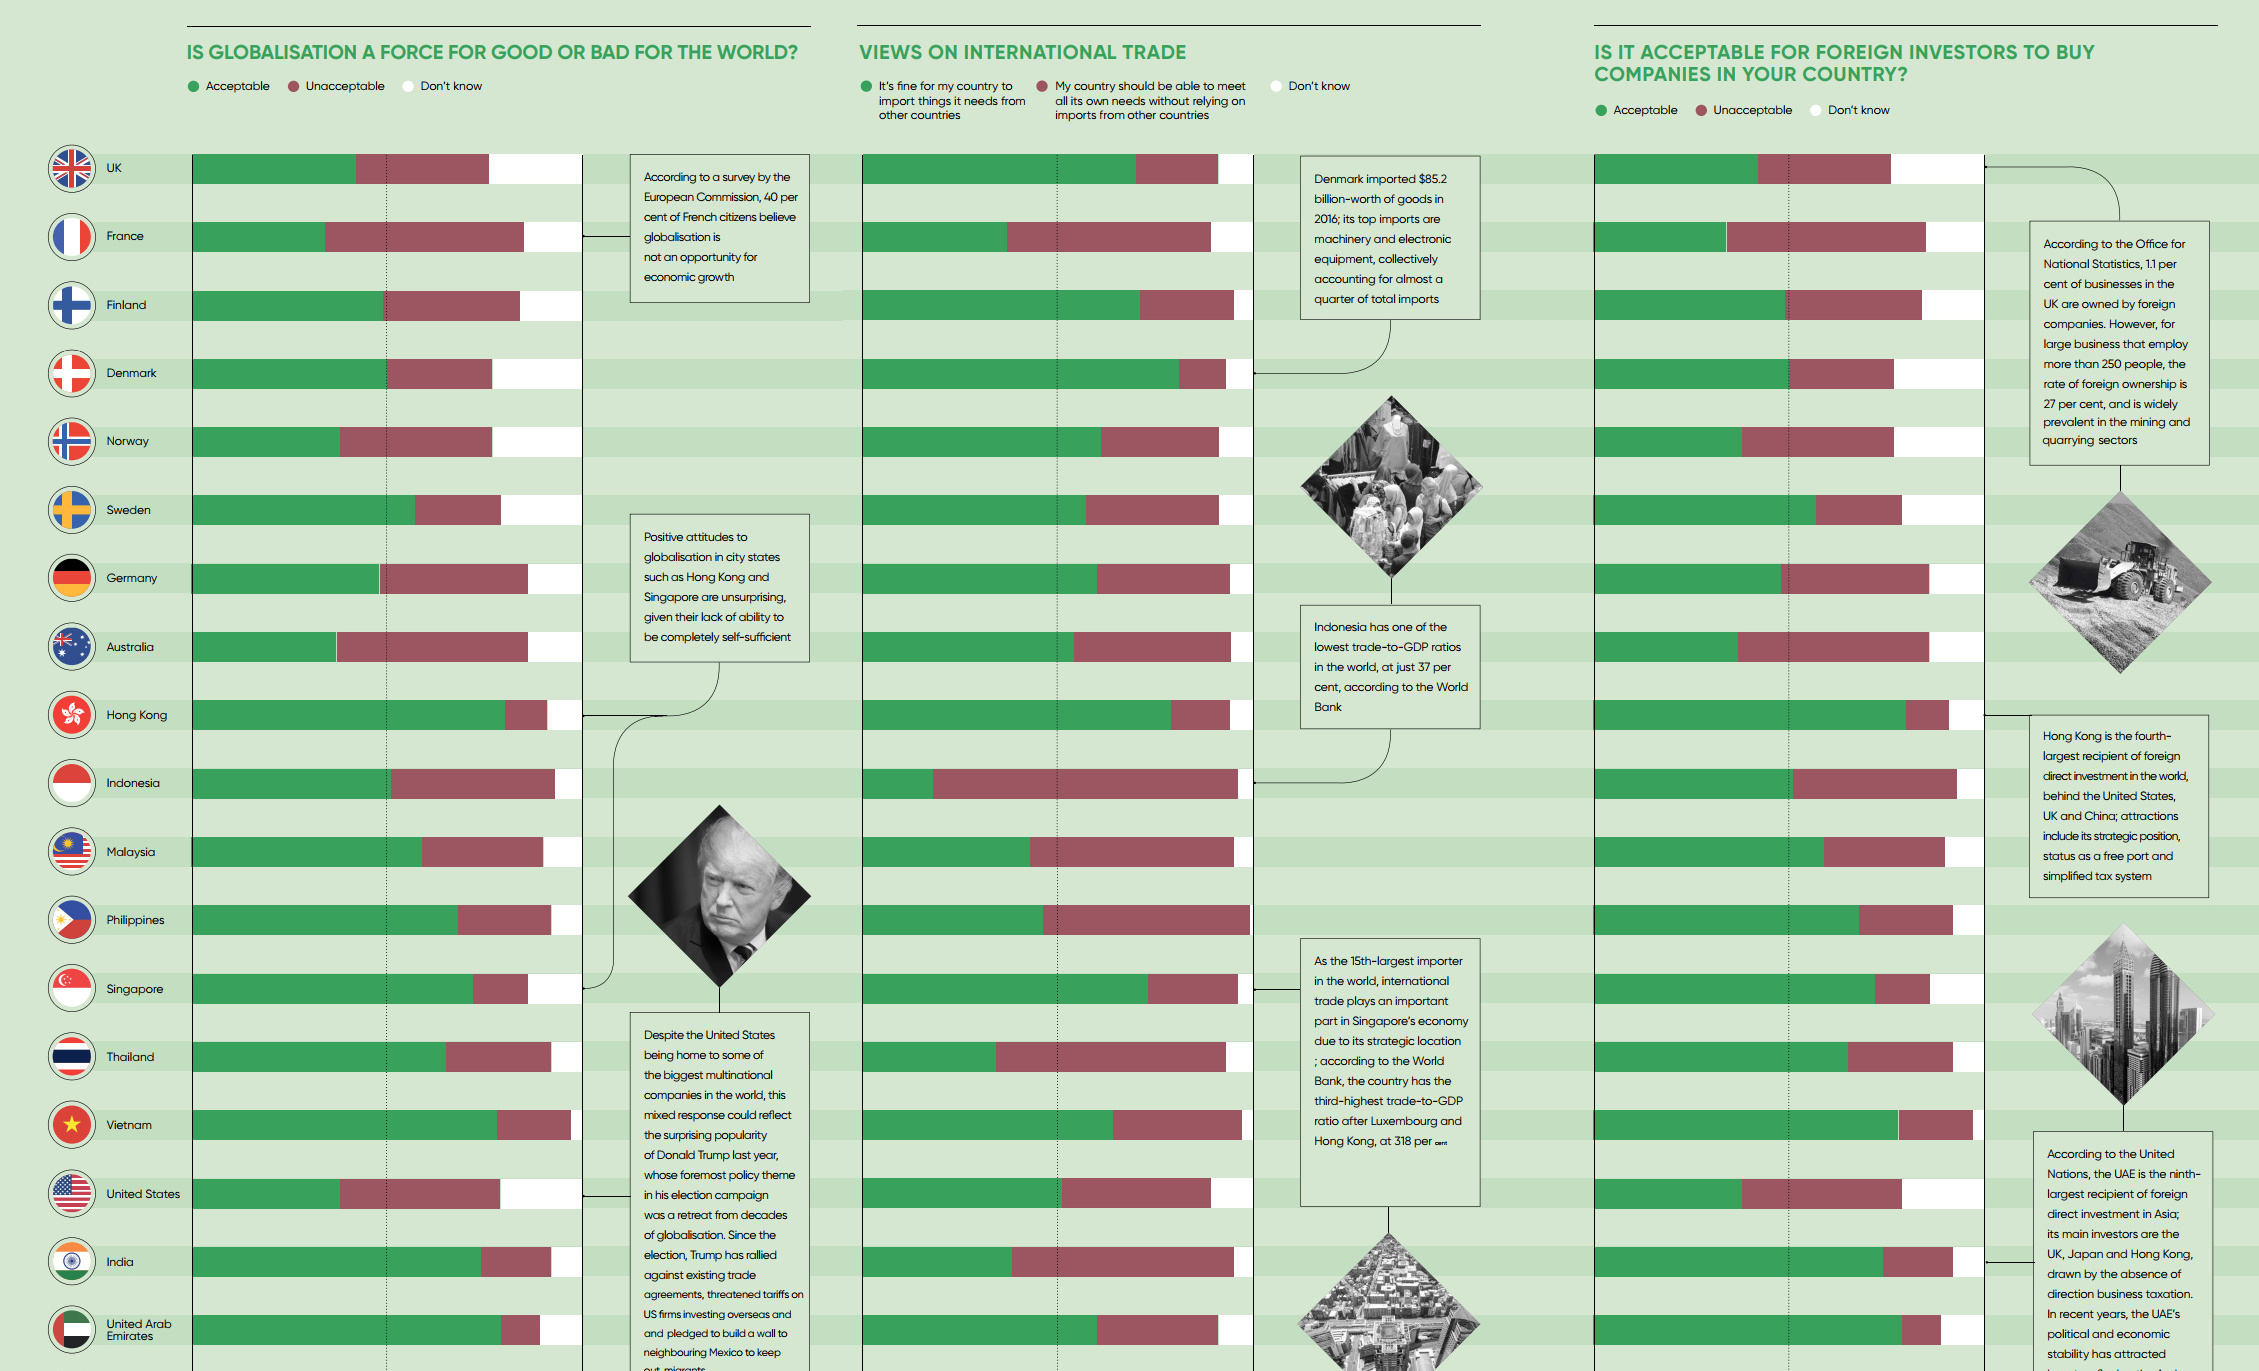
Is globalization a force for good or bad? The answer to this question depends greatly on who you ask - here is a survey of people...
Much of the world’s population surfs an internet that is at least partially censored, and this map shows to which degree that is true for every...
Where are the world's nuclear weapons located, how have these totals changed, and what the heck is going on with North Korea right now?
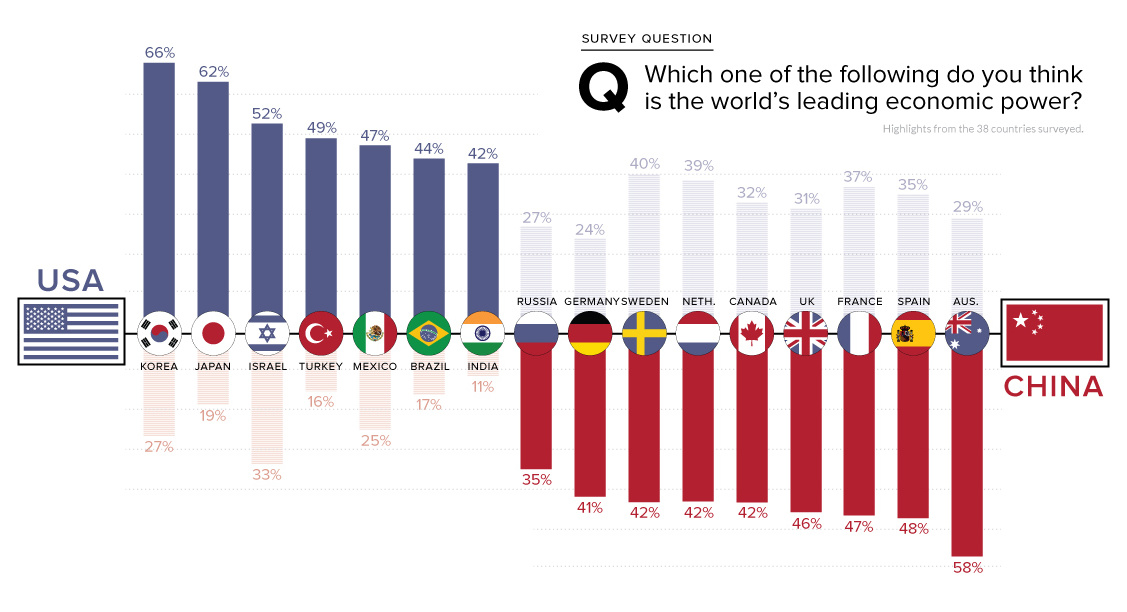
Which country is the world's leading economic superpower? The world is strangely divided on this question - see the surprising answers in this chart.
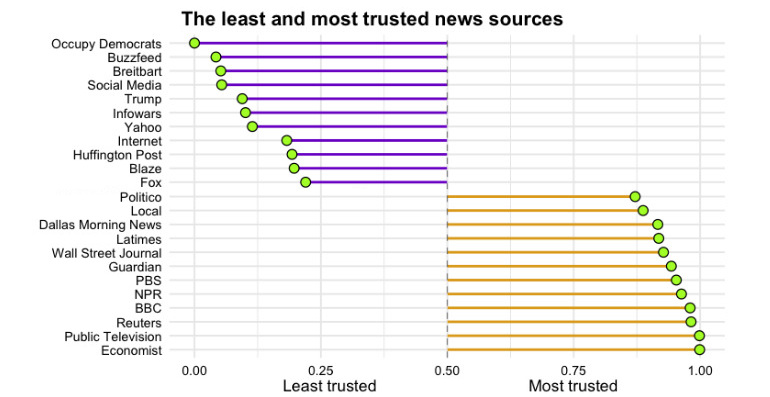
Which news sources do Americans trust, and which outlets do they consider to be full of it? See the results from this survey of >8,000 Americans.
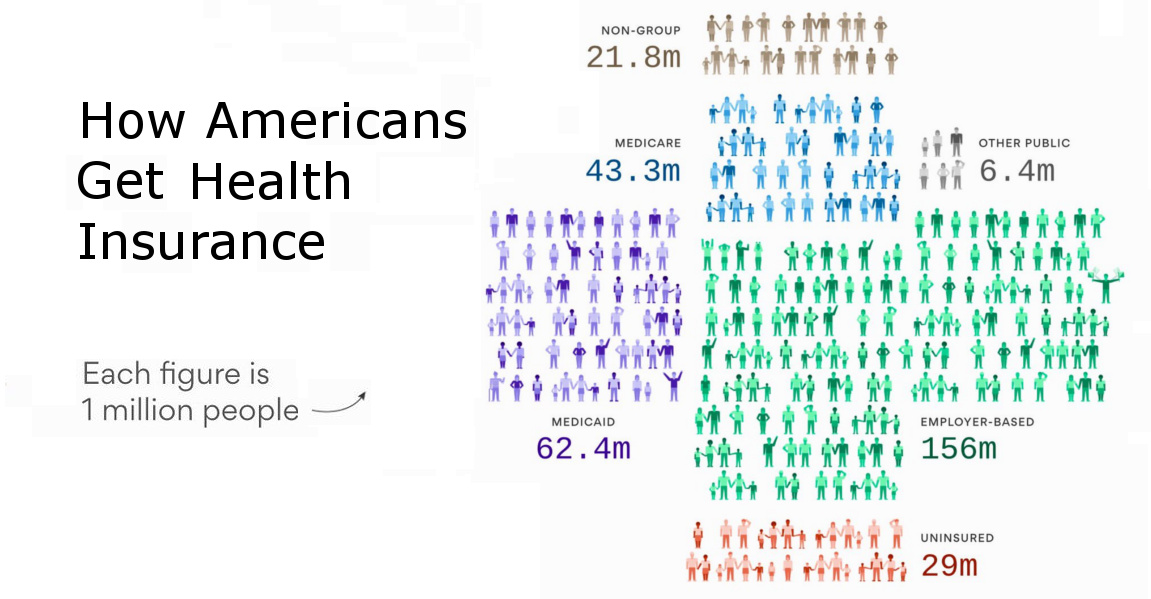
Here's how Americans get healthcare coverage, using visualizations to show the numbers both nationally and for each individual state.


