Markets
What People Think of Globalization, by Country
View a high resolution version of this graphic
What People Think of Globalization, by Country
View the high resolution version of today’s graphic by clicking here.
More than in the past, the population is divided on whether globalization is a force for good or not.
In the aftermath of events like Brexit and the Trump election, it’s clear that there’s a growing movement of people that are skeptical about wider integration into the global economy and foreign cultures. While this countervailing force has always existed, only recently has it become powerful enough to change the outcomes of key elections and referendums.
But how big is this contingent of the population, and how does it differ in size from country to country?
The Survey
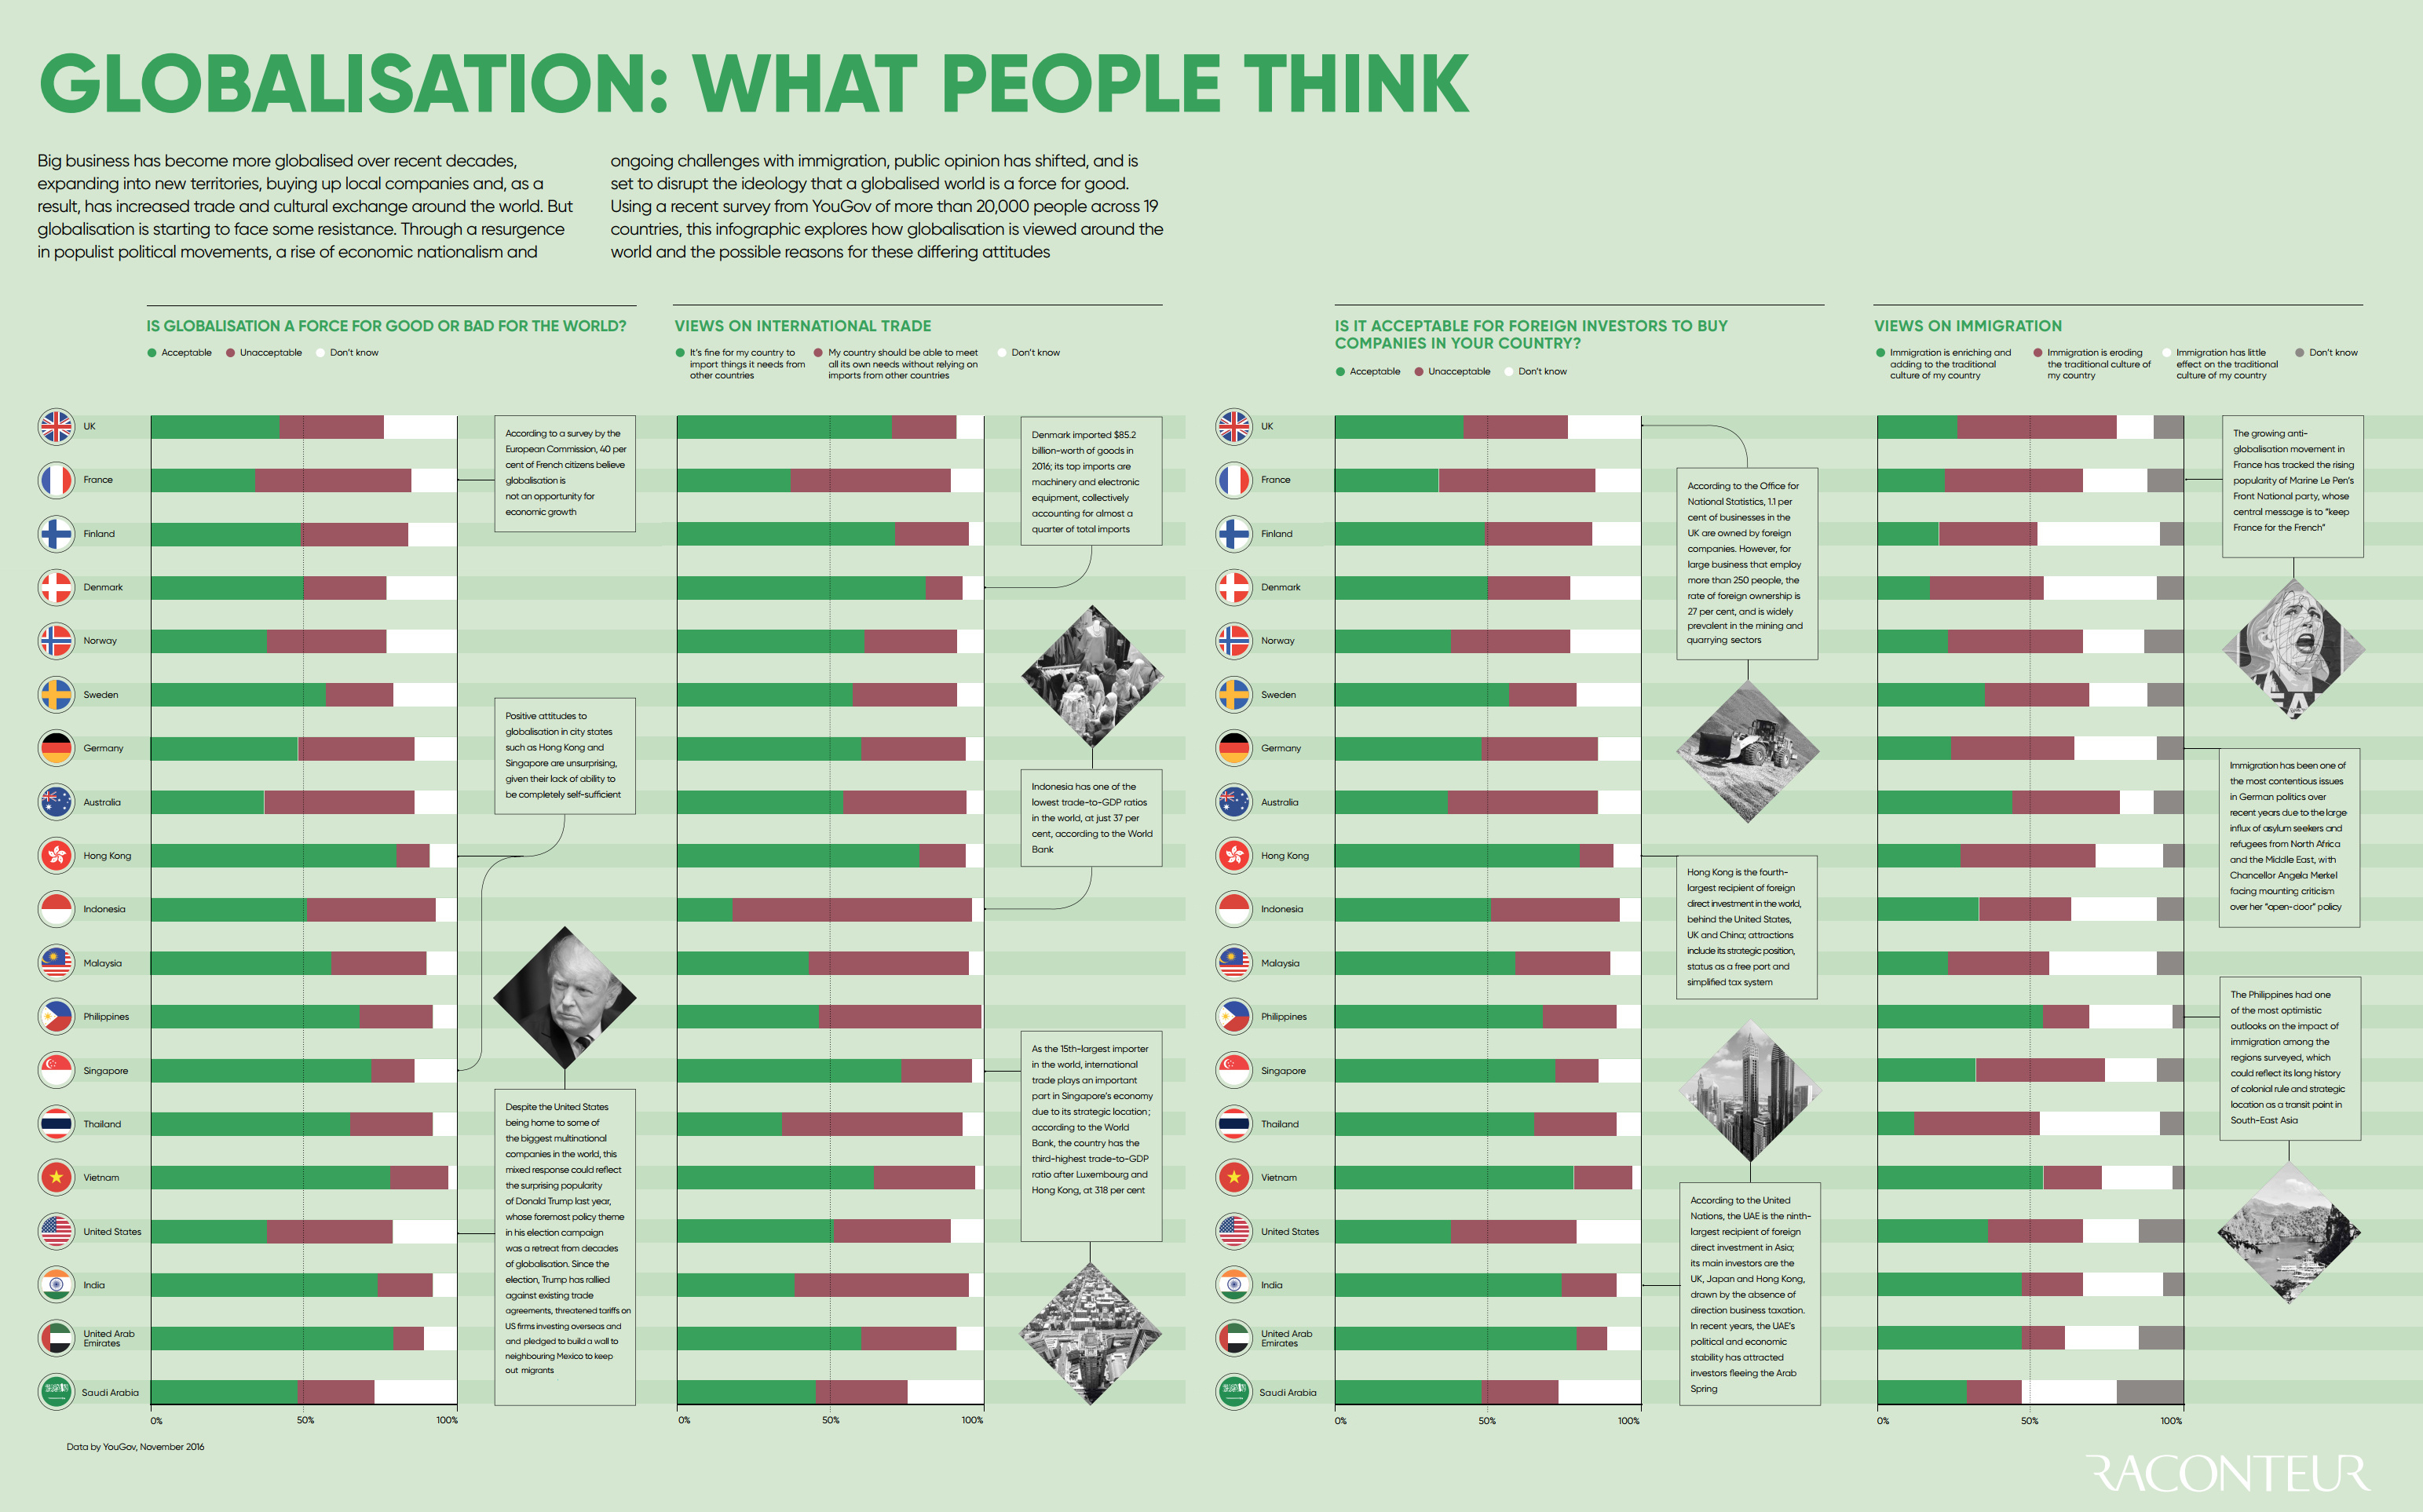
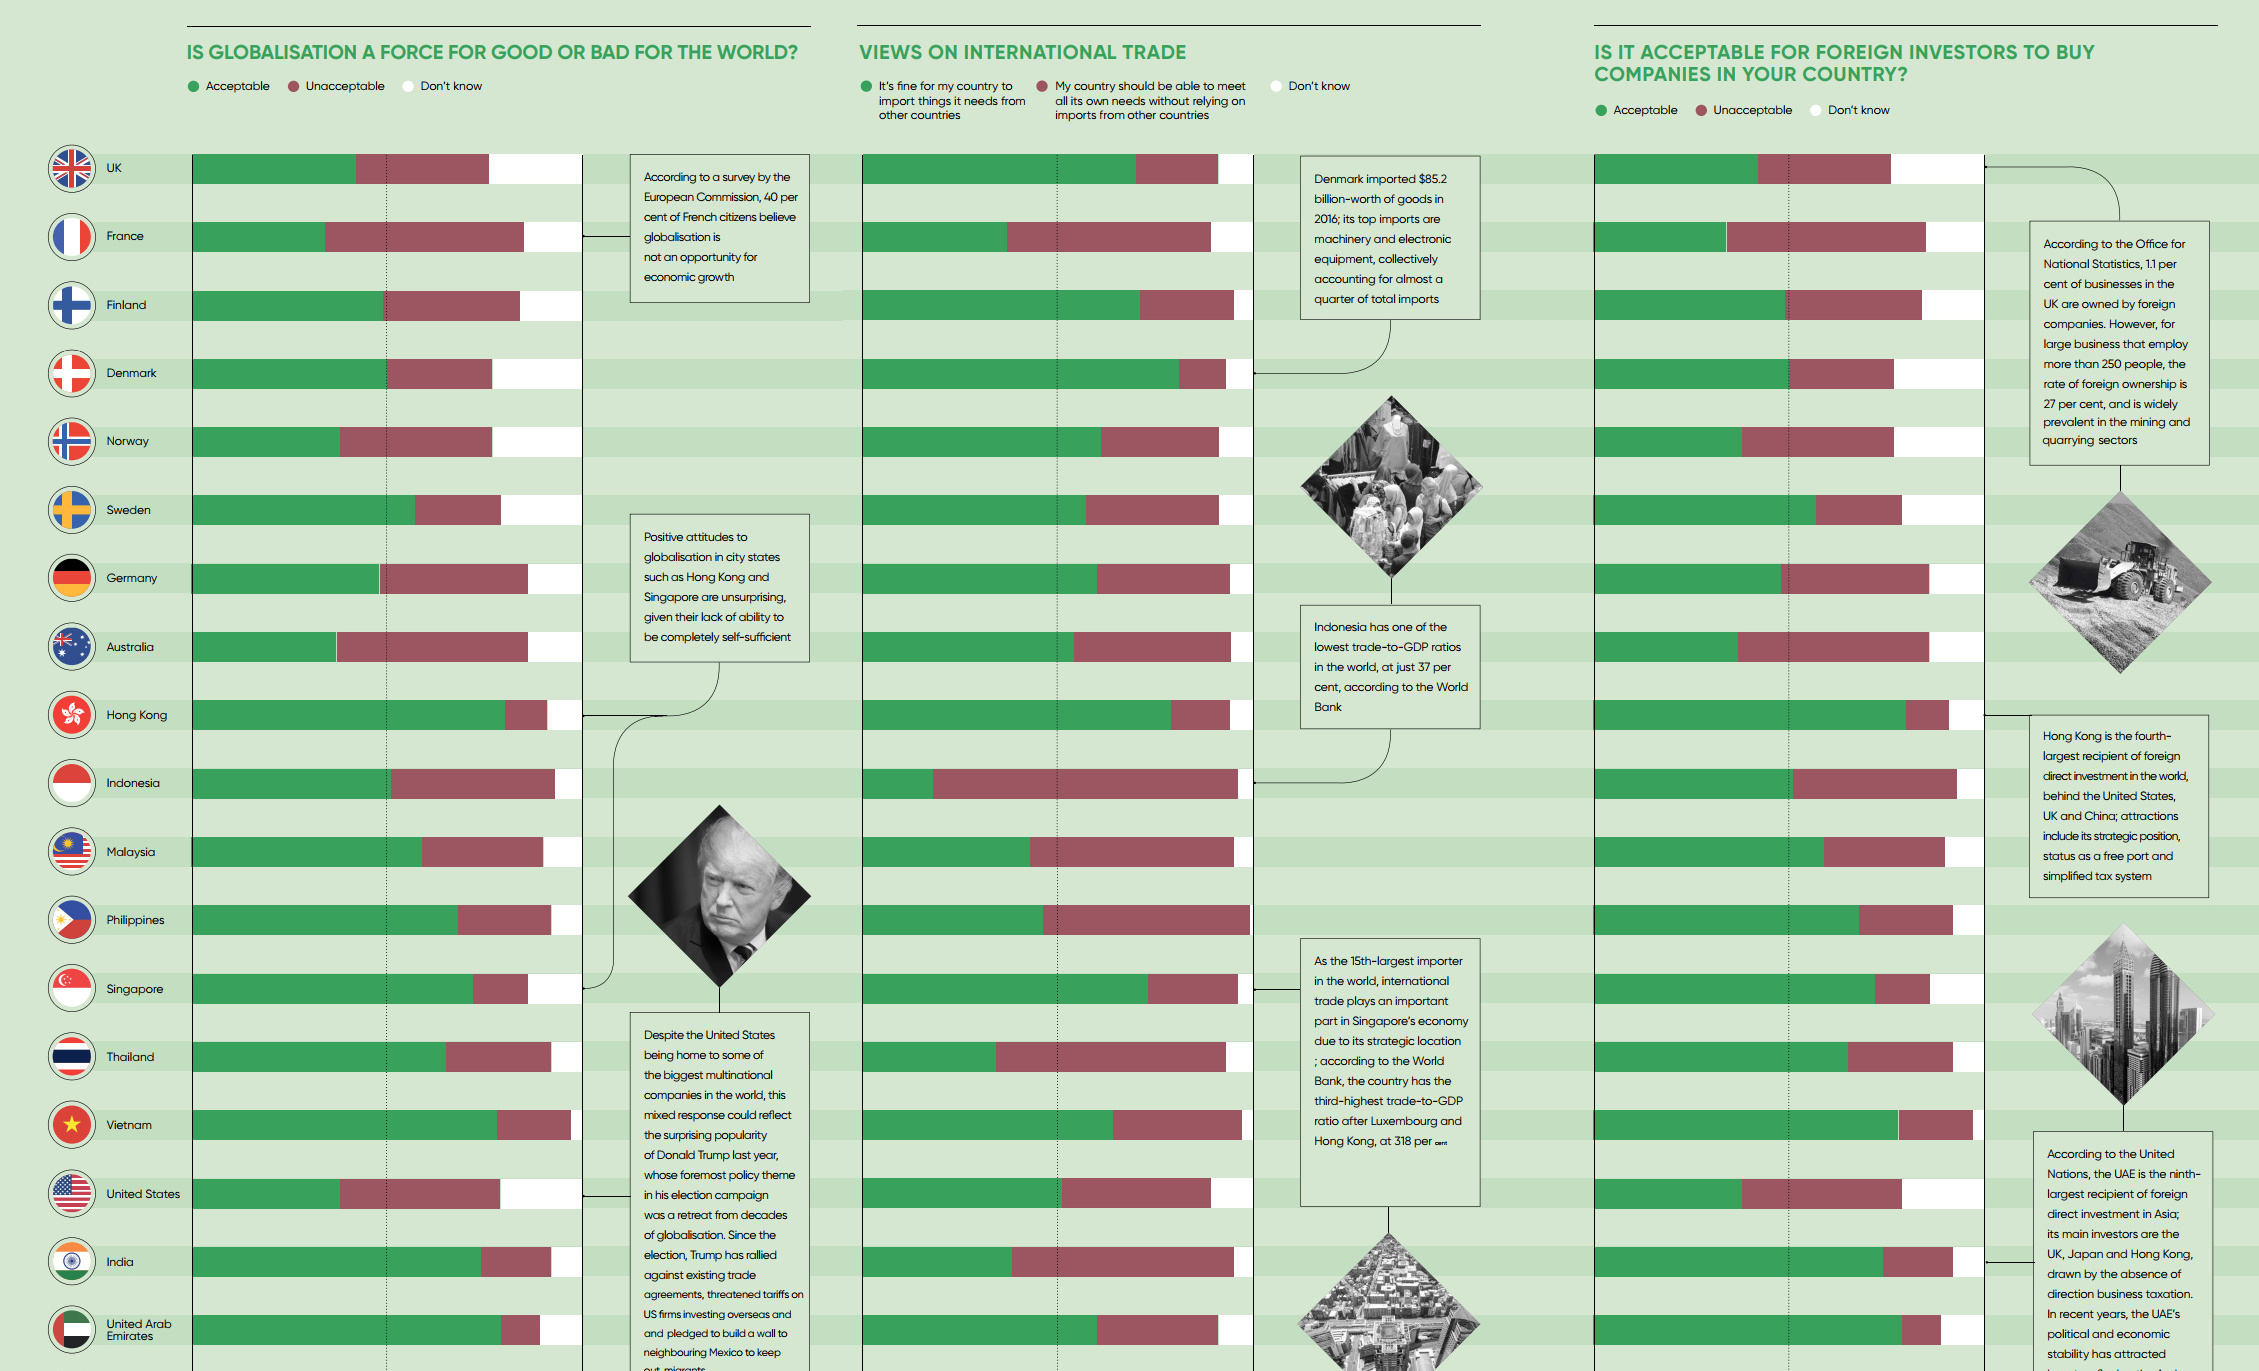
Today’s infographic from Raconteur highlights survey data on the topic of globalization for 19 countries.
The survey, published by YouGov just under a year ago, covers international trade, foreign direct investment, and the impact of immigration. Here is the highest level data, which focuses on globalization in general.
Question: “Overall, do you think globalization is a force for good or bad for the world?”
| Country | Force for good | Force for bad | Don't know |
|---|---|---|---|
| United Kingdom | 46% | 19% | 36% |
| France | 37% | 37% | 26% |
| Finland | 56% | 18% | 27% |
| Denmark | 68% | 15% | 17% |
| Norway | 49% | 23% | 27% |
| Sweden | 63% | 20% | 18% |
| Germany | 60% | 20% | 20% |
| Australia | 48% | 22% | 29% |
| Hong Kong | 63% | 21% | 16% |
| Indonesia | 72% | 13% | 15% |
| Malaysia | 73% | 10% | 17% |
| Philippines | 85% | 7% | 8% |
| Singapore | 71% | 12% | 17% |
| Thailand | 76% | 12% | 12% |
| Vietnam | 91% | 4% | 5% |
| United States | 40% | 27% | 33% |
| India | 83% | 7% | 10% |
| UAE | 69% | 13% | 18% |
| Saudi Arabia | 48% | 18% | 35% |
Note: get the data for all questions directly from YouGov here.
Differing Perspectives
Interestingly, support for globalization ranges from 37% (France) all the way to 91% (Vietnam), representing a very diverse array of attitudes towards the topic.
Based on these 19 countries, at least, the places that feel the most positive about globalization tend to be emerging markets such as the Philippines (85%), India (83%), and Indonesia (72%). These are countries where the pie is getting bigger at a rapid rate, as economies expand from access to increased global capital and trade.
The countries that seem the most skeptical seem to be more developed economically. In the United States, only 40% of respondents saw globalization as a force for good, while 27% saw it as a force for bad and a large portion of the population wasn’t sure (33%). The U.K. and Australia have similar numbers, with the aforementioned France having the lowest portion of respondents saying globalization is a force for good.
Though it’s true that these developed countries are showing skepticism, it’s also clear that the Western world is very split on the topic. European countries like Germany (60%), Denmark (68%), Sweden (63%), and Finland (56%) all saw a majority of respondents in favor of globalization.
This split in opinion is hard to reconcile, and it’s likely part of the reason that so many investors remain focused on geopolitical risk in the current environment.


Markets
U.S. Debt Interest Payments Reach $1 Trillion
U.S. debt interest payments have surged past the $1 trillion dollar mark, amid high interest rates and an ever-expanding debt burden.


U.S. Debt Interest Payments Reach $1 Trillion
This was originally posted on our Voronoi app. Download the app for free on iOS or Android and discover incredible data-driven charts from a variety of trusted sources.
The cost of paying for America’s national debt crossed the $1 trillion dollar mark in 2023, driven by high interest rates and a record $34 trillion mountain of debt.
Over the last decade, U.S. debt interest payments have more than doubled amid vast government spending during the pandemic crisis. As debt payments continue to soar, the Congressional Budget Office (CBO) reported that debt servicing costs surpassed defense spending for the first time ever this year.
This graphic shows the sharp rise in U.S. debt payments, based on data from the Federal Reserve.
A $1 Trillion Interest Bill, and Growing
Below, we show how U.S. debt interest payments have risen at a faster pace than at another time in modern history:
| Date | Interest Payments | U.S. National Debt |
|---|---|---|
| 2023 | $1.0T | $34.0T |
| 2022 | $830B | $31.4T |
| 2021 | $612B | $29.6T |
| 2020 | $518B | $27.7T |
| 2019 | $564B | $23.2T |
| 2018 | $571B | $22.0T |
| 2017 | $493B | $20.5T |
| 2016 | $460B | $20.0T |
| 2015 | $435B | $18.9T |
| 2014 | $442B | $18.1T |
| 2013 | $425B | $17.2T |
| 2012 | $417B | $16.4T |
| 2011 | $433B | $15.2T |
| 2010 | $400B | $14.0T |
| 2009 | $354B | $12.3T |
| 2008 | $380B | $10.7T |
| 2007 | $414B | $9.2T |
| 2006 | $387B | $8.7T |
| 2005 | $355B | $8.2T |
| 2004 | $318B | $7.6T |
| 2003 | $294B | $7.0T |
| 2002 | $298B | $6.4T |
| 2001 | $318B | $5.9T |
| 2000 | $353B | $5.7T |
| 1999 | $353B | $5.8T |
| 1998 | $360B | $5.6T |
| 1997 | $368B | $5.5T |
| 1996 | $362B | $5.3T |
| 1995 | $357B | $5.0T |
| 1994 | $334B | $4.8T |
| 1993 | $311B | $4.5T |
| 1992 | $306B | $4.2T |
| 1991 | $308B | $3.8T |
| 1990 | $298B | $3.4T |
| 1989 | $275B | $3.0T |
| 1988 | $254B | $2.7T |
| 1987 | $240B | $2.4T |
| 1986 | $225B | $2.2T |
| 1985 | $219B | $1.9T |
| 1984 | $205B | $1.7T |
| 1983 | $176B | $1.4T |
| 1982 | $157B | $1.2T |
| 1981 | $142B | $1.0T |
| 1980 | $113B | $930.2B |
| 1979 | $96B | $845.1B |
| 1978 | $84B | $789.2B |
| 1977 | $69B | $718.9B |
| 1976 | $61B | $653.5B |
| 1975 | $55B | $576.6B |
| 1974 | $50B | $492.7B |
| 1973 | $45B | $469.1B |
| 1972 | $39B | $448.5B |
| 1971 | $36B | $424.1B |
| 1970 | $35B | $389.2B |
| 1969 | $30B | $368.2B |
| 1968 | $25B | $358.0B |
| 1967 | $23B | $344.7B |
| 1966 | $21B | $329.3B |
Interest payments represent seasonally adjusted annual rate at the end of Q4.
At current rates, the U.S. national debt is growing by a remarkable $1 trillion about every 100 days, equal to roughly $3.6 trillion per year.
As the national debt has ballooned, debt payments even exceeded Medicaid outlays in 2023—one of the government’s largest expenditures. On average, the U.S. spent more than $2 billion per day on interest costs last year. Going further, the U.S. government is projected to spend a historic $12.4 trillion on interest payments over the next decade, averaging about $37,100 per American.
Exacerbating matters is that the U.S. is running a steep deficit, which stood at $1.1 trillion for the first six months of fiscal 2024. This has accelerated due to the 43% increase in debt servicing costs along with a $31 billion dollar increase in defense spending from a year earlier. Additionally, a $30 billion increase in funding for the Federal Deposit Insurance Corporation in light of the regional banking crisis last year was a major contributor to the deficit increase.
Overall, the CBO forecasts that roughly 75% of the federal deficit’s increase will be due to interest costs by 2034.

-

 Green1 week ago
Ranked: The Countries With the Most Air Pollution in 2023
-

 Automotive2 weeks ago
Almost Every EV Stock is Down After Q1 2024
-

 AI2 weeks ago
The Stock Performance of U.S. Chipmakers So Far in 2024
-

 Markets2 weeks ago
Charted: Big Four Market Share by S&P 500 Audits
-

 Real Estate2 weeks ago
Ranked: The Most Valuable Housing Markets in America
-

 Money2 weeks ago
Which States Have the Highest Minimum Wage in America?
-

 AI2 weeks ago
Ranked: Semiconductor Companies by Industry Revenue Share
-

 Travel2 weeks ago
Ranked: The World’s Top Flight Routes, by Revenue