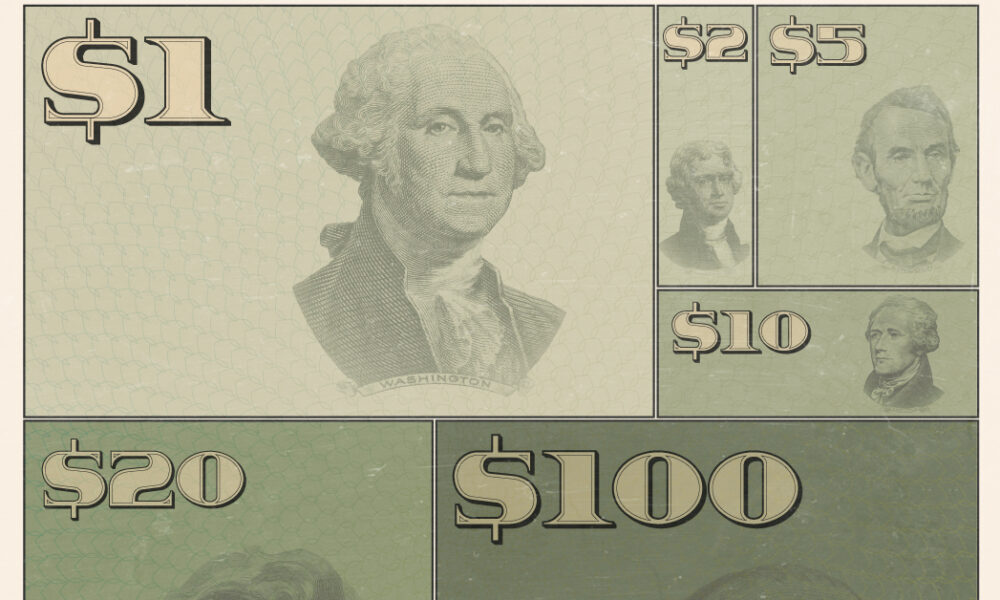
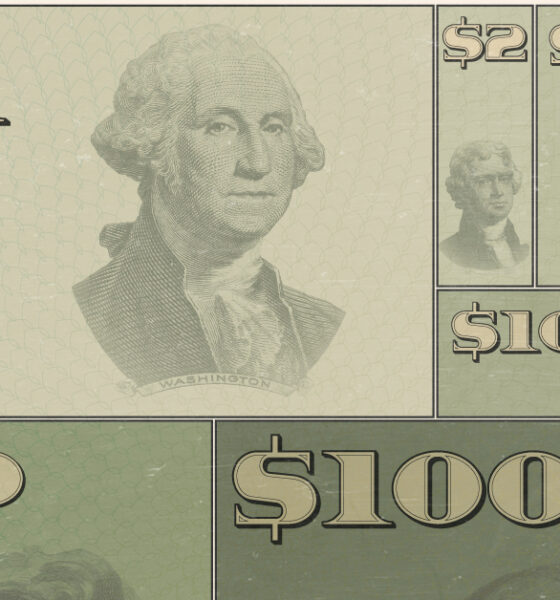
This graphic illustrates the amount of U.S. currency in circulation globally, by denomination, based on data from the Federal Reserve.
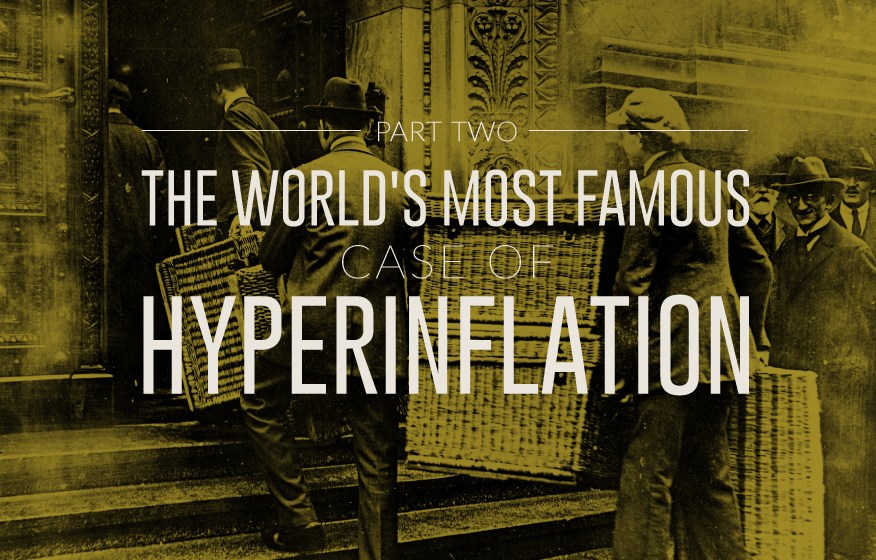
The continuation of our story on Germany's bout with hyperinflation in the early 1920s. We look at the effects, as well as even worse stories of...
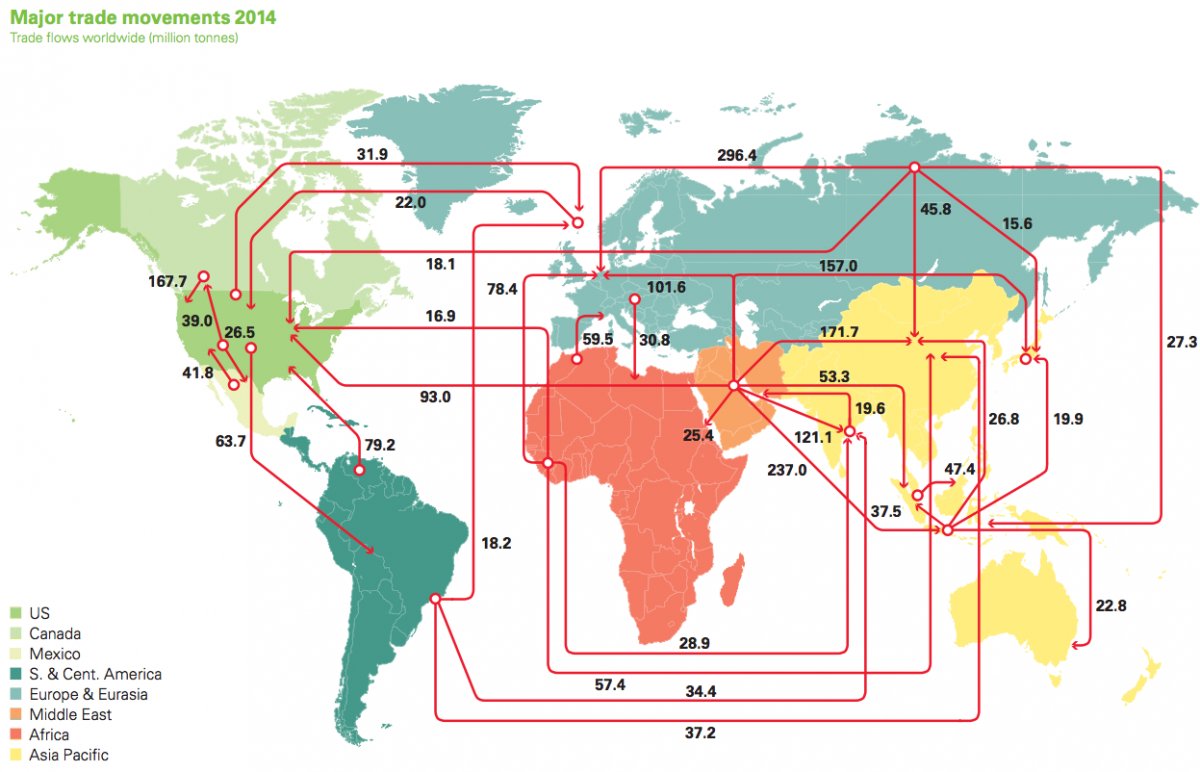
Every day, 93 million barrels of oil are consumed by the global economy. How does this oil change hands? This map visualizes the global oil trade.
Hyperinflation has happened hundreds of times throughout history, but today we present the origins of the world's most famous case in Germany after WW1.
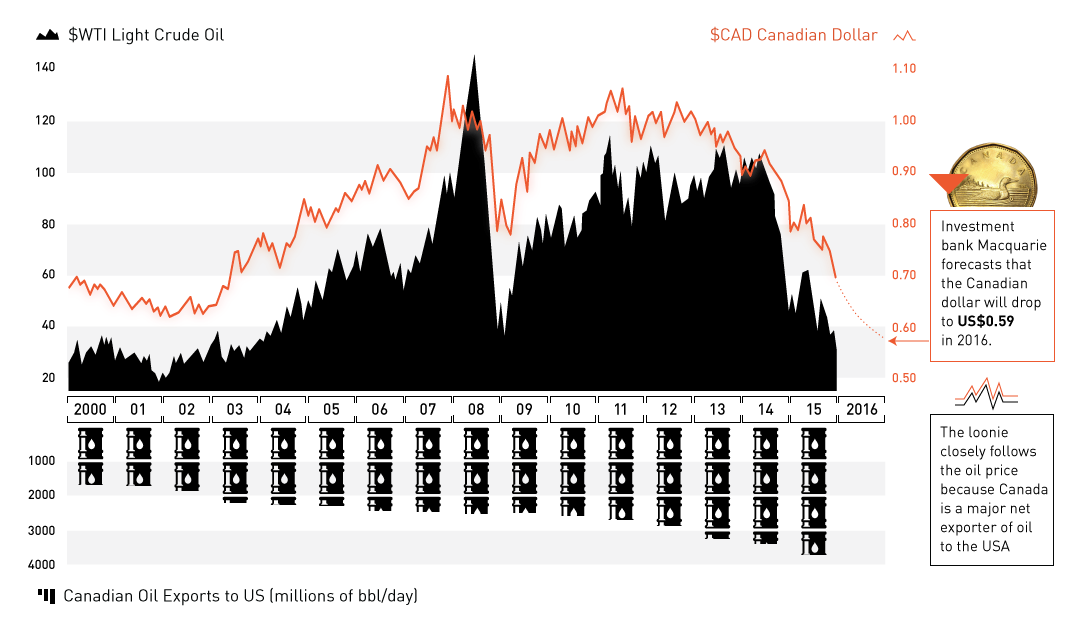
The oil plunge has wreaked havoc on the Canadian dollar. Now at 13-yr lows and expected to go lower, we explain the relationship between oil and...
For centuries, humans from all around the world have tried to use different things as money. Here are some of the world's strangest currencies used so...
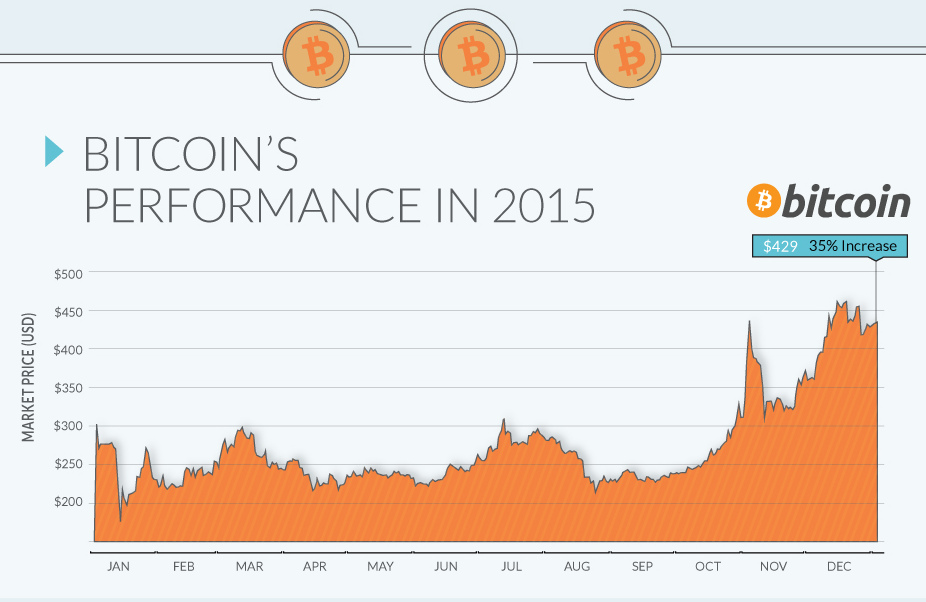
In a year that the US dollar gained on most currencies, it was the digital cryptocurrency Bitcoin that was the top performer by a significant margin.
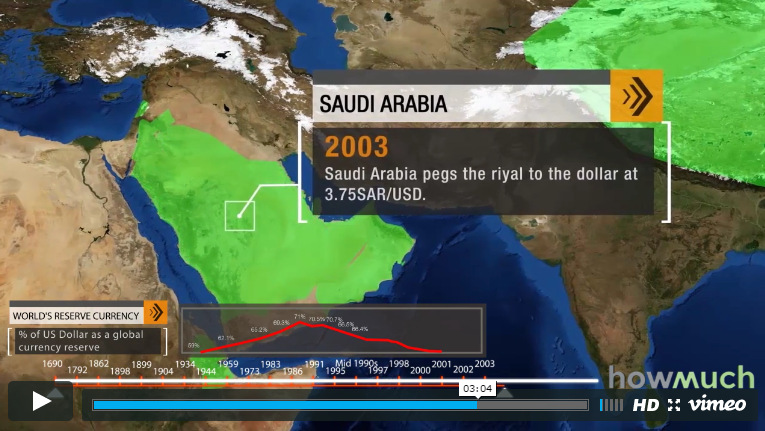
The U.S. dollar is the dominant reserve currency, making up 64% of global reserves. How did this come to be, and what does the future hold...
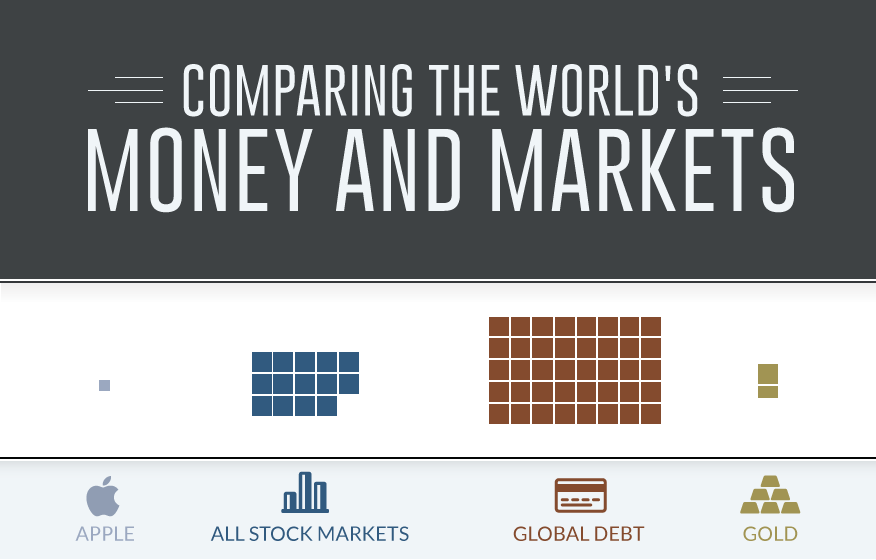
This data visualization compares the world's money supply and markets to give a sense of perspective.

The Money Project uses rich visuals such as infographics and data visualizations to explore the concept and implications of money.
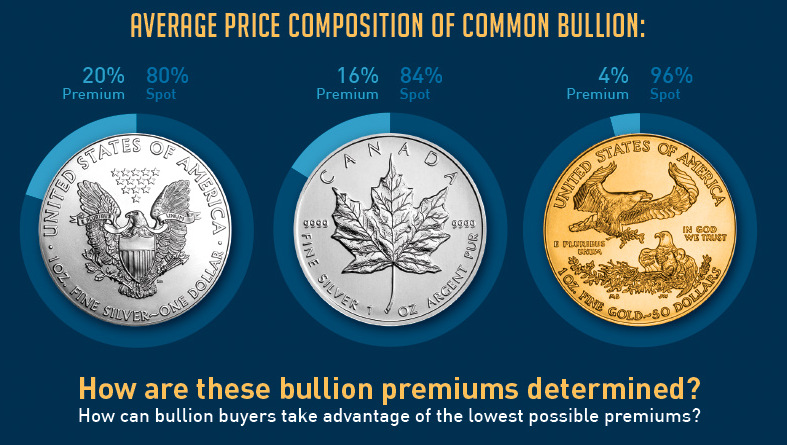
The price that investors pay for gold or silver bullion depends on two things: spot price and bullion premiums. How are the premiums calculated?


