Money
The World’s Strangest Currencies
The World’s Strangest Currencies
The Money Project is an ongoing collaboration between Visual Capitalist and Texas Precious Metals that seeks to use intuitive visualizations to explore the origins, nature, and use of money.
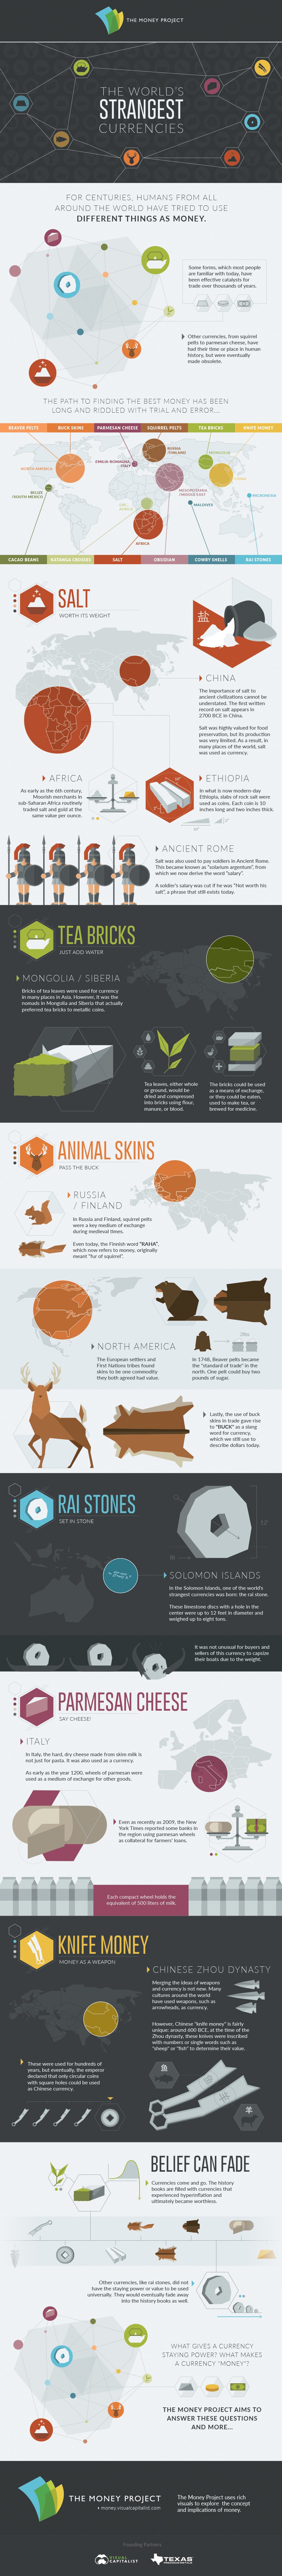
For centuries, humans from all around the world have tried to use different things as money. Some forms, which most people are familiar with today, have been effective catalysts for trade over thousands of years. Other currencies, from squirrel pelts to parmesan cheese, have had their time or place in human history, but were ultimately unsuccessful or made obsolete.
The path to finding the best money has been long and riddled with trial and error. Here are just some of the world’s strangest currencies that we discovered in our research.
Salt
The importance of salt to ancient civilizations cannot be understated. The first written record on salt appears in 2700 BCE in China.
Salt was highly valued for food preservation, but its production was very limited. As a result, in many places of the world, salt was used as currency.
- As early as the 6th century, Moorish merchants in sub-Saharan Africa routinely traded salt and gold at the same value per ounce.
- In what is now modern-day Ethiopia, slabs of rock salt were used as coins. Each coin was 10 inches long and two inches thick.
- Salt was also used as pay soldiers in Ancient Rome. This became known as “solarium argentum”, from which we now derive the word “salary”
- A soldier’s salary was cut if he was “not worth his salt”, a phrase that still exists today.
Tea Bricks
Bricks of tea leaves were used for currency in many places in Asia. However, it was the nomads in Mongolia and Siberia that actually preferred tea bricks to metallic coins.
Tea leaves, either whole or ground, would be dried and compressed into bricks using flour, manure, or blood. The bricks could be used as a means of exchange, or they could be eaten, used to make tea, or brewed for medicine.
Parmesan Cheese
In Italy, the hard, dry cheese made from skim milk is not just for pasta. It was also used as a currency.
As early as the year 1200, wheels of parmesan were used as a medium of exchange for other goods.
Even as recent as 2009, the New York Times reported some banks in the region using parmesan wheels as collateral for farmers’ loans. Each compact wheel holds the equivalent of 550 liters of milk.
Rai Stones
In the Solomon Islands, one of the world’s strangest currencies was born: the rai stone. These limestone discs with the hole in the center were up to 12 feet in diameter and weighed up to eight tons.
It was not unusual for buyers and sellers of this currency to have their boats capsize due to their sheer weight.
Animal Skins
Animal skins have a surprisingly important history as currency in different parts of the world.
In Russia and Finland, squirrel pelts were a key medium of exchange during medieval times. Even today, the Finnish word “raha”, which now refers to money, originally meant the “fur of squirrel”.
In North America, the European settlers and First Nations tribes found skins to be one commodity they both agreed had value.
In 1748, Beaver pelts became the “standard of trade” in the north. One pelt could buy two pounds of sugar.
Lastly, the use of buck skins in trade gave rise to “buck” as a slang word for currency, which we still use to describe dollars today.
Knife Money
Merging the ideas of weapons and currency is not new. Many cultures have used arrowheads as currency throughout the world.
However, Chinese “knife money” is certainly an original idea: around 600 BCE, at the time of the Zhou dynasty, these knives were inscribed with numbers or single words such as “sheep” or “fish” to determine their value.
These were used for hundreds of years, and eventually it was declared by the emperor that only circular coins with square holes could be used for Chinese currency.
What Gives a Currency Staying Power?
Currencies come and go.
Some of the world’s strangest currencies, like rai stones, did not have the staying power or value to be used universally. They would eventually fade away into the history books.
Other currencies around the world would experience hyperinflation and ultimately became worthless.
What gives a currency staying power? What makes a currency “money”?
The Money Project acknowledges that the very concept of money itself is in flux – and it seeks to answer these questions.
About the Money Project
The Money Project aims to use intuitive visualizations to explore ideas around the very concept of money itself. Founded in 2015 by Visual Capitalist and Texas Precious Metals, the Money Project will look at the evolving nature of money, and will try to answer the difficult questions that prevent us from truly understanding the role that money plays in finance, investments, and accumulating wealth.


Money
Charted: Who Has Savings in This Economy?
Older, better-educated adults are winning the savings game, reveals a January survey by the National Opinion Research Center at the University of Chicago.


Who Has Savings in This Economy?
This was originally posted on our Voronoi app. Download the app for free on iOS or Android and discover incredible data-driven charts from a variety of trusted sources.
Two full years of inflation have taken their toll on American households. In 2023, the country’s collective credit card debt crossed $1 trillion for the first time. So who is managing to save money in the current economic environment?
We visualize the percentage of respondents to the statement “I have money leftover at the end of the month” categorized by age and education qualifications. Data is sourced from a National Endowment for Financial Education (NEFE) report, published last month.
The survey for NEFE was conducted from January 12-14, 2024, by the National Opinion Research Center at the University of Chicago. It involved 1,222 adults aged 18+ and aimed to be representative of the U.S. population.
Older Americans Save More Than Their Younger Counterparts
General trends from this dataset indicate that as respondents get older, a higher percentage of them are able to save.
| Age | Always/Often | Sometimes | Rarely/Never |
|---|---|---|---|
| 18–29 | 29% | 33% | 38% |
| 30–44 | 36% | 27% | 37% |
| 45–59 | 39% | 23% | 38% |
| Above 60 | 49% | 28% | 23% |
| All Adults | 39% | 33% | 27% |
Note: Percentages are rounded and may not sum to 100.
Perhaps not surprisingly, those aged 60+ are the age group with the highest percentage saying they have leftover money at the end of the month. This age group spent the most time making peak earnings in their careers, are more likely to have investments, and are more likely to have paid off major expenses like a mortgage or raising a family.
The Impact of Higher Education on Earnings and Savings
Based on this survey, higher education dramatically improves one’s ability to save. Shown in the table below, those with a bachelor’s degree or higher are three times more likely to have leftover money than those without a high school diploma.
| Education | Always/Often | Sometimes | Rarely/Never |
|---|---|---|---|
| No HS Diploma | 18% | 26% | 56% |
| HS Diploma | 28% | 33% | 39% |
| Associate Degree | 33% | 31% | 36% |
| Bachelor/Higher Degree | 59% | 21% | 20% |
| All Adults | 39% | 33% | 27% |
Note: Percentages are rounded and may not sum to 100.
As the Bureau of Labor Statistics notes, earnings improve with every level of education completed.
For example, those with a high school diploma made 25% more than those without in 2022. And as the qualifications increase, the effects keep stacking.
Meanwhile, a Federal Reserve study also found that those with more education tended to make financial decisions that contributed to building wealth, of which the first step is to save.

-

 Markets1 week ago
U.S. Debt Interest Payments Reach $1 Trillion
-

 Business2 weeks ago
Charted: Big Four Market Share by S&P 500 Audits
-

 Real Estate2 weeks ago
Ranked: The Most Valuable Housing Markets in America
-

 Money2 weeks ago
Which States Have the Highest Minimum Wage in America?
-

 AI2 weeks ago
Ranked: Semiconductor Companies by Industry Revenue Share
-

 Markets2 weeks ago
Ranked: The World’s Top Flight Routes, by Revenue
-

 Demographics2 weeks ago
Population Projections: The World’s 6 Largest Countries in 2075
-

 Markets2 weeks ago
The Top 10 States by Real GDP Growth in 2023