Mining
How are Silver and Gold Bullion Premiums Calculated?
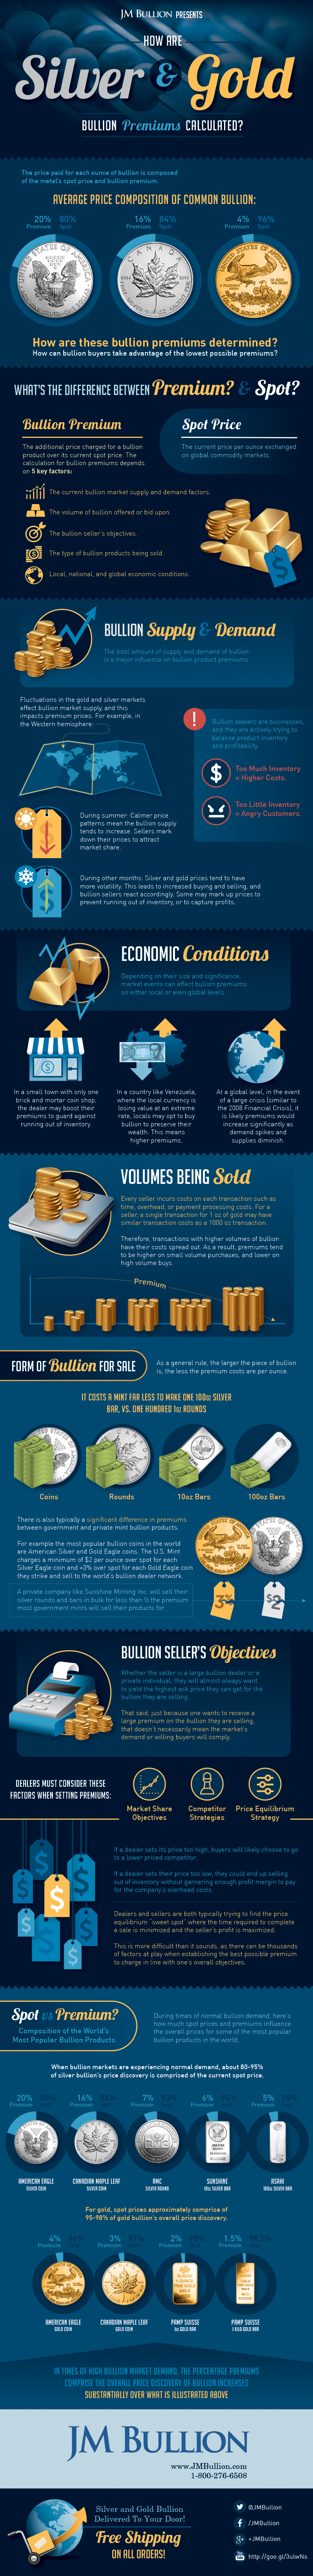
How are Silver and Gold Bullion Premiums Calculated?
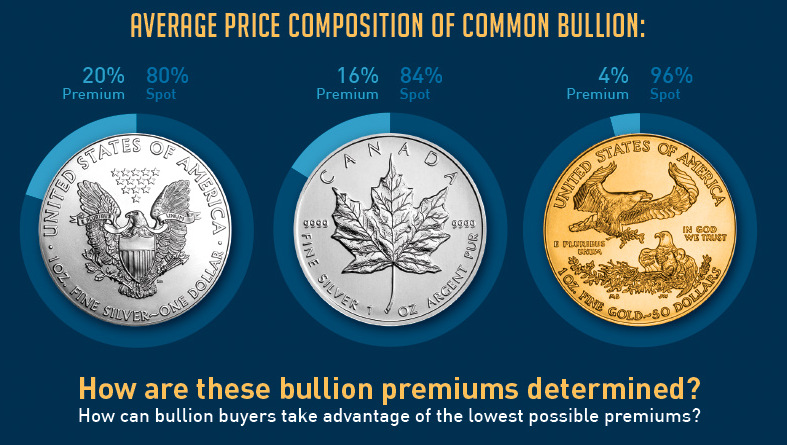
The price paid for each ounce of bullion is composed of the metal’s spot price and the bullion premium.
Here’s the price composition of some common rounds:
- Silver Eagle: 80% spot price / 20% bullion premium
- Silver Canadian Maple Leaf: 84% spot price / 16% bullion premium
- Gold Eagle: 96% spot price / 4% bullion premium
How are these bullion premiums determined? How can bullion buyers take advantage of the lowest possible premiums?
Difference Between Spot Prices and Bullion Premiums
Spot Price: The current price per ounce exchanged on global commodity markets.
Bullion Premium: The additional price charged for a bullion product over its current spot price.
The calculation for bullion premiums depends on five key factors:
- The current bullion market supply and demand factors.
- Local, national, and global economic conditions.
- The volume of bullion offered or bid upon.
- The type of bullion products being sold.
- The bullion seller’s objectives.
Bullion Supply and Demand
The total amount of supply and demand of bullion is a major influence on bullion product premiums.
Bullion dealers are businesses, and they are actively trying to balance product inventory and profitability. Too much inventory means high costs. Too little inventory means angry customers. Fluctuations in the gold and silver markets affect bullion market supply, and this impacts premium prices.
For example, in the Western hemisphere during the summer, calmer price patterns mean the bullion supply tends to increase. Sellers mark down their prices to attract market share.
During other months, silver and gold prices tend to have more volatility. This leads to increased buying and selling, and bullion sellers react accordingly. Some may mark up prices to prevent running out of inventory, or to capture profits.
Economic Conditions
Depending on their size and significance, market events can affect bullion premiums local to global stages.
Examples:
- In a small town with only one brick and mortar coin shop, the dealer may boost their premiums to guard against running out of inventory.
- In a country like Venezuela, where the local currency is losing value at an extreme rate, locals may opt to buy bullion to preserve their wealth. This means higher premiums.
- At a global level, in the event of a large crisis (similar to the 2008 Financial Crisis), it is likely premiums would increase significantly as demand spikes and options diminish.
Volumes Being Sold
Every seller incurs costs on each transaction such as time, overhead, or payment processing costs. For a seller, a single transaction for 1 oz of gold may have similar transaction costs as a 1000 oz transaction.
Therefore, transactions with higher volumes of bullion have their costs spread out. As a result, premiums tend to be higher on small volume purchases, and lower per oz on high volume buys.
Form of Bullion for Sale
As a general rule, the larger the piece of bullion is, the less the premium costs are per oz.
It costs a mint far less to make one 100 oz silver bar, vs. 100 rounds of 1 oz each.
There is also typically a significant difference in premiums between government and private mints.
For example the most popular bullion coins in the world are American Silver and Gold Eagle coins. The U.S. Mint charges a minimum of $2 oz over spot for each Silver Eagle coin and +3% over spot for each Gold Eagle coin they strike and sell to the world’s bullion dealer network.
A private company like Sunshine Minting will sell their silver rounds and bars in bulk for less than ½ the premium most government mints will sell their products for.
Bullion Seller’s Objectives
Whether the seller is a large bullion dealer or a private individual, they will almost always want to yield the highest ask price they can get for the bullion they are selling.
That said, just because one wants to receive a large premium on the bullion they are selling, that doesn’t necessarily mean the market’s demand or willing buyers will comply.
Dealers must consider these factors when setting premiums:
- Market share objectives
- Competitor strategies
- Price equilibrium strategy
If a dealer sets its price too high, buyers will likely choose to go to a lower priced competitor.
If a dealer sets their price too low, they could end up selling out of inventory without garnering enough profit margin to pay for the company’s overhead costs.
Dealers and sellers are both typically trying to find the price equilibrium “sweet spot” where the time required to complete a sale is minimized and the seller’s profit is maximized.
This is more difficult than it sounds, as there can be thousands of factors at play when establishing the best possible premium to charge in line with one’s overall objectives.
Price Composition for Bullion Products
When bullion markets are experiencing normal demand, about 80-95% of silver bullion’s price discovery is comprised of the current spot price.
For gold, spot prices approximately comprise of 95-98% of gold bullion’s overall price discovery.


Lithium
Ranked: The Top 10 EV Battery Manufacturers in 2023
Asia dominates this ranking of the world’s largest EV battery manufacturers in 2023.


The Top 10 EV Battery Manufacturers in 2023
This was originally posted on our Voronoi app. Download the app for free on iOS or Android and discover incredible data-driven charts from a variety of trusted sources.
Despite efforts from the U.S. and EU to secure local domestic supply, all major EV battery manufacturers remain based in Asia.
In this graphic we rank the top 10 EV battery manufacturers by total battery deployment (measured in megawatt-hours) in 2023. The data is from EV Volumes.
Chinese Dominance
Contemporary Amperex Technology Co. Limited (CATL) has swiftly risen in less than a decade to claim the title of the largest global battery group.
The Chinese company now has a 34% share of the market and supplies batteries to a range of made-in-China vehicles, including the Tesla Model Y, SAIC’s MG4/Mulan, and various Li Auto models.
| Company | Country | 2023 Production (megawatt-hour) | Share of Total Production |
|---|---|---|---|
| CATL | 🇨🇳 China | 242,700 | 34% |
| BYD | 🇨🇳 China | 115,917 | 16% |
| LG Energy Solution | 🇰🇷 Korea | 108,487 | 15% |
| Panasonic | 🇯🇵 Japan | 56,560 | 8% |
| SK On | 🇰🇷 Korea | 40,711 | 6% |
| Samsung SDI | 🇰🇷 Korea | 35,703 | 5% |
| CALB | 🇨🇳 China | 23,493 | 3% |
| Farasis Energy | 🇨🇳 China | 16,527 | 2% |
| Envision AESC | 🇨🇳 China | 8,342 | 1% |
| Sunwoda | 🇨🇳 China | 6,979 | 1% |
| Other | - | 56,040 | 8% |
In 2023, BYD surpassed LG Energy Solution to claim second place. This was driven by demand from its own models and growth in third-party deals, including providing batteries for the made-in-Germany Tesla Model Y, Toyota bZ3, Changan UNI-V, Venucia V-Online, as well as several Haval and FAW models.
The top three battery makers (CATL, BYD, LG) collectively account for two-thirds (66%) of total battery deployment.
Once a leader in the EV battery business, Panasonic now holds the fourth position with an 8% market share, down from 9% last year. With its main client, Tesla, now sourcing batteries from multiple suppliers, the Japanese battery maker seems to be losing its competitive edge in the industry.
Overall, the global EV battery market size is projected to grow from $49 billion in 2022 to $98 billion by 2029, according to Fortune Business Insights.

-

 Markets1 week ago
U.S. Debt Interest Payments Reach $1 Trillion
-

 Business2 weeks ago
Charted: Big Four Market Share by S&P 500 Audits
-

 Real Estate2 weeks ago
Ranked: The Most Valuable Housing Markets in America
-

 Money2 weeks ago
Which States Have the Highest Minimum Wage in America?
-

 AI2 weeks ago
Ranked: Semiconductor Companies by Industry Revenue Share
-

 Markets2 weeks ago
Ranked: The World’s Top Flight Routes, by Revenue
-

 Demographics2 weeks ago
Population Projections: The World’s 6 Largest Countries in 2075
-

 Markets2 weeks ago
The Top 10 States by Real GDP Growth in 2023