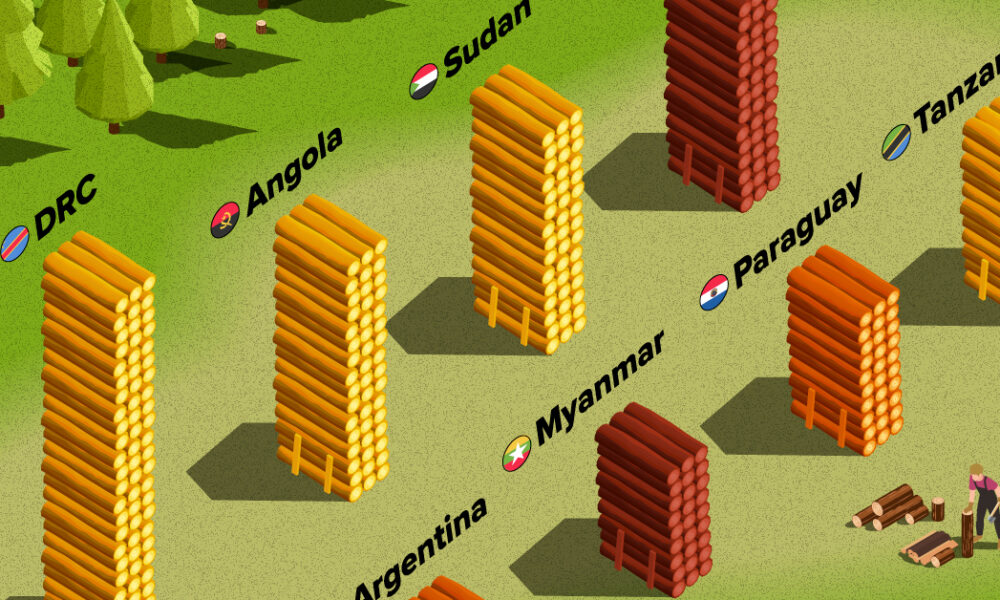
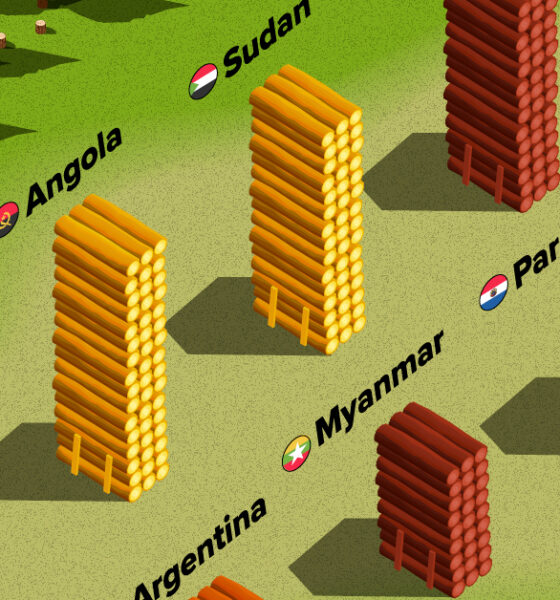
The country with the most forest loss since 2001 lost as much forest cover as the next four countries combined.
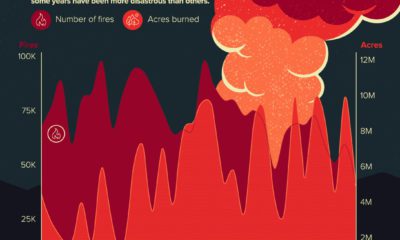

Here’s a look at the number of wildfires in America that have occurred each year since 1990, and the acres of forest land scorched during that...
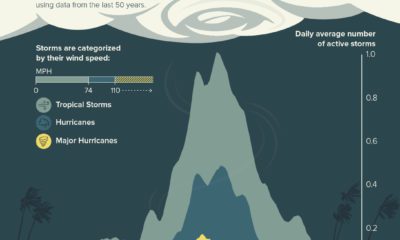

While the Atlantic hurricane season runs from June to late November, about 85% of activity happens between August, September, and October.


This unique map graphic uses the Great Lakes region as a point of comparison for the top 25 largest lakes in the world.


Our planet supports nearly 8.7 million species. We break down the total composition of the living world in terms of its biomass.
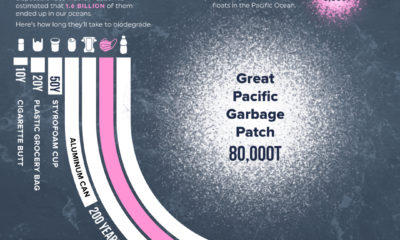

1.6 billion face masks entered our oceans in 2020, representing 5,500 tons of plastic pollution.
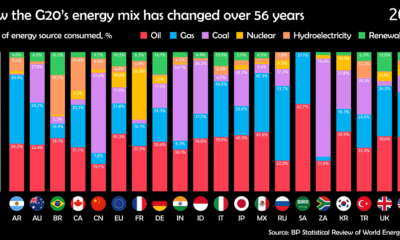

Watch how the energy mix of G20 countries has evolved over the last 50+ years.
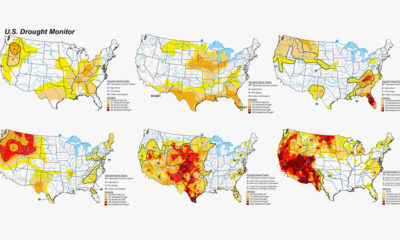

The Western U.S. is no stranger to droughts. But this year's is one of the worst yet. Here's a historical look at U.S. droughts since 1999.
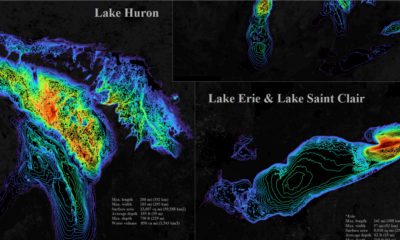

The five Great Lakes account for 21% of the world's total freshwater. This bathymetric visualization dives into just how deep they are.
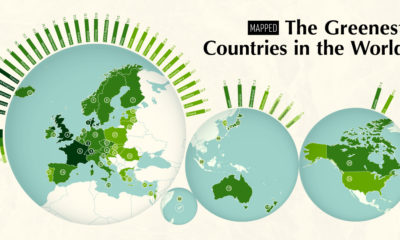

The world's growing focus on sustainability is a clear sign of the times. This map ranks the 40 greenest countries in the world.
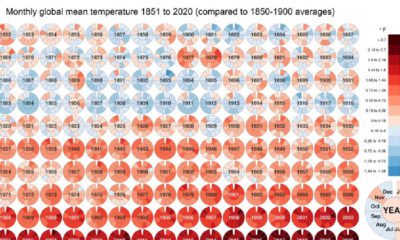

Global Temperature Graph (1851-2020) View the high-resolution of the infographic by clicking here. Since 1880, the Earth’s average surface temperature has risen by 0.07°C (0.13°F) every...


