Datastream
Chart: 30 Years of Wildfires in America


The Briefing
- An average of 70,000 wildfires blaze through the U.S. each year
- These fires destroy approximately 5.8 million acres of land on a yearly basis
- Over 43,000 fires have started across the U.S., burning 5 million acres of land as of Sept 3, 2021
30 Years of Wildfires in America
This summer, record-breaking droughts and relentless heat waves have fueled disastrous wildfires across the United States. It’s gotten so bad, the state of California has decided to shut down all national forests for two weeks to stop the spread.
But how disastrous has this year been compared to previous years? This graphic gives a historical look at the number of wildfires in America that have occurred each year since 1990, and the acres of forest land scorched during that period.
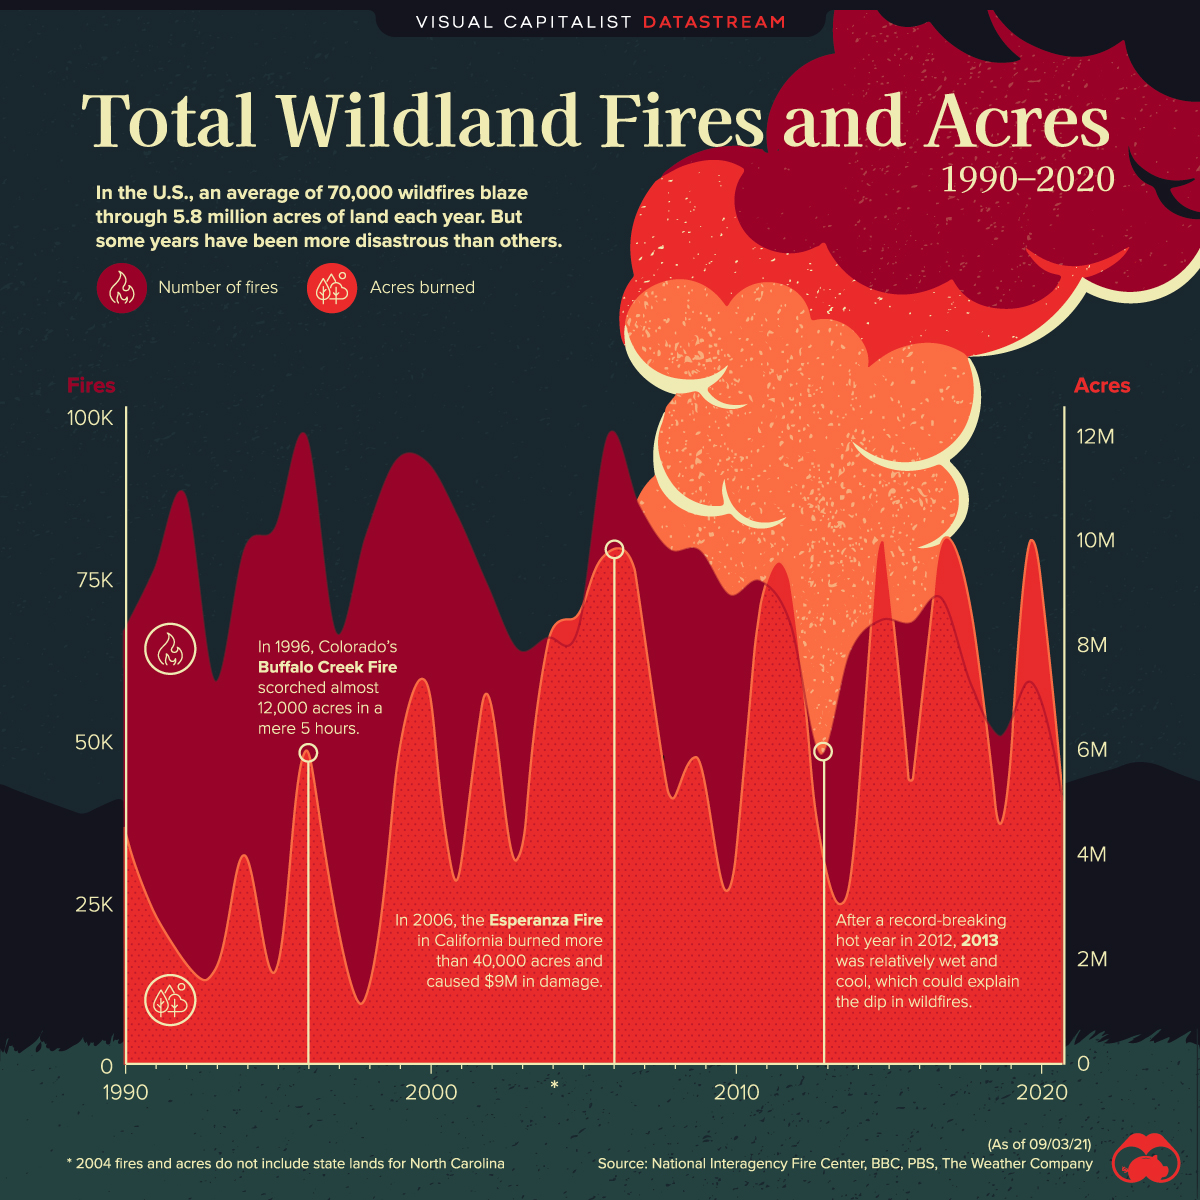
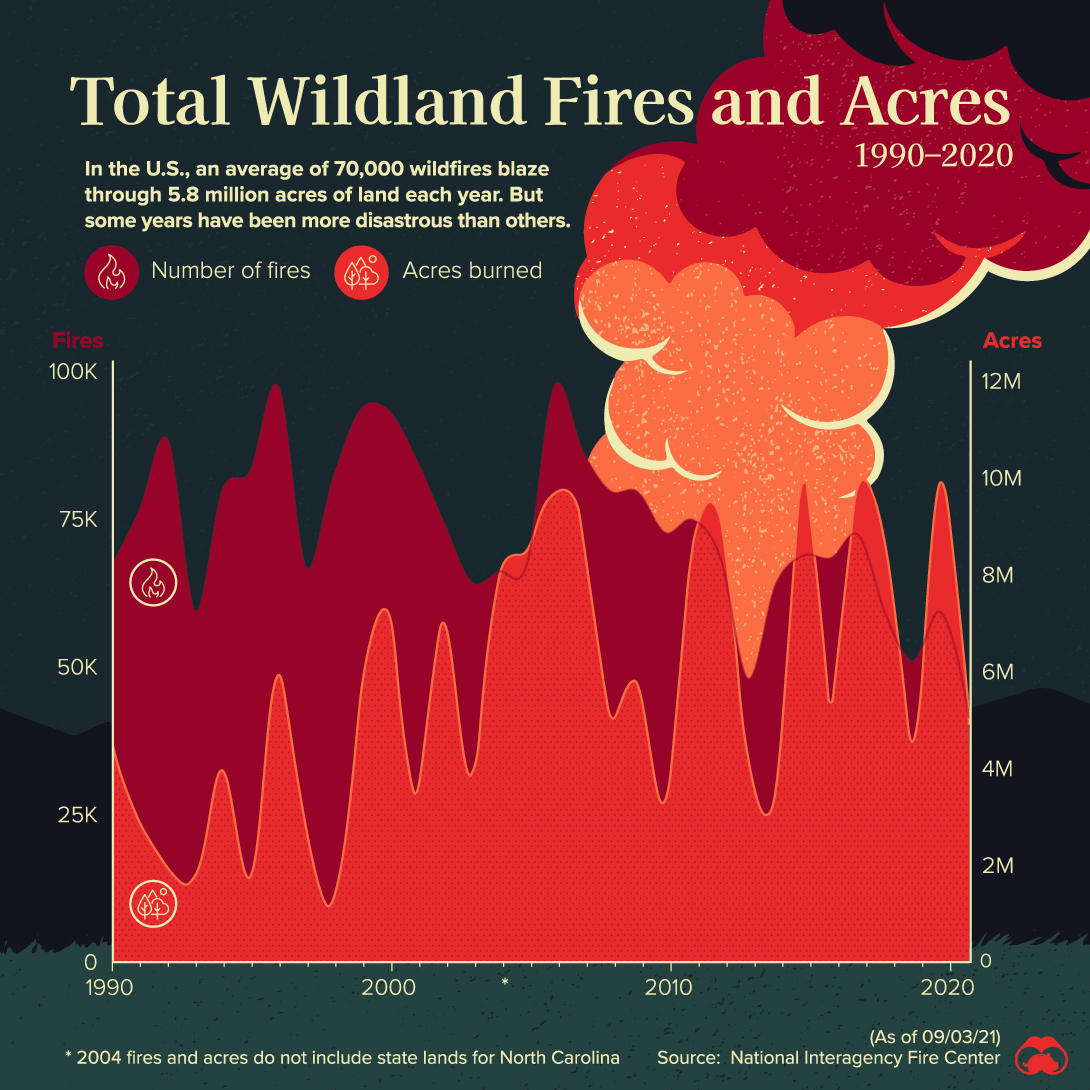
Total Wildland Fires and Acres from 1990 to 2020
In the U.S., an average of 70,000 wildfires burn through 5.8 million acres of land each year. But some years have been worse than others.
| Year | # of Fires | # of Acres Burned |
|---|---|---|
| 1990 | 66,481 | 4,621,621 |
| 1991 | 75,754 | 2,953,578 |
| 1992 | 87,394 | 2,069,929 |
| 1993 | 58,810 | 1,797,574 |
| 1994 | 79,107 | 4,073,579 |
| 1995 | 82,234 | 1,840,546 |
| 1996 | 96,363 | 6,065,998 |
| 1997 | 66,196 | 2,856,959 |
| 1998 | 81,043 | 1,329,704 |
| 1999 | 92,487 | 5,626,093 |
| 2000 | 92,250 | 7,393,493 |
| 2001 | 84,079 | 3,570,911 |
| 2002 | 73,457 | 7,184,712 |
| 2003 | 63,629 | 3,960,842 |
| 2004 | 65,461 | *8,097,880 |
| 2005 | 66,753 | 8,689,389 |
| 2006 | 96,385 | 9,873,745 |
| 2007 | 85,705 | 9,328,045 |
| 2008 | 78,979 | 5,292,468 |
| 2009 | 78,792 | 5,921,786 |
| 2010 | 71,971 | 3,422,724 |
| 2011 | 74,126 | 8,711,367 |
| 2012 | 67,774 | 9,326,238 |
| 2013 | 47,579 | 4,319,546 |
| 2014 | 63,312 | 3,595,613 |
| 2015 | 68,151 | 10,125,149 |
| 2016 | 67,743 | 5,509,995 |
| 2017 | 71,499 | 10,026,086 |
| 2018 | 58,083 | 8,767,492 |
| 2019 | 50,477 | 4,664,364 |
| 2020 | 58,950 | 10,122,336 |
| 2021* | 43,250 | 5,024,744 |
*note: 2021 figures as of September 3, 2021
One particularly bad year was 2006, which had over 96,000 fires and destroyed 9.9 million acres of land across the country. It was the year of the Esperanza Fire in California, which burned 40,000 acres and cost $9 million in damages.
2015 was also a devastating year, with over 10.1 million acres destroyed across the country–the worst year on record, in terms of acres burned.
Climate Change’s Role in Wildfires
Wildfires are only expected to worsen in the near future since warmer temperatures and drier climates allow the fires to grow quickly and intensely.
We’re already starting to see climate change impact the wildfire season. For instance, autumn is usually peak wildfire season for California, but this year, one of the largest fires on record started in mid-July, and is still burning as of the date of publication.
Editor’s note, September 20, 2021: In the post above, we said that California closed downed down all national parks for two weeks, starting August 31st. In fact, they closed down all national forests.
Where does this data come from?
Source: National Interagency Fire Center
Details: 2004 fires and acres do not include state lands for North Carolina.


Datastream
Can You Calculate Your Daily Carbon Footprint?
Discover how the average person’s carbon footprint impacts the environment and learn how carbon credits can offset your carbon footprint.


The Briefing
- A person’s carbon footprint is substantial, with activities such as food consumption creating as much as 4,500 g of CO₂ emissions daily.
- By purchasing carbon credits from Carbon Streaming Corporation, you can offset your own emissions and fund positive climate action.
Your Everyday Carbon Footprint
While many large businesses and countries have committed to net-zero goals, it is essential to acknowledge that your everyday activities also contribute to global emissions.
In this graphic, sponsored by Carbon Streaming Corporation, we will explore how the choices we make and the products we use have a profound impact on our carbon footprint.
Carbon Emissions by Activity
Here are some of the daily activities and products of the average person and their carbon footprint, according to Clever Carbon.
| Household Activities & Products | CO2 Emissions (g) |
|---|---|
| 💡 Standard Light Bulb (100 watts, four hours) | 172 g |
| 📱 Mobile Phone Use (195 minutes per day)* | 189 g |
| 👕 Washing Machine (0.63 kWh) | 275 g |
| 🔥 Electric Oven (1.56 kWh) | 675 g |
| ♨️ Tumble Dryer (2.5 kWh) | 1,000 g |
| 🧻 Toilet Roll (2 ply) | 1,300 g |
| 🚿 Hot Shower (10 mins) | 2,000 g |
| 🚙 Daily Commute (one hour, by car) | 3,360 g |
| 🍽️ Average Daily Food Consumption (three meals of 600 calories) | 4,500 g |
| *Phone use based on yearly use of 69kg per the source, Reboxed | |
Your choice of transportation plays a crucial role in determining your carbon footprint. For instance, a 15 km daily commute to work on public transport generates an average of 1,464 g of CO₂ emissions. Compared to 3,360 g—twice the volume for a journey the same length by car.
By opting for more sustainable modes of transport, such as cycling, walking, or public transportation, you can significantly reduce your carbon footprint.
Addressing Your Carbon Footprint
One way to compensate for your emissions is by purchasing high-quality carbon credits.
Carbon credits are used to help fund projects that avoid, reduce or remove CO₂ emissions. This includes nature-based solutions such as reforestation and improved forest management, or technology-based solutions such as the production of biochar and carbon capture and storage (CCS).
While carbon credits offer a potential solution for individuals to help reduce global emissions, public awareness remains a significant challenge. A BCG-Patch survey revealed that only 34% of U.S. consumers are familiar with carbon credits, and only 3% have purchased them in the past.
About Carbon Streaming
By financing the creation or expansion of carbon projects, Carbon Streaming Corporation secures the rights to future carbon credits generated by these sustainable projects. You can then purchase these carbon credits to help fund climate solutions around the world and compensate for your own emissions.
Ready to get involved?
>> Learn more about purchasing carbon credits at Carbon Streaming

-

 Maps2 weeks ago
Mapped: Average Wages Across Europe
-

 Money1 week ago
Which States Have the Highest Minimum Wage in America?
-

 Real Estate1 week ago
Ranked: The Most Valuable Housing Markets in America
-

 Markets1 week ago
Charted: Big Four Market Share by S&P 500 Audits
-

 AI1 week ago
The Stock Performance of U.S. Chipmakers So Far in 2024
-

 Automotive2 weeks ago
Almost Every EV Stock is Down After Q1 2024
-

 Money2 weeks ago
Where Does One U.S. Tax Dollar Go?
-

 Green2 weeks ago
Ranked: Top Countries by Total Forest Loss Since 2001