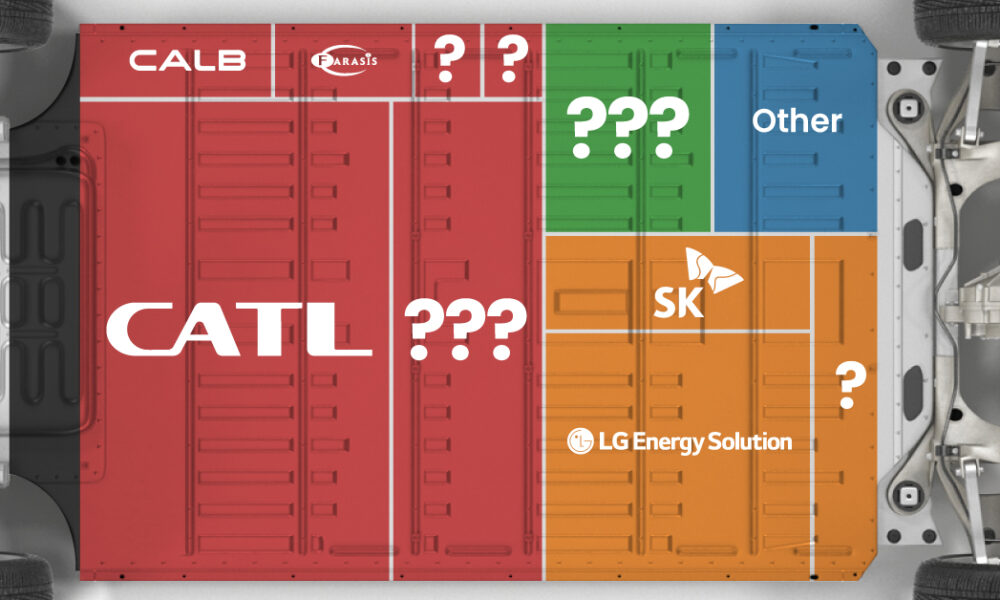
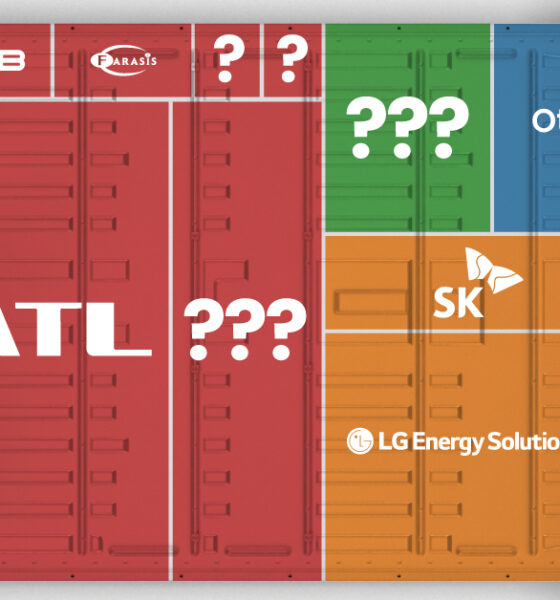
Asia dominates this ranking of the world's largest EV battery manufacturers in 2023.
This infographic shows how five global brands are already using large amounts of renewable energy, including Microsoft, Google, Ikea, Sony, and Walmart.
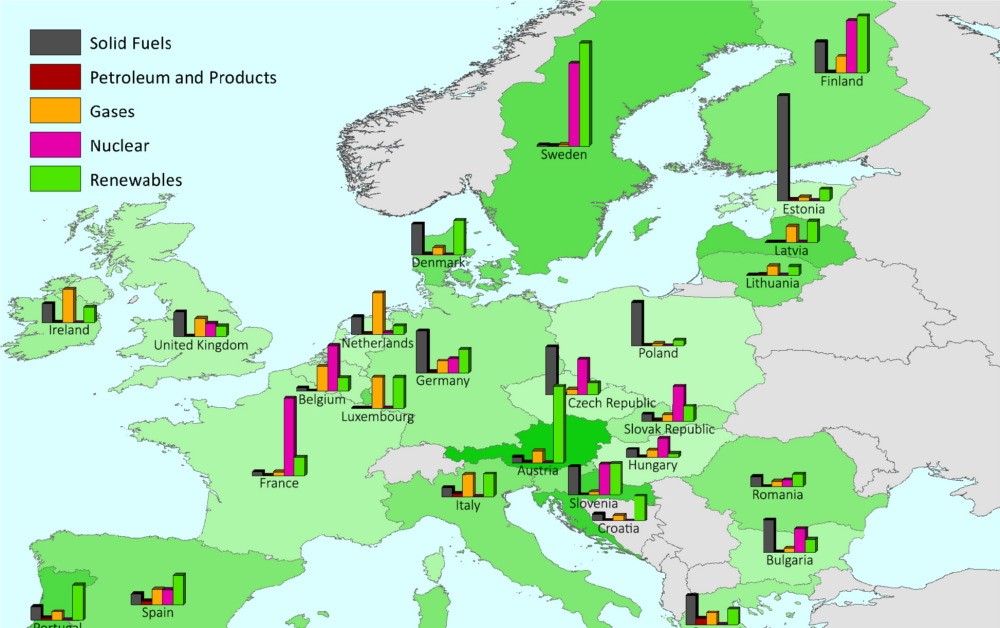
This series of charts and maps show an overview of Europe's energy consumption, as well as consumption (per capita) by country and source.
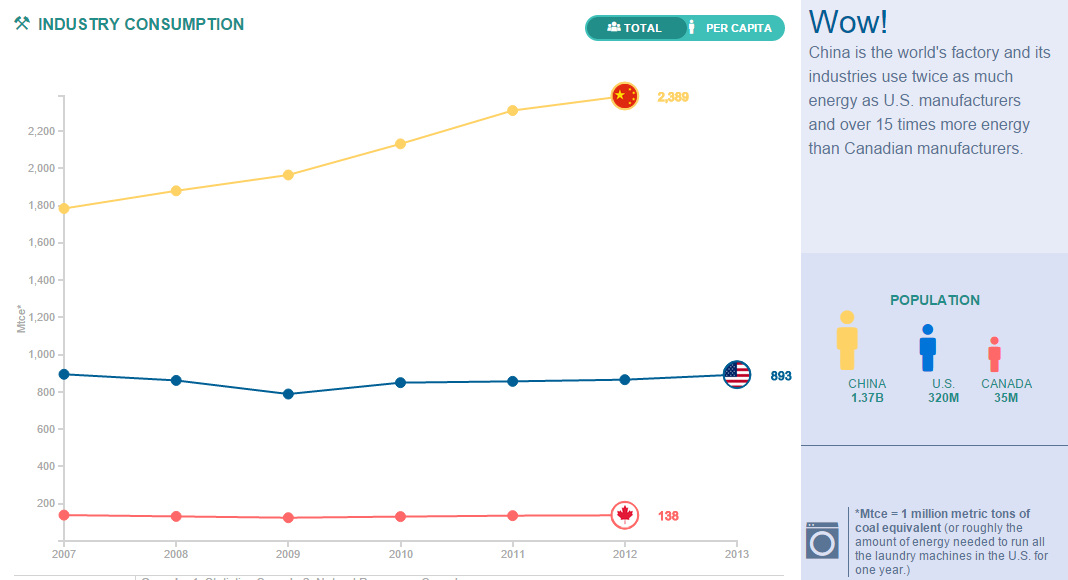
Compare the United States, China, and Canada side-by-side to see the differences in how these energy titans consume, produce, and import/export energy.
The commodity sector has struggled, but there is one area bucking the trend: energy metals. See the momentum in clean energy and the lithium revolution.
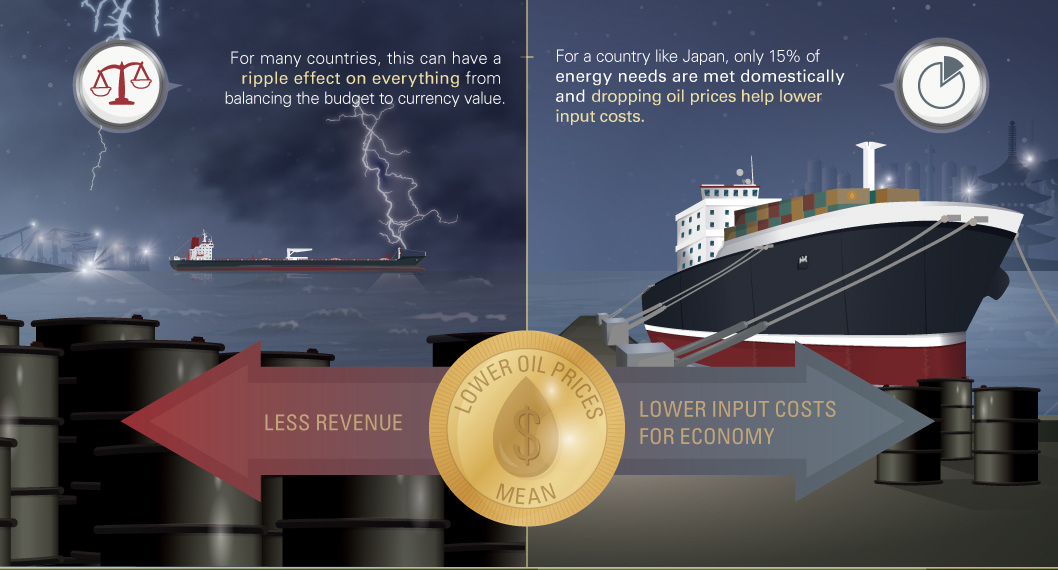
Plunging oil prices have profound effects on major importers and exporters of oil. In this case, we look at how currencies of net exporters are impacted.
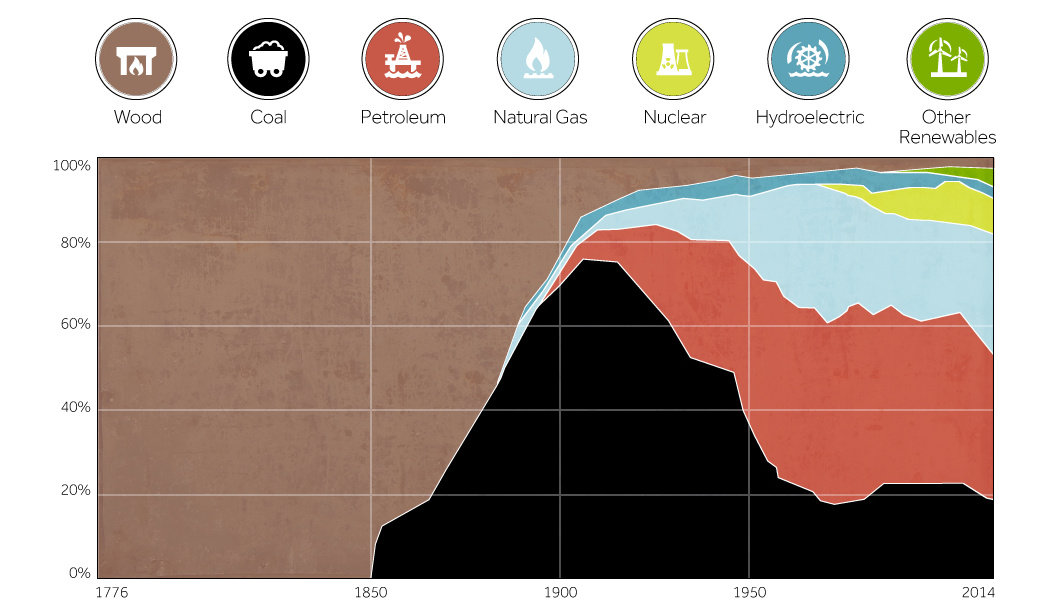
This chart shows the history of America's energy supply based on energy source. This brief history covers all from wood-powered locomotives to solar panels.
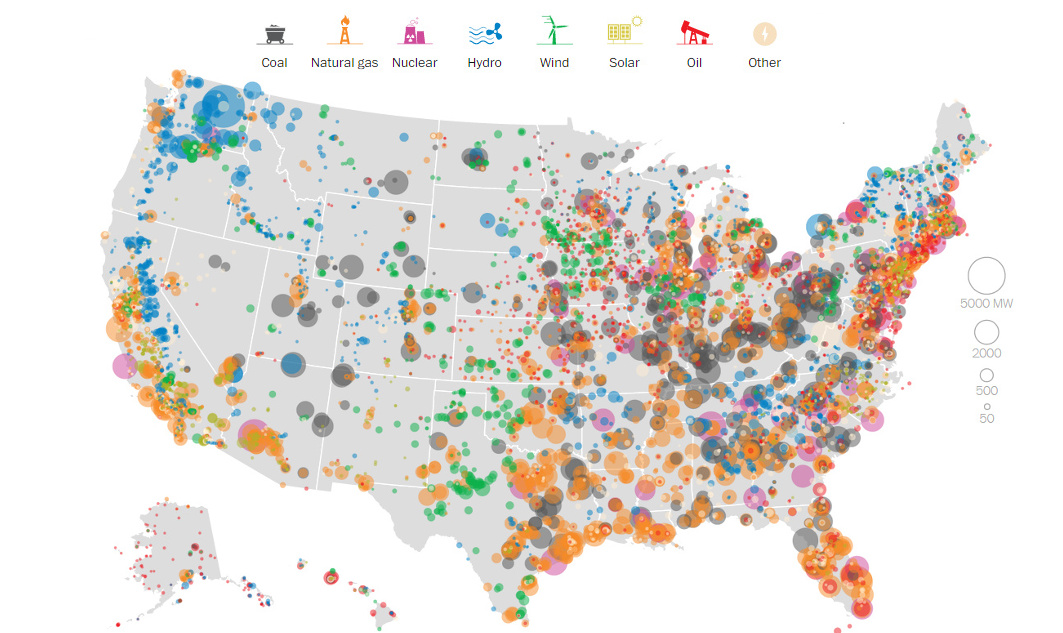
This series of data visualizations shows how the United States has generated its electricity so far in 2015 by energy source and size of each power...
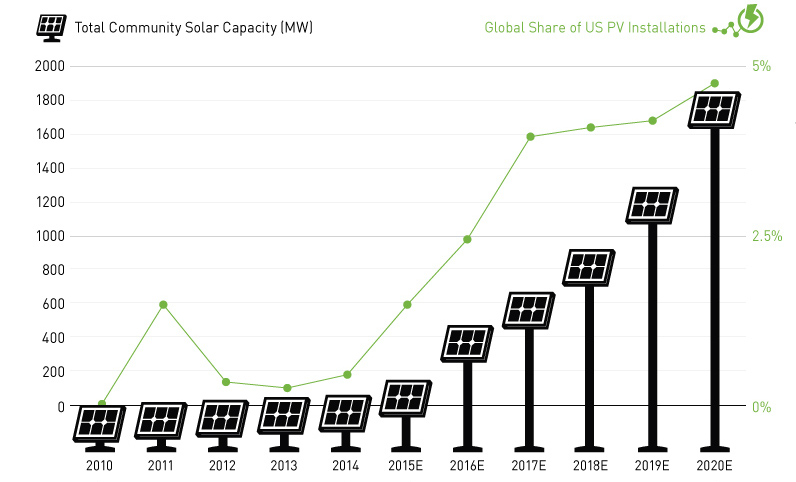
New installations of community solar farms are taking off, with cumulative capacity in the United States to increase sevenfold over the next two years.
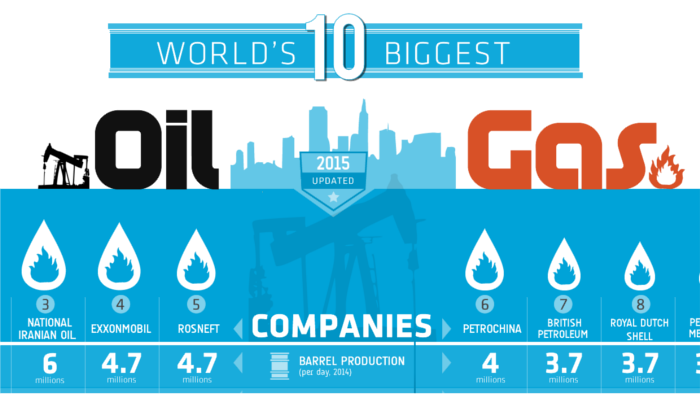
Ranking the world's 10 biggest oil and gas companies by oil production per day, country, and production growth over the last decade.
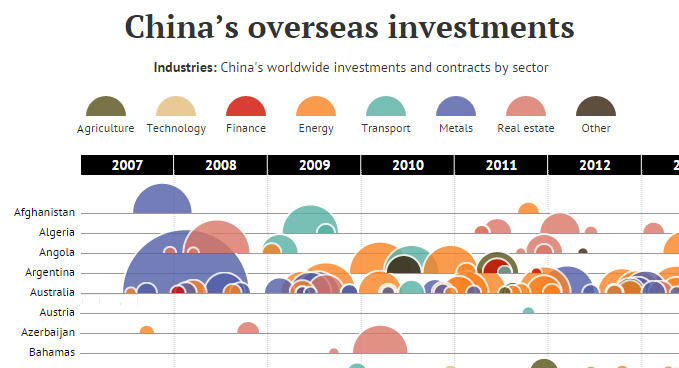
In this data visualization, every attempted Chinese overseas investment over $100 million is organized by country and sector.


