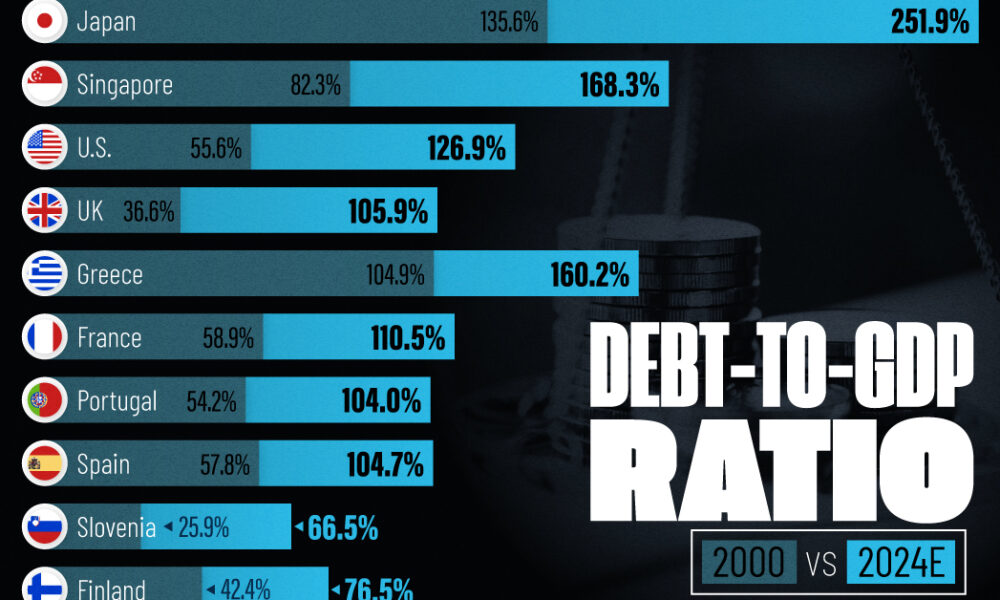
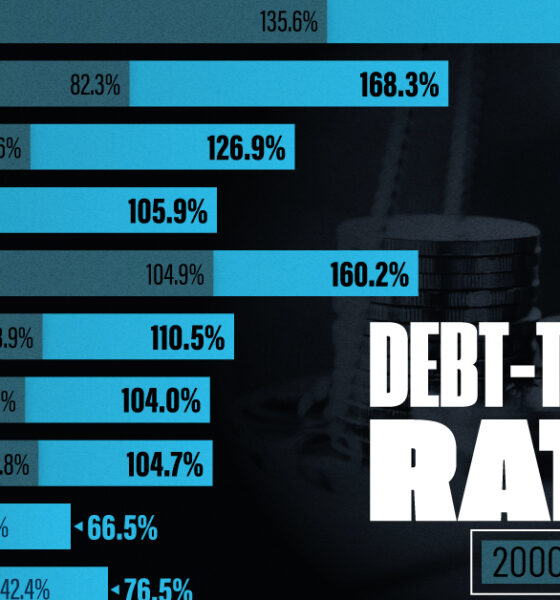
See how much the debt-to-GDP ratios of advanced economies have grown (or shrank) since the year 2000.
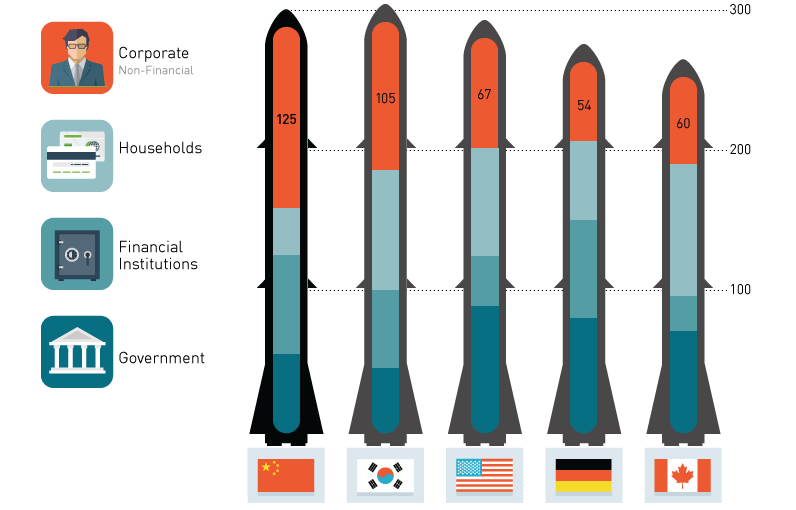
No one knows the size of China's debt bomb. Here we look at estimates of the payload as well as what could potentially ignite the fuse.
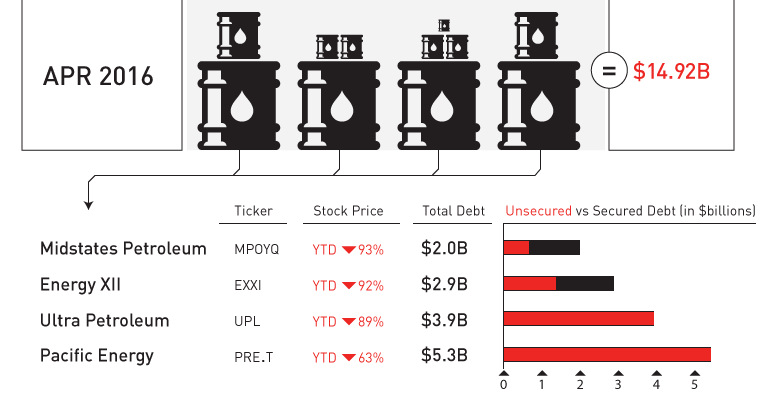
April was a record-setting month for bankruptcies in the oil patch. We put the 11 bankruptcies and $15 billion of outstanding debt in context.

Today, credit cards are a key source of profits for big banks. But, it wasn't always this way - the history of credit cards shows things...
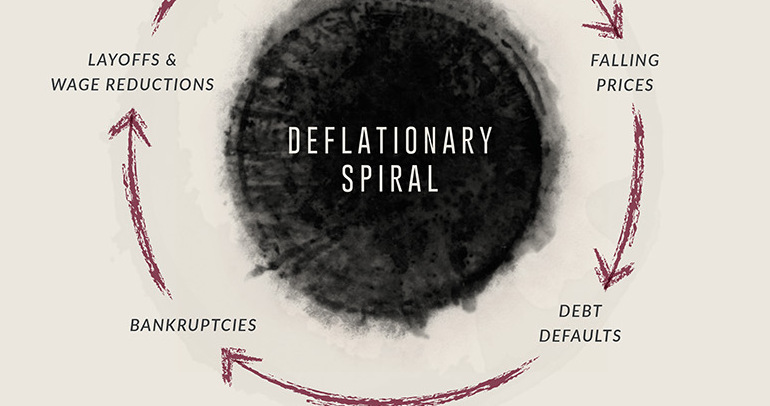
Banks collapsed, and millions were out of work. This infographic, part 2 of 2, details the extent of The Great Depression as well as the deflationary...

The Great Depression was the most severe economic depression ever experienced by the Western world. It was also the most famous case of deflation.
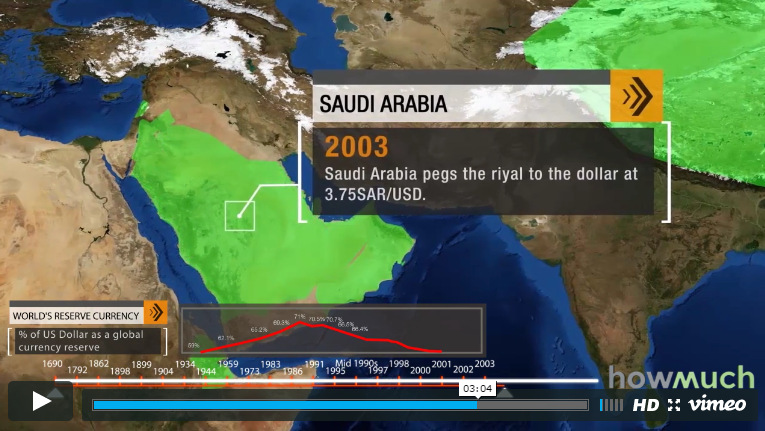
The U.S. dollar is the dominant reserve currency, making up 64% of global reserves. How did this come to be, and what does the future hold...
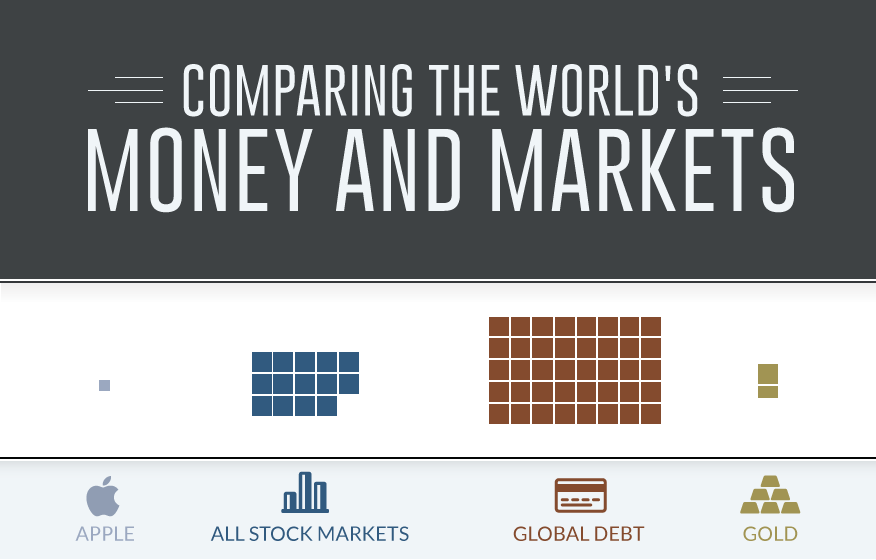
This data visualization compares the world's money supply and markets to give a sense of perspective.
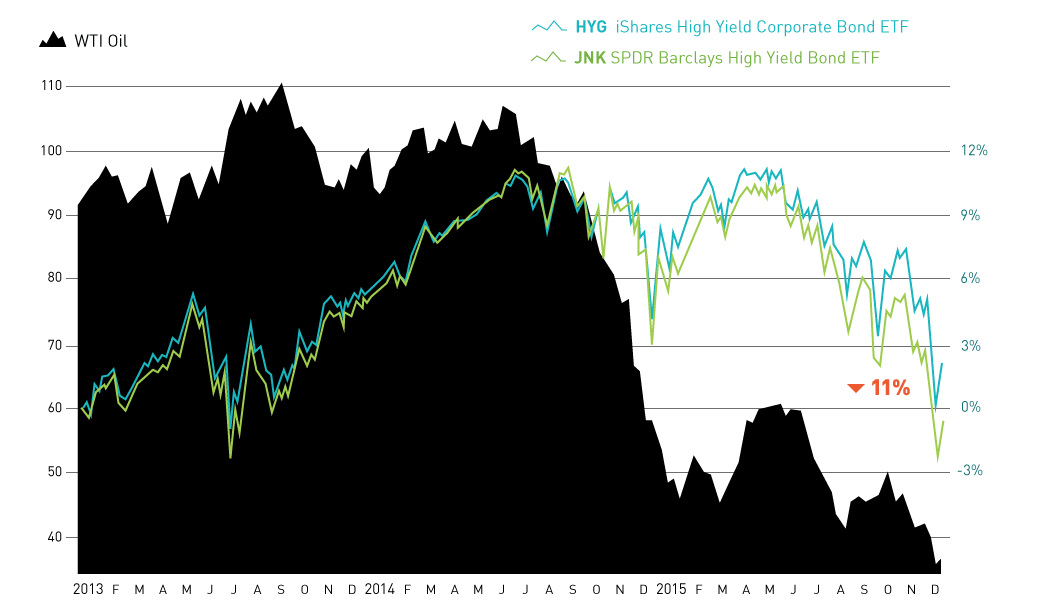
The month of December so far has seen a mini-meltdown in the junk bond market. The culprit? Fringe oil and gas producers that are struggling with...
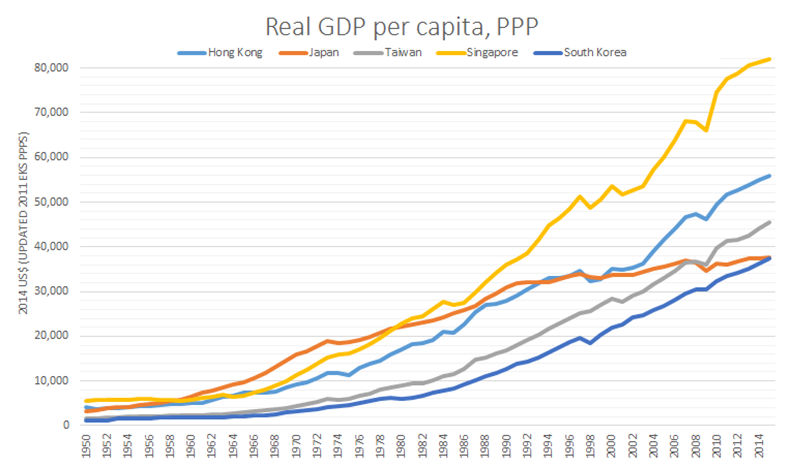
After 25 years of economic stagnation, Japan has finally been leapfrogged by all four so-called Asian Tigers: Hong Kong, Singapore, S. Korea, and Taiwan.
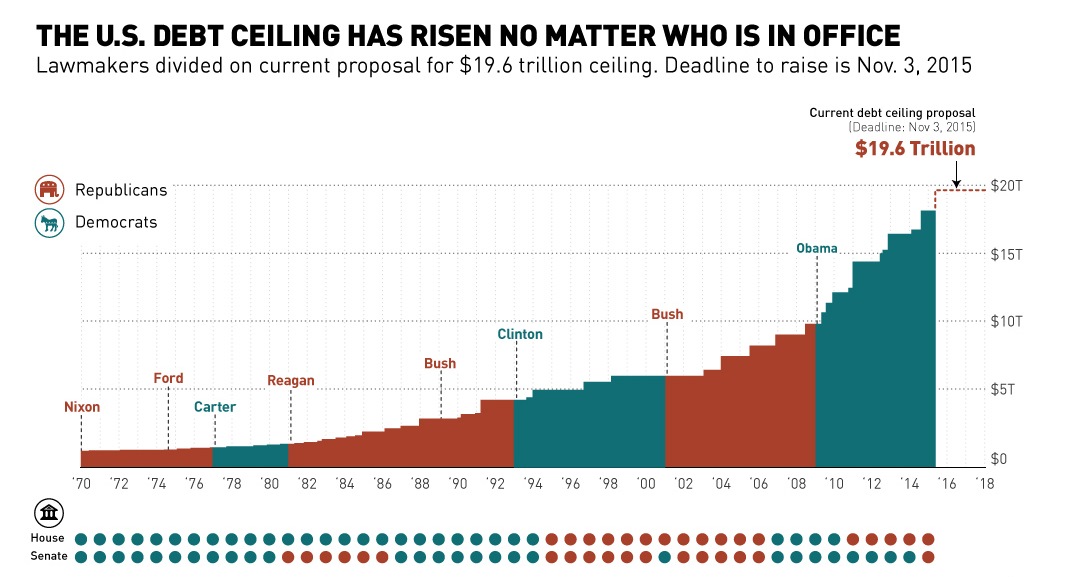
This chart shows the history of the U.S. debt ceiling from 1970 until today, including the current proposal to increase it to $19.6 trillion.


