Jobs
The Biggest Tech Talent Hubs in the U.S. and Canada


The Biggest Tech Talent Hubs in the U.S. and Canada
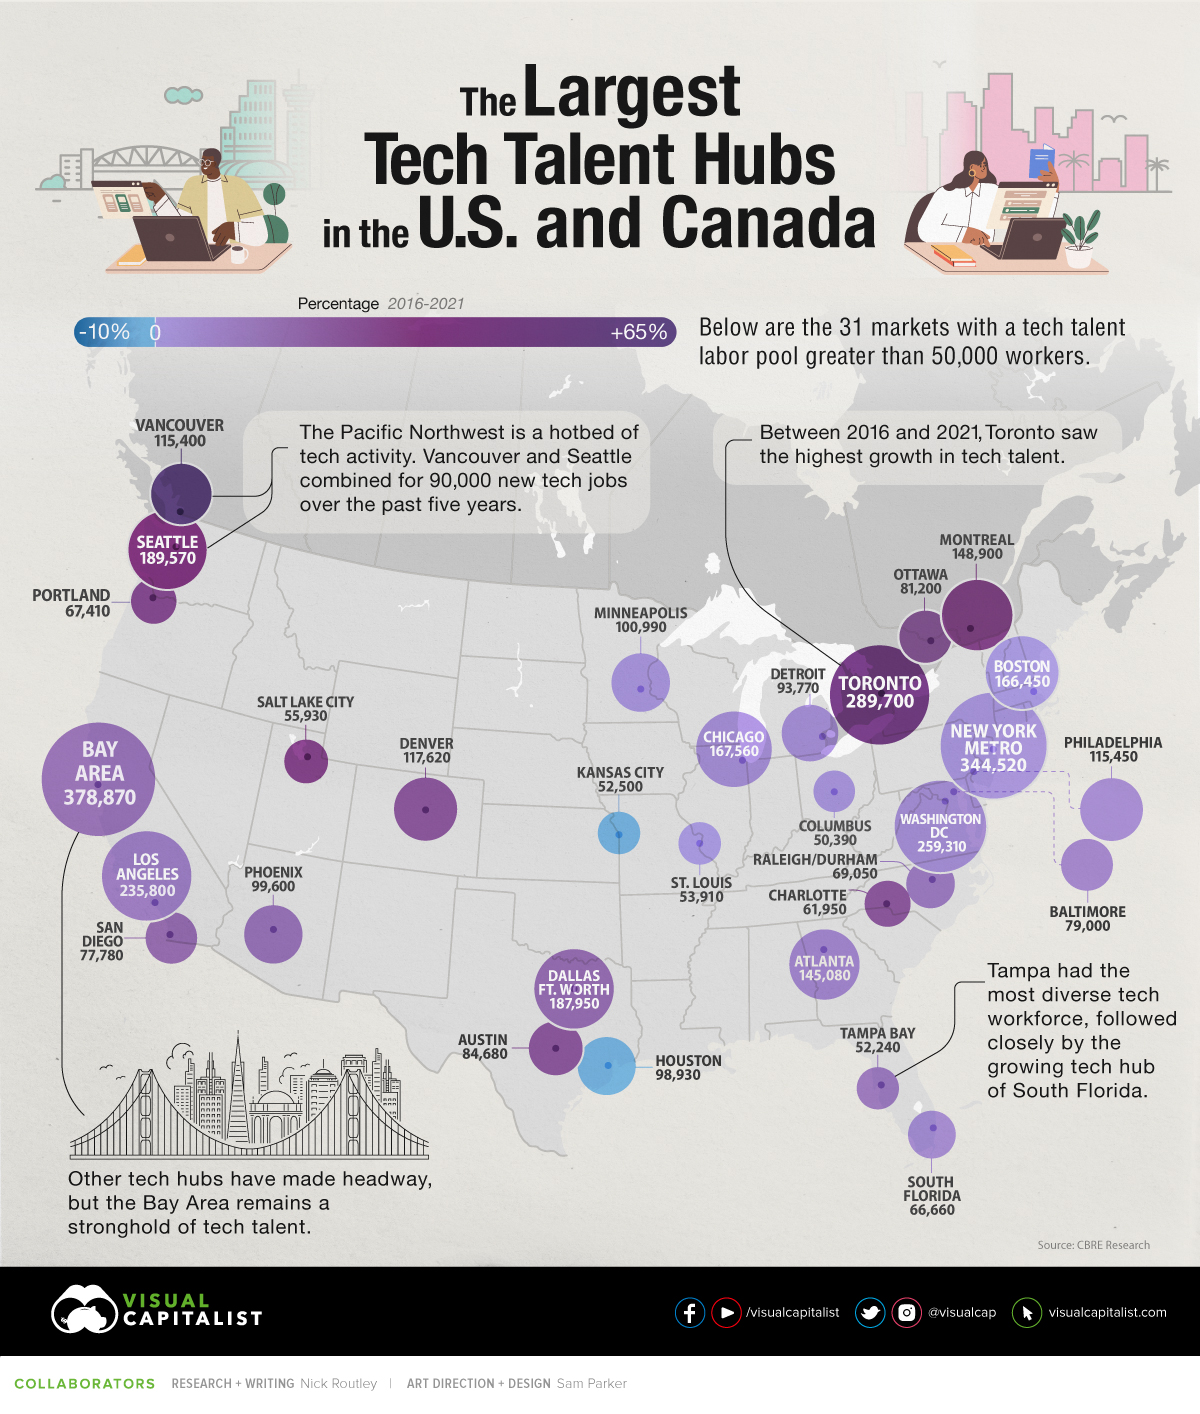
The tech workforce just keeps growing. In fact, there are now an estimated 6.5 million tech workers between the U.S. and Canada — 5.5 million of which work in the United States.
This infographic draws from a report by CBRE to determine which tech talent markets in the U.S. and Canada are the largest. The data looks at total workforce in the sector, as well as the change in tech worker population over time in various cities.
The report also classifies which metro areas and regions can rightly be considered tech hubs in the first place, by looking at a variety of factors including cost of living, average educational attainment, and tech employment levels as a share of different industries.
The Top Tech Hubs in the U.S.
Silicon Valley, in California’s Bay Area, remains the most prominent (and expensive) U.S. tech hub, with a talent pool of nearly 380,000 tech workers.
Here’s a look at the top tech talent markets in the country in terms of total worker population:
| 🇺🇸 Market | Total Tech Talent | % Talent Growth (2016-2021) |
|---|---|---|
| SF Bay Area | 378,870 | 13% |
| New York Metro | 344,520 | 3% |
| Washington D.C. | 259,310 | 6% |
| Los Angeles | 235,800 | 10% |
| Seattle | 189,570 | 32% |
| Dallas/Ft. Worth | 187,950 | 15% |
| Chicago | 167,560 | 6% |
| Boston | 166,450 | 2% |
| Atlanta | 145,080 | 7% |
| Denver | 117,620 | 23% |
| Philadelphia | 115,450 | 7% |
| Minneapolis | 100,990 | 5% |
| Phoenix | 99,600 | 18% |
| Houston | 98,930 | -2% |
| Detroit | 93,770 | 5% |
| Austin | 84,680 | 21% |
| Baltimore | 79,000 | 8% |
| San Diego | 77,780 | 16% |
| Raleigh/Durham | 69,050 | 11% |
| Portland | 67,410 | 28% |
| South Florida | 66,660 | 8% |
| Charlotte | 61,950 | 22% |
| Salt Lake City | 55,930 | 29% |
| St. Louis | 53,910 | 2% |
| Kansas City | 52,500 | 0% |
| Tampa | 52,240 | 13% |
| Columbus | 50,390 | 4% |
America’s large, coastal cities still contain the lion’s share of tech talent, but mid-sized tech hubs like Salt Lake City, Portland, and Denver have put up strong growth numbers in recent years. Seattle, which is home to both Amazon and Microsoft, posted an impressive 32% growth rate over the last five years.
Emerging tech hubs include areas like Raleigh-Durham. The two cities have nearly 70,000 employed tech workers and a strong talent pipeline, seeing a 28% increase in degree completions in fields like Math/Statistics and Computer Engineering year-over-year to 2020. In fact, the entire state of North Carolina is becoming an increasingly attractive business hub.
Houston was the one city on this list that had a negative growth rate, at -2%.
The Top Tech Hubs in Canada
Tech giants like Google, Meta, and Amazon are continuously and aggressively growing their presence in Canada, further solidifying the country’s status as the next big destination for tech talent. Here are the country’s four tech hubs with a total worker population of more than 50,000:
| 🇨🇦 Market | Total Tech Talent | % Talent Growth (2016-2021) |
|---|---|---|
| Toronto | 289,700 | 44% |
| Montreal | 148,900 | 27% |
| Vancouver | 115,400 | 63% |
| Ottawa | 81,200 | 22% |
Toronto saw the most absolute growth tech positions in 2021, adding 88,900 jobs. The tech sector in Canada’s largest city has seen a lot of momentum in recent years, and is now ranked by CBRE as North America’s #3 tech hub, after the SF Bay Area and New York City.
Vancouver’s tech talent population increased the most from its original figure, climbing 63%. Seattle-based companies like Microsoft and Amazon have established sizable offices in the city, adding to the already thriving tech scene. Furthermore, Google is set to build a submarine high-speed fiber optic cable connecting Canada to Asia, with a terminus in Vancouver.
Not to be left behind, Ottawa has also taken giant strides to increase their tech talent and stamp their presence. The country’s capital even has the highest concentration of tech employment in its workforce, thanks in part to the success of Shopify.
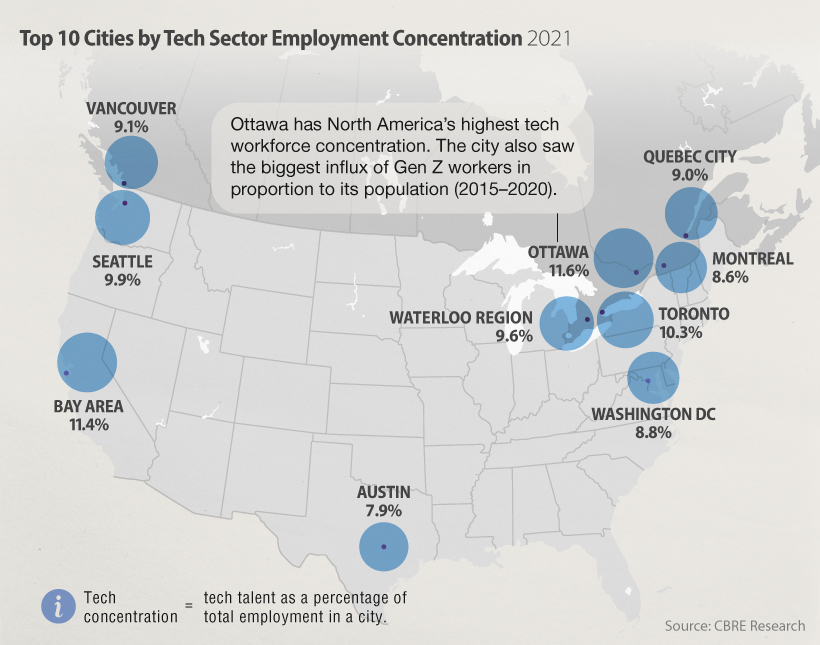
The small, but well-known tech hub of Waterloo also had a very high concentration on tech employment (9.6%). The region has seen its tech workforce grow by 8% over the past five years.
Six out of the top 10 cities by tech workforce concentration are located in Canada.
Evolution of Tech Hubs
The post-COVID era has seen a shifting definition of what a tech hub means. It’s clear that remote work is here to stay, and as workers migrate to chase affordability and comfort, traditional tech hubs are seeing some decline — or at least slower growth — in their population of tech workers.
While it isn’t evident that there is a mass exodus of tech talent from traditional coastal hubs, the rise in high-paying tech jobs in smaller markets across the country could point to a trend and is positive for the industry.
While more workers with great talent, resources, and education continue to opt for cost-friendly places to reside and work remotely, will newer markets like Charlotte, Tennessee, and Calgary see a rise of tech companies, or will large corporations and startups alike continue to opt for the larger cities on the coast?


Economy
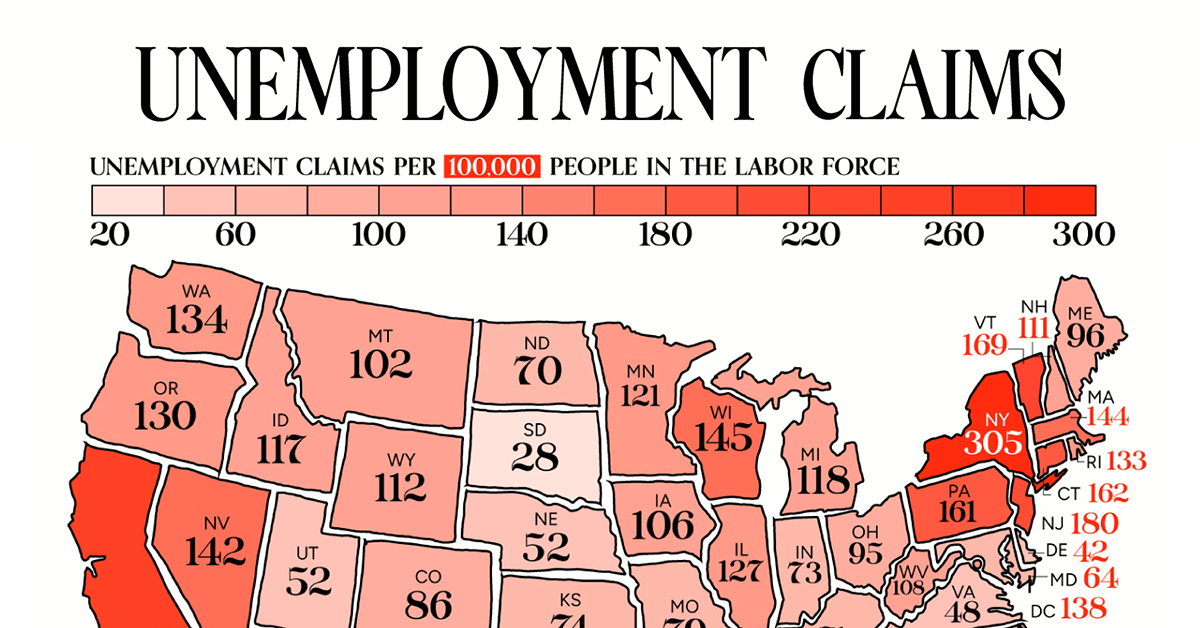
Mapped: Unemployment Claims by State
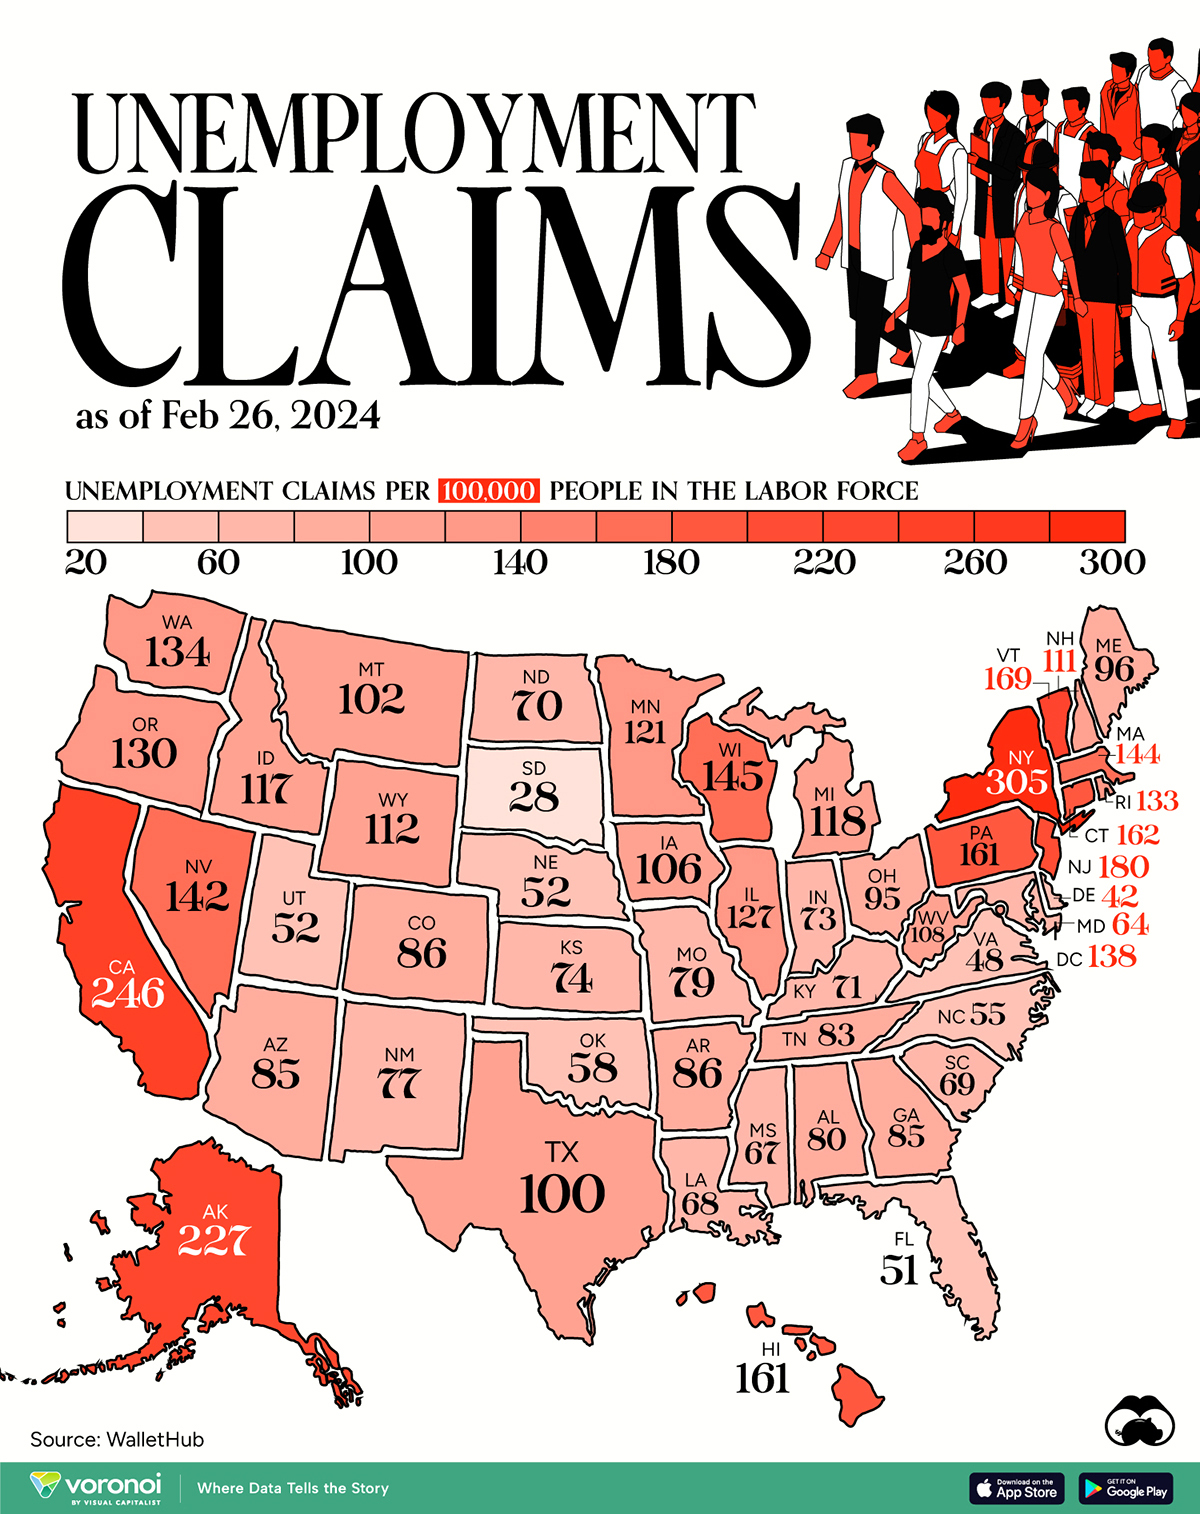
This visual heatmap of unemployment claims by state highlights New York, California, and Alaska leading the country by a wide margin.
Mapped: Weekly Unemployment Claims by State
This was originally posted on our Voronoi app. Download the app for free on iOS or Android and discover incredible data-driven charts from a variety of trusted sources.
Unemployment claims per 100,000 people is a handy metric for gauging the health of the job market. Generally speaking, a higher number of claims suggests that more people are unemployed, which may highlight issues with the economy.
In this graphic, we’ve visualized the number of weekly initial unemployment claims per 100,000 people in the labor force across the U.S., using data from WalletHub. All figures are for the week ending Feb 26, 2024, with data being released in early March.
| State | Unemployment Claims per 100,000 People in the Labor Force |
|---|---|
| New York | 305 |
| California | 246 |
| Alaska | 227 |
| New Jersey | 180 |
| Vermont | 169 |
| Connecticut | 162 |
| Pennsylvania | 161 |
| Hawaii | 161 |
| Wisconsin | 145 |
| Massachusetts | 144 |
| Nevada | 142 |
| DC | 138 |
| Washington | 134 |
| Rhode Island | 133 |
| Oregon | 130 |
| Illinois | 127 |
| Minnesota | 121 |
| Michigan | 118 |
| Idaho | 117 |
| Wyoming | 112 |
| New Hampshire | 111 |
| West Virginia | 108 |
| Iowa | 106 |
| Montana | 102 |
| Texas | 100 |
| Maine | 96 |
| Ohio | 95 |
| Colorado | 86 |
| Arkansas | 86 |
| Arizona | 85 |
| Georgia | 85 |
| Tennessee | 83 |
| Alabama | 80 |
| Missouri | 79 |
| New Mexico | 77 |
| Kansas | 74 |
| Indiana | 73 |
| Kentucky | 71 |
| North Dakota | 70 |
| South Carolina | 69 |
| Louisiana | 68 |
| Mississippi | 67 |
| Maryland | 64 |
| Oklahoma | 58 |
| North Carolina | 55 |
| Nebraska | 52 |
| Utah | 52 |
| Florida | 51 |
| Virginia | 48 |
| Delaware | 42 |
| South Dakota | 28 |
Across the country, there are 6.1 million Americans unemployed as of end of February, resulting in a national unemployment rate of around 3.9%. Notably, this is the highest figure seen since January 2022.
States With the Largest Increases
For further context, we can examine the change in unemployment claims by state for the period of Jan 1- Feb 26, in 2024 and 2023.
States that saw the biggest rise over this period were New York, New Jersey, and Nevada. A top 10 list can be found below.
| State | Change in Unemployment Claims (Jan-Feb, 2023 vs 2024) |
|---|---|
| New York | 2,725% |
| New Jersey | 2,132% |
| Nevada | 505% |
| Arizona | 51% |
| Iowa | 45% |
| Maryland | 35% |
| North Carolina | 34% |
| Virginia | 31% |
| Montana | 25% |
| Oklahoma | 24% |
From a broader perspective, weekly initial claims for unemployment insurance across the U.S. have hovered around the low 200,000s in 2024. This is generally in line with figures seen prior to the COVID-19 pandemic.
In the week of April 4, 2020, unemployment claims spiked to 6.137 million due to COVID-related lockdowns and business closures.
Learn More About the U.S Job Market
Before you go, be sure to check out Visualizing the American Workforce as 100 People to gain a unique perspective on the U.S. economy.

-

 Mining1 week ago
Gold vs. S&P 500: Which Has Grown More Over Five Years?
-

 Markets2 weeks ago
Ranked: The Most Valuable Housing Markets in America
-

 Money2 weeks ago
Which States Have the Highest Minimum Wage in America?
-

 AI2 weeks ago
Ranked: Semiconductor Companies by Industry Revenue Share
-

 Markets2 weeks ago
Ranked: The World’s Top Flight Routes, by Revenue
-

 Countries2 weeks ago
Population Projections: The World’s 6 Largest Countries in 2075
-

 Markets2 weeks ago
The Top 10 States by Real GDP Growth in 2023
-

 Demographics2 weeks ago
The Smallest Gender Wage Gaps in OECD Countries