Technology
Animation: The Biggest Tech Companies by Market Cap Over 23 Years
The business world is certainly not a static one.
In the past, we’ve shown that the market leaders in the most stable industries are unlikely to keep their leadership positions over long periods of time.
But limit your window to just the dynamic world of tech and you’ll see an even more extreme example of this inherent volatility. Sometimes companies are able to separate from the rest of the pack for days or months, but it’s never an advantage that lasts for long.
Biggest Tech Companies by Market Cap
Today’s animation was originally posted to Reddit by /r/TheNerdistRedditor and captures the crazy world of tech valuations for public companies.
Watch the intense 1 minute animation below:
Note: the data here only lists companies traded on U.S. exchanges, and does not show every single valuation point.
Over just 23 years, the company topping the list flips eight separate times – and if you were to get more granular with the numbers (looking at daily valuations, for example), you’d see it happen far more often.
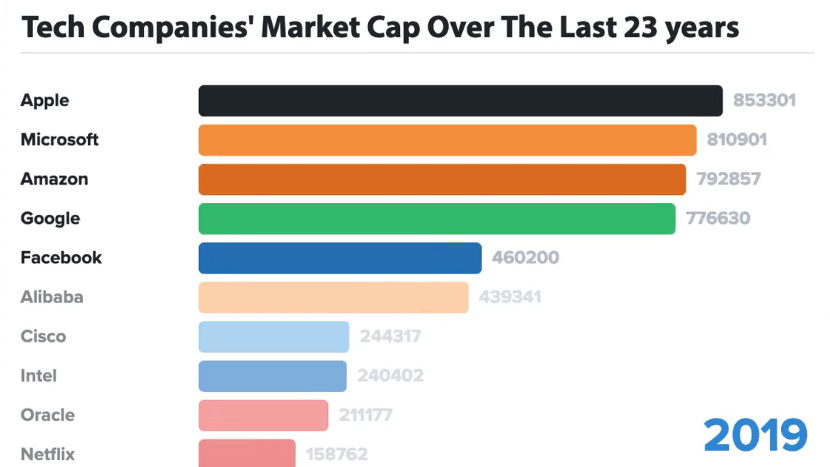
Today’s Market Cap Leaders
As we noted above, company valuations are constantly changing – and back in early September 2018, both Apple and Amazon even topped the $1 trillion milestone for a short period of time.
Using the same criteria as the above animation, which is based on U.S. listed companies, here are the top 10 tech companies based on data at time of publication:
| Rank | Company | Ticker(s) | Market Cap (March 18, 2019) |
|---|---|---|---|
| #1 | Microsoft | MSFT | $902 billion |
| #2 | Apple | AAPL | $887 billion |
| #3 | Amazon | AMZN | $856 billion |
| #4 | Alphabet | GOOG, GOOGL | $824 billion |
| #5 | Alibaba | BABA | $471 billion |
| #6 | FB | $458 billion | |
| #7 | Intel | INTC | $243 billion |
| #8 | Cisco | CSCO | $236 billion |
| #9 | Oracle | ORCL | $192 billion |
| #10 | Netflix | NFLX | $159 billion |
Based on March 18, 2019 data
This is not a comprehensive list globally, as it misses companies like Tencent which are listed on other exchanges such as the Hong Kong Stock Exchange. Based on recent HKD/USD conversion rates, it’s estimated that Tencent would be roughly worth $450 billion today – good enough for 7th on the list.
Regardless, since change is the only constant in the tech world, it’s fair to say that the above list of the biggest tech companies will likely be much different in just a few months time.


Technology
All of the Grants Given by the U.S. CHIPS Act
Intel, TSMC, and more have received billions in subsidies from the U.S. CHIPS Act in 2024.


All of the Grants Given by the U.S. CHIPS Act
This was originally posted on our Voronoi app. Download the app for free on iOS or Android and discover incredible data-driven charts from a variety of trusted sources.
This visualization shows which companies are receiving grants from the U.S. CHIPS Act, as of April 25, 2024. The CHIPS Act is a federal statute signed into law by President Joe Biden that authorizes $280 billion in new funding to boost domestic research and manufacturing of semiconductors.
The grant amounts visualized in this graphic are intended to accelerate the production of semiconductor fabrication plants (fabs) across the United States.
Data and Company Highlights
The figures we used to create this graphic were collected from a variety of public news sources. The Semiconductor Industry Association (SIA) also maintains a tracker for CHIPS Act recipients, though at the time of writing it does not have the latest details for Micron.
| Company | Federal Grant Amount | Anticipated Investment From Company |
|---|---|---|
| 🇺🇸 Intel | $8,500,000,000 | $100,000,000,000 |
| 🇹🇼 TSMC | $6,600,000,000 | $65,000,000,000 |
| 🇰🇷 Samsung | $6,400,000,000 | $45,000,000,000 |
| 🇺🇸 Micron | $6,100,000,000 | $50,000,000,000 |
| 🇺🇸 GlobalFoundries | $1,500,000,000 | $12,000,000,000 |
| 🇺🇸 Microchip | $162,000,000 | N/A |
| 🇬🇧 BAE Systems | $35,000,000 | N/A |
BAE Systems was not included in the graphic due to size limitations
Intel’s Massive Plans
Intel is receiving the largest share of the pie, with $8.5 billion in grants (plus an additional $11 billion in government loans). This grant accounts for 22% of the CHIPS Act’s total subsidies for chip production.
From Intel’s side, the company is expected to invest $100 billion to construct new fabs in Arizona and Ohio, while modernizing and/or expanding existing fabs in Oregon and New Mexico. Intel could also claim another $25 billion in credits through the U.S. Treasury Department’s Investment Tax Credit.
TSMC Expands its U.S. Presence
TSMC, the world’s largest semiconductor foundry company, is receiving a hefty $6.6 billion to construct a new chip plant with three fabs in Arizona. The Taiwanese chipmaker is expected to invest $65 billion into the project.
The plant’s first fab will be up and running in the first half of 2025, leveraging 4 nm (nanometer) technology. According to TrendForce, the other fabs will produce chips on more advanced 3 nm and 2 nm processes.
The Latest Grant Goes to Micron
Micron, the only U.S.-based manufacturer of memory chips, is set to receive $6.1 billion in grants to support its plans of investing $50 billion through 2030. This investment will be used to construct new fabs in Idaho and New York.

-

 Debt1 week ago
How Debt-to-GDP Ratios Have Changed Since 2000
-

 Markets2 weeks ago
Ranked: The World’s Top Flight Routes, by Revenue
-

 Countries2 weeks ago
Population Projections: The World’s 6 Largest Countries in 2075
-

 Markets2 weeks ago
The Top 10 States by Real GDP Growth in 2023
-

 Demographics2 weeks ago
The Smallest Gender Wage Gaps in OECD Countries
-

 United States2 weeks ago
Where U.S. Inflation Hit the Hardest in March 2024
-

 Green2 weeks ago
Top Countries By Forest Growth Since 2001
-

 United States2 weeks ago
Ranked: The Largest U.S. Corporations by Number of Employees