Technology
Visualizing How Big Tech Companies Make Their Billions
Visualizing How Big Tech Companies Make Their Billions
First there was oil, then tobacco, then pharma. The “Big” epithet has always denoted the unique scale and power of certain industries, and today’s Big Tech companies are the perfect example.
These six tech giants—Alphabet, Amazon, Apple, Microsoft, Meta (formerly Facebook), and Nvidia—are each one of the eight most valuable companies in the world by market capitalization.
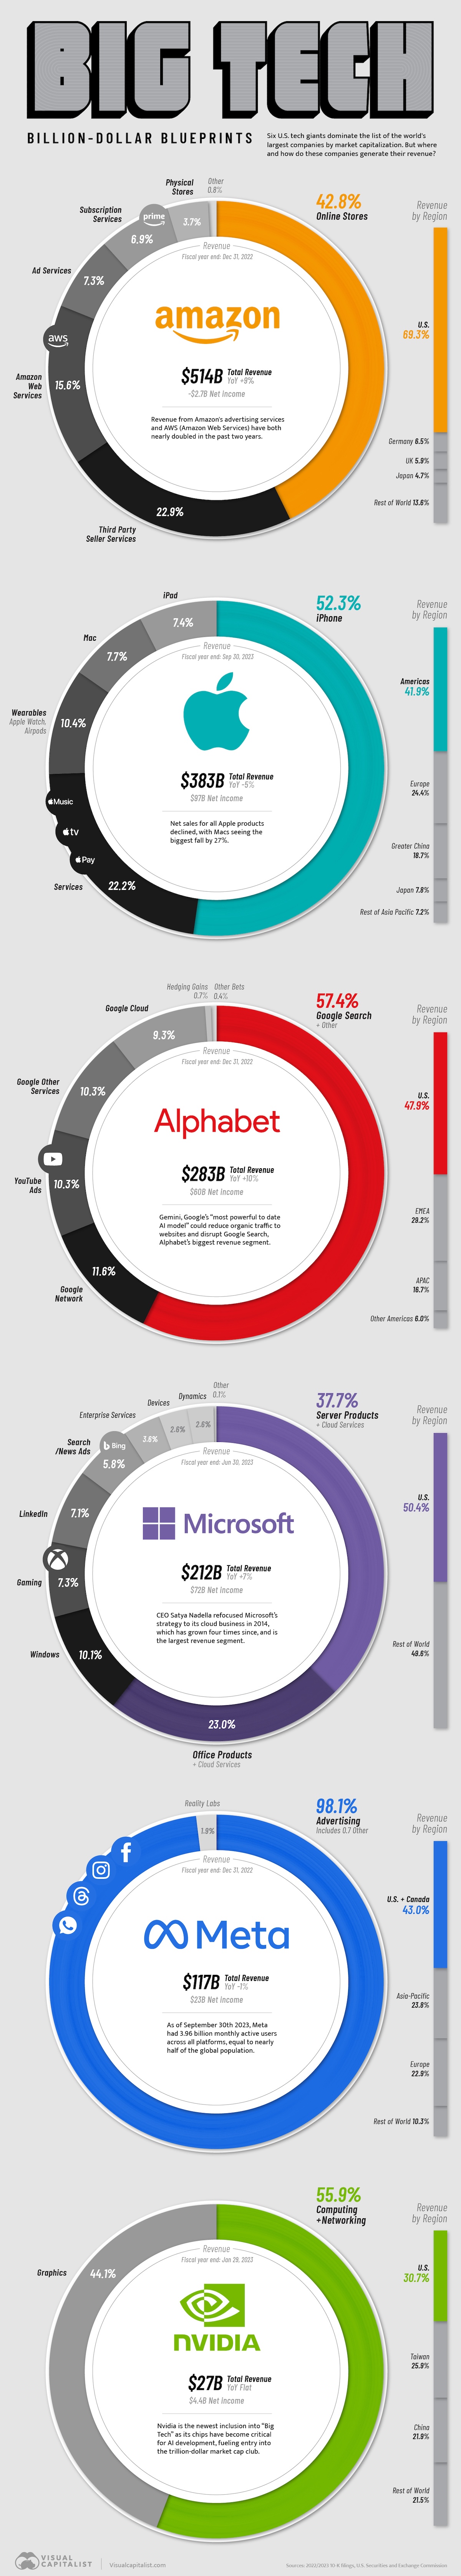
Thanks to the ubiquity of their business, they routinely pull in an annual revenue that exceeds many national GDPs. We visualize how and where Big Tech’s revenues came from, per their latest full-year SEC filings.
Big Tech Spotlight: Alphabet, Amazon, and Meta
First we look at Alphabet, Amazon, and Meta, whose financial years ended in December 2022.
Alphabet made slightly north of $280 billion in 2022, nearly 60% of that coming from monetizing Google Search and other related activities.
Their $60 billion profit is the third-highest amongst its Big Tech peers. Their net profit margin (net income divided by total revenue) stood at 21.2% for the year, or 21 cents in profit for every dollar of revenue earned.
Here’s a quick look at the numbers.
| Company | Revenue | Profit | Net Profit Margin | Revenue Change (YoY) |
|---|---|---|---|---|
| Alphabet | $282.8B | $60.0B | 21.2% | 10% |
| Amazon | $514.0B | $-2.7B | -0.5% | 9% |
| Meta | $116.6B | $23.2B | 19.9% | -1% |
At $514 billion, e-commerce giant Amazon logged its highest revenue ever, beating its Big Tech peers by landslide.
However, severance payouts and a $720 million impairment charge (due to shutting some of their physical grocery stores), hurt the company’s bottom-line. Amazon posed a nearly $3 billion net loss for the year, and, consequently, a negative net profit margin (-0.53%).
Meta pulled in close to $117 billion in 2022 and turned a $23 billion profit, for a nearly 20% net margin. Meta’s slight year-on-year revenue decline (-1%) was attributed to foreign exchange movement.
Big Tech Spotlight: Apple, Microsoft, and Nvidia
Apple is an investor darling for a reason. Consider: $383 billion revenue (for financial year ending Sep. 2023) and $97 billion in profit—second-most in the world after oil giant Saudi Aramco.
Finally, Apple’s 25% net profit margin is the second-highest amongst the Big Tech companies.
Nevertheless, even Apple has less-than-stellar years on occasion. Sales for all Apple products declined year-on year, pulling revenue down 5%. The iPhone continues to be the company’s chief moneymaker, contributing 52% of total revenue.
| Company | Revenue | Profit | Net Profit Margin | Revenue Change (YoY) |
|---|---|---|---|---|
| Apple | $383.3B | $97.0B | 25.3% | -5% |
| Microsoft | $211.9B | $72.4B | 34.1% | 7% |
| Nvidia | $27.0B | $4.37B | 15.9% | Flat |
Meanwhile, Microsoft earned nearly $212 billion for its financial year ending July 2023, led by gains in their cloud and server segment, which CEO Satya Nadella prioritized back in 2014.
The company’s $72 billion net income meant the company raked in 34 cents for every dollar it made, the highest profit margin in Big Tech.
Finally, chip-designer Nvidia—the newest entrant into the trillion dollar club—made about $27 billion for the financial year ending January 2023, with a $4 billion profit. Net profit margin stood at 15.9%.
However, the company’s profile amongst investors is rising rapidly, due to its critical position in the growing AI chip business. The company has already registered a more-than-four-fold profit increase in 2023 so far—even without accounting for the last four months of the year.


Technology
Countries With the Highest Rates of Crypto Ownership
While the U.S. is a major market for cryptocurrencies, two countries surpass it in terms of their rates of crypto ownership.


Countries With the Highest Rates of Crypto Ownership
This was originally posted on our Voronoi app. Download the app for free on iOS or Android and discover incredible data-driven charts from a variety of trusted sources.
This graphic ranks the top 10 countries by their rate of cryptocurrency ownership, which is the percentage of the population that owns crypto. These figures come from crypto payment gateway, Triple-A, and are as of 2023.
Data and Highlights
The table below lists the rates of crypto ownership in the top 10 countries, as well as the number of people this amounts to.
| Country | % of Population Who Own Crypto | # of Crypto Owners |
|---|---|---|
| 🇦🇪 United Arab Emirates | 30.4 | 3M |
| 🇻🇳 Vietnam | 21.2 | 21M |
| 🇺🇸 U.S. | 15.6 | 53M |
| 🇮🇷 Iran | 13.5 | 12M |
| 🇵🇭 Philippines | 13.4 | 16M |
| 🇧🇷 Brazil | 12 | 26M |
| 🇸🇦 Saudi Arabia | 11.4 | 4M |
| 🇸🇬 Singapore | 11.1 | 665K |
| 🇺🇦 Ukraine | 10.6 | 4M |
| 🇻🇪 Venezuela | 10.3 | 3M |
Note that if we were to rank countries based on their actual number of crypto owners, India would rank first at 93 million people, China would rank second at 59 million people, and the U.S. would rank third at 52 million people.
The UAE Takes the Top Spot
The United Arab Emirates (UAE) boasts the highest rates of crypto ownership globally. The country’s government is considered to be very crypto friendly, as described in Henley & Partners’ Crypto Wealth Report 2023:
In the UAE, the Financial Services Regulatory Authority (FSRA-ADGM) was the first to provide rules and regulations regarding cryptocurrency purchasing and selling. The Emirates are generally very open to new technologies and have proposed zero taxes for crypto owners and businesses.
Vietnam leads Southeast Asia
According to the Crypto Council for Innovation, cryptocurrency holdings in Vietnam are also untaxed, making them an attractive asset.
Another reason for Vietnam’s high rates of ownership could be its large unbanked population (people without access to financial services). Cryptocurrencies may provide an alternative means of accessing these services without relying on traditional banks.
Learn More About Crypto From Visual Capitalist
If you enjoyed this post, be sure to check out The World’s Largest Corporate Holders of Bitcoin, which ranks the top 12 publicly traded companies by their Bitcoin holdings.

-

 Politics5 days ago
Charted: What Southeast Asia Thinks About China & the U.S.
-

 United States2 weeks ago
Visualizing the Most Common Pets in the U.S.
-

 Culture2 weeks ago
The World’s Top Media Franchises by All-Time Revenue
-

 Best of2 weeks ago
Best Visualizations of April on the Voronoi App
-

 Wealth1 week ago
Charted: Which Country Has the Most Billionaires in 2024?
-

 Markets1 week ago
The Top Private Equity Firms by Country
-

 Jobs1 week ago
The Best U.S. Companies to Work for According to LinkedIn
-

 Economy1 week ago
Ranked: The Top 20 Countries in Debt to China