Markets
Animation: The 20 Largest State Economies by GDP in the Last 50 Years
Animation: The 20 Largest State Economies by GDP
When it comes to understanding the size and scope of the $18 trillion U.S. economy, it’s sometimes easier to consider that it’s the sum of many parts.
Many states already have economies that are comparable to some of the world’s largest countries, giving you a sense of what they might be combined.
And while every state plays a role in the bigger picture, some states such as New York and California have an outsized impact on fueling the country’s overall economic engine.
The State of State Economies
Today’s animation comes to us from SavingSpot, and it covers the size of state economies by GDP going back all the way to 1963.
The video uses inflation-adjusted data from the U.S. Bureau of Economic Analysis, showing how the ranking of top state economies has changed over time as different states have taken advantage of economic booms.
Let’s dive into the data to see how things have changed.
Going Back in Time
The earliest data in the animation comes from 1963, when New York led the pack with a $70.6 billion economy in inflation-adjusted terms.
State Economies by GDP, Inflation-Adjusted Chained $USD (1963)
| Rank | State Economy | GDP, Billions of USD (1963) | Share of U.S. Economy |
|---|---|---|---|
| #1 | New York | $70.6 | 11.6% |
| #2 | California | $67.8 | 11.2% |
| #3 | Illinois | $39.5 | 6.5% |
| #4 | Pennsylvania | $34.5 | 5.7% |
| #5 | Ohio | $33.3 | 5.5% |
| #6 | Michigan | $30.5 | 5.0% |
| #7 | Texas | $29.3 | 4.8% |
| #8 | New Jersey | $23.4 | 3.9% |
| #9 | Massachusetts | $17.4 | 2.9% |
| #10 | Indiana | $15.6 | 2.6% |
| #11 | Florida | $14.7 | 2.4% |
| #12 | Missouri | $13.6 | 2.2% |
| #13 | Wisconsin | $12.7 | 2.1% |
| #14 | North Carolina | $12.6 | 2.1% |
| #15 | Virginia | $11.7 | 1.9% |
| #16 | Washington | $11.2 | 1.8% |
| #17 | Minnesota | $10.7 | 1.8% |
| #18 | Georgia | $10.3 | 1.7% |
| #19 | Maryland | $10.3 | 1.7% |
| #20 | Connecticut | $9.9 | 1.6% |
| #21 | Louisiana | $9.7 | 1.6% |
| #22 | Tennessee | $9.1 | 1.5% |
| #23 | Kentucky | $8.4 | 1.4% |
| #24 | Iowa | $7.9 | 1.3% |
| #25 | Alabama | $7.3 | 1.2% |
| #26 | Oklahoma | $6.2 | 1.0% |
| #27 | Kansas | $6.1 | 1.0% |
| #28 | Colorado | $5.9 | 1.0% |
| #29 | Oregon | $5.7 | 0.9% |
| #30 | District of Columbia | $5.1 | 0.8% |
| #31 | South Carolina | $5.1 | 0.8% |
| #32 | West Virginia | $4.6 | 0.8% |
| #33 | Arizona | $4.5 | 0.7% |
| #34 | Mississippi | $4.4 | 0.7% |
| #35 | Nebraska | $4.3 | 0.7% |
| #36 | Arkansas | $3.8 | 0.6% |
| #37 | New Mexico | $3.0 | 0.5% |
| #38 | Utah | $3.0 | 0.5% |
| #39 | Rhode Island | $2.7 | 0.4% |
| #40 | Maine | $2.4 | 0.4% |
| #41 | Hawaii | $2.4 | 0.4% |
| #42 | Montana | $2.0 | 0.3% |
| #43 | Delaware | $1.9 | 0.3% |
| #44 | Idaho | $1.8 | 0.3% |
| #45 | Nevada | $1.8 | 0.3% |
| #46 | New Hampshire | $1.7 | 0.3% |
| #47 | North Dakota | $1.6 | 0.3% |
| #48 | South Dakota | $1.6 | 0.3% |
| #49 | Wyoming | $1.4 | 0.2% |
| #50 | Alaska | $1.1 | 0.2% |
| #51 | Vermont | $1.0 | 0.2% |
| 🇺🇸 United States (Total) | $607.0 | 100.0% |
California ($67.8 billion), Illinois ($39.5 billion), Pennsylvania ($34.5 billion) and Ohio ($33.3 billion) round out the top five, and together they added up to 40.5% of the national GDP.
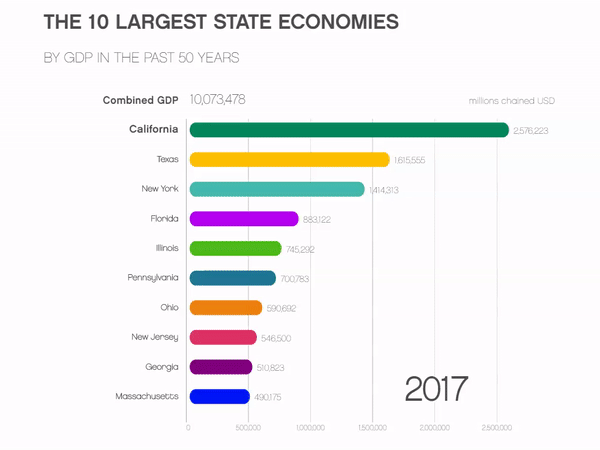
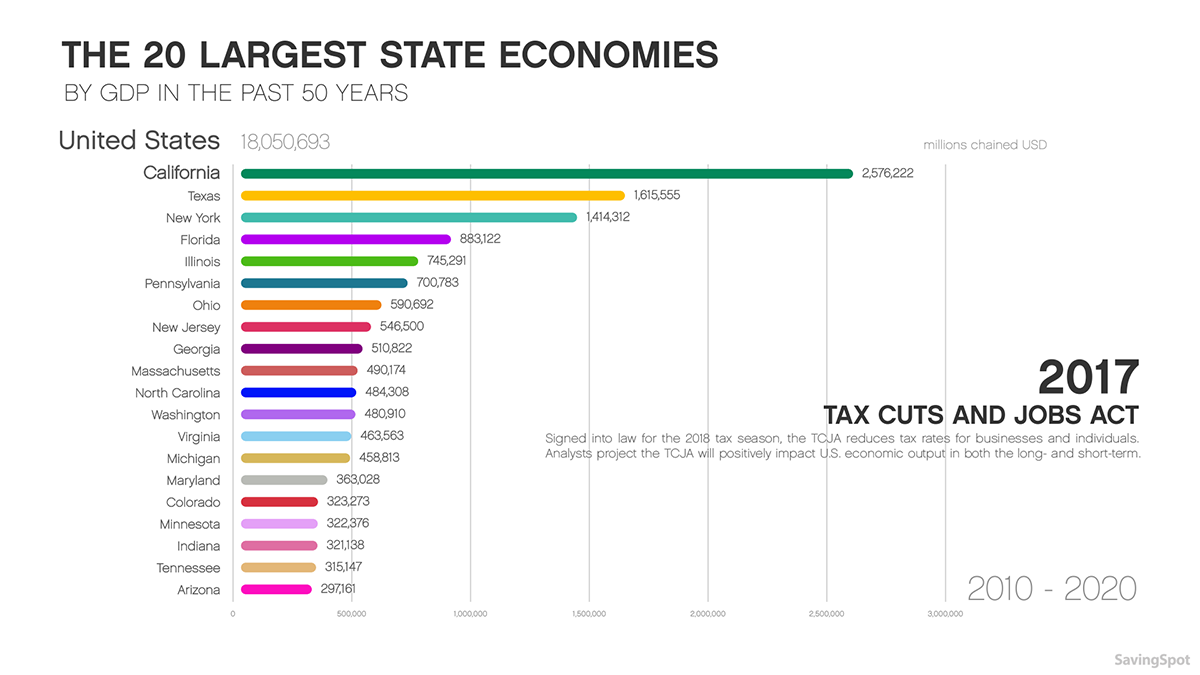
The Largest State Economies by GDP Today
Looking at the most recent data from 2017, you can see the ranking changes significantly:
State Economies by GDP, Inflation-Adjusted Chained $USD (2017)
| Rank | State Economy | GDP, Billions of USD (2017) | Share of U.S. Economy |
|---|---|---|---|
| #1 | California | $2,576 | 14.3% |
| #2 | Texas | $1,616 | 9.0% |
| #3 | New York | $1,414 | 7.8% |
| #4 | Florida | $883 | 4.9% |
| #5 | Illinois | $745 | 4.1% |
| #6 | Pennsylvania | $701 | 3.9% |
| #7 | Ohio | $591 | 3.3% |
| #8 | New Jersey | $547 | 3.0% |
| #9 | Georgia | $511 | 2.8% |
| #10 | Michigan | $459 | 2.5% |
| #11 | North Carolina | $484 | 2.7% |
| #12 | Virginia | $464 | 2.6% |
| #13 | Massachusetts | $490 | 2.7% |
| #14 | Washington | $481 | 2.7% |
| #15 | Maryland | $363 | 2.0% |
| #16 | Indiana | $321 | 1.8% |
| #17 | Arizona | $297 | 1.6% |
| #18 | Minnesota | $322 | 1.8% |
| #19 | Tennessee | $315 | 1.7% |
| #20 | Wisconsin | $292 | 1.6% |
| #21 | Colorado | $323 | 1.8% |
| #22 | Missouri | $276 | 1.5% |
| #23 | Connecticut | $239 | 1.3% |
| #24 | Louisiana | $227 | 1.3% |
| #25 | Alabama | $193 | 1.1% |
| #26 | South Carolina | $199 | 1.1% |
| #27 | Kentucky | $185 | 1.0% |
| #28 | Oregon | $208 | 1.2% |
| #29 | Oklahoma | $191 | 1.1% |
| #30 | Iowa | $169 | 0.9% |
| #31 | Nevada | $143 | 0.8% |
| #32 | Kansas | $148 | 0.8% |
| #33 | Utah | $150 | 0.8% |
| #34 | Arkansas | $114 | 0.6% |
| #35 | District of Columbia | $122 | 0.7% |
| #36 | Mississippi | $100 | 0.6% |
| #37 | Nebraska | $111 | 0.6% |
| #38 | New Mexico | $91 | 0.5% |
| #39 | Hawaii | $79 | 0.4% |
| #40 | West Virginia | $71 | 0.4% |
| #41 | New Hampshire | $74 | 0.4% |
| #42 | Delaware | $64 | 0.4% |
| #43 | Idaho | $67 | 0.4% |
| #44 | Maine | $56 | 0.3% |
| #45 | Rhode Island | $53 | 0.3% |
| #46 | Alaska | $52 | 0.3% |
| #47 | Montana | $44 | 0.2% |
| #48 | Wyoming | $39 | 0.2% |
| #49 | South Dakota | $45 | 0.3% |
| #50 | North Dakota | $51 | 0.3% |
| #51 | Vermont | $30 | 0.2% |
| 🇺🇸 United States (Total) | $18,051 | 100% |
California is the largest economy today – it has a state GDP of $2.6 trillion, which is comparable to the United Kingdom.
Meanwhile, Florida and Georgia are two states that did not crack the top 10 back in the 1960s, while Texas jumped up to become the second largest state economy. It’s actually not a coincidence that all of these states are in the southern half of the country, as air conditioning has played a surprisingly pivotal role in shaping modern America.
In fact, the share of the nation’s population living in the Sunbelt rose from 28% in 1950 to 40% in 2000, and this increase in population has coincided with economic growth in many of the states that used to be a sweaty mess.
A Final Look
Here is a final animated version of the top 10 largest states by GDP, also provided by SavingSpot:


Markets
The European Stock Market: Attractive Valuations Offer Opportunities
On average, the European stock market has valuations that are nearly 50% lower than U.S. valuations. But how can you access the market?


European Stock Market: Attractive Valuations Offer Opportunities
Europe is known for some established brands, from L’Oréal to Louis Vuitton. However, the European stock market offers additional opportunities that may be lesser known.
The above infographic, sponsored by STOXX, outlines why investors may want to consider European stocks.
Attractive Valuations
Compared to most North American and Asian markets, European stocks offer lower or comparable valuations.
| Index | Price-to-Earnings Ratio | Price-to-Book Ratio |
|---|---|---|
| EURO STOXX 50 | 14.9 | 2.2 |
| STOXX Europe 600 | 14.4 | 2 |
| U.S. | 25.9 | 4.7 |
| Canada | 16.1 | 1.8 |
| Japan | 15.4 | 1.6 |
| Asia Pacific ex. China | 17.1 | 1.8 |
Data as of February 29, 2024. See graphic for full index names. Ratios based on trailing 12 month financials. The price to earnings ratio excludes companies with negative earnings.
On average, European valuations are nearly 50% lower than U.S. valuations, potentially offering an affordable entry point for investors.
Research also shows that lower price ratios have historically led to higher long-term returns.
Market Movements Not Closely Connected
Over the last decade, the European stock market had low-to-moderate correlation with North American and Asian equities.
The below chart shows correlations from February 2014 to February 2024. A value closer to zero indicates low correlation, while a value of one would indicate that two regions are moving in perfect unison.
| EURO STOXX 50 | STOXX EUROPE 600 | U.S. | Canada | Japan | Asia Pacific ex. China |
|
|---|---|---|---|---|---|---|
| EURO STOXX 50 | 1.00 | 0.97 | 0.55 | 0.67 | 0.24 | 0.43 |
| STOXX EUROPE 600 | 1.00 | 0.56 | 0.71 | 0.28 | 0.48 | |
| U.S. | 1.00 | 0.73 | 0.12 | 0.25 | ||
| Canada | 1.00 | 0.22 | 0.40 | |||
| Japan | 1.00 | 0.88 | ||||
| Asia Pacific ex. China | 1.00 |
Data is based on daily USD returns.
European equities had relatively independent market movements from North American and Asian markets. One contributing factor could be the differing sector weights in each market. For instance, technology makes up a quarter of the U.S. market, but health care and industrials dominate the broader European market.
Ultimately, European equities can enhance portfolio diversification and have the potential to mitigate risk for investors.
Tracking the Market
For investors interested in European equities, STOXX offers a variety of flagship indices:
| Index | Description | Market Cap |
|---|---|---|
| STOXX Europe 600 | Pan-regional, broad market | €10.5T |
| STOXX Developed Europe | Pan-regional, broad-market | €9.9T |
| STOXX Europe 600 ESG-X | Pan-regional, broad market, sustainability focus | €9.7T |
| STOXX Europe 50 | Pan-regional, blue-chip | €5.1T |
| EURO STOXX 50 | Eurozone, blue-chip | €3.5T |
Data is as of February 29, 2024. Market cap is free float, which represents the shares that are readily available for public trading on stock exchanges.
The EURO STOXX 50 tracks the Eurozone’s biggest and most traded companies. It also underlies one of the world’s largest ranges of ETFs and mutual funds. As of November 2023, there were €27.3 billion in ETFs and €23.5B in mutual fund assets under management tracking the index.
“For the past 25 years, the EURO STOXX 50 has served as an accurate, reliable and tradable representation of the Eurozone equity market.”
— Axel Lomholt, General Manager at STOXX
Partnering with STOXX to Track the European Stock Market
Are you interested in European equities? STOXX can be a valuable partner:
- Comprehensive, liquid and investable ecosystem
- European heritage, global reach
- Highly sophisticated customization capabilities
- Open architecture approach to using data
- Close partnerships with clients
- Part of ISS STOXX and Deutsche Börse Group
With a full suite of indices, STOXX can help you benchmark against the European stock market.
Learn how STOXX’s European indices offer liquid and effective market access.

-

 Economy2 days ago
Economic Growth Forecasts for G7 and BRICS Countries in 2024
The IMF has released its economic growth forecasts for 2024. How do the G7 and BRICS countries compare?
-

 Markets1 week ago
U.S. Debt Interest Payments Reach $1 Trillion
U.S. debt interest payments have surged past the $1 trillion dollar mark, amid high interest rates and an ever-expanding debt burden.
-

 United States2 weeks ago
Ranked: The Largest U.S. Corporations by Number of Employees
We visualized the top U.S. companies by employees, revealing the massive scale of retailers like Walmart, Target, and Home Depot.
-

 Markets2 weeks ago
The Top 10 States by Real GDP Growth in 2023
This graphic shows the states with the highest real GDP growth rate in 2023, largely propelled by the oil and gas boom.
-

 Markets2 weeks ago
Ranked: The World’s Top Flight Routes, by Revenue
In this graphic, we show the highest earning flight routes globally as air travel continued to rebound in 2023.
-

 Markets2 weeks ago
Ranked: The Most Valuable Housing Markets in America
The U.S. residential real estate market is worth a staggering $47.5 trillion. Here are the most valuable housing markets in the country.

-

 Misc1 week ago
How Hard Is It to Get Into an Ivy League School?
-

 Technology2 weeks ago
Ranked: Semiconductor Companies by Industry Revenue Share
-
Markets2 weeks ago
Ranked: The World’s Top Flight Routes, by Revenue
-

 Countries2 weeks ago
Population Projections: The World’s 6 Largest Countries in 2075
-
Markets2 weeks ago
The Top 10 States by Real GDP Growth in 2023
-

 Demographics2 weeks ago
The Smallest Gender Wage Gaps in OECD Countries
-

 United States2 weeks ago
Where U.S. Inflation Hit the Hardest in March 2024
-

 Green2 weeks ago
Top Countries By Forest Growth Since 2001