Misc
All World Languages in One Visualization
This infographic was originally published in scmp.com
All World Languages, By Native Speakers
View a high resolution version of today’s graphic by clicking here.
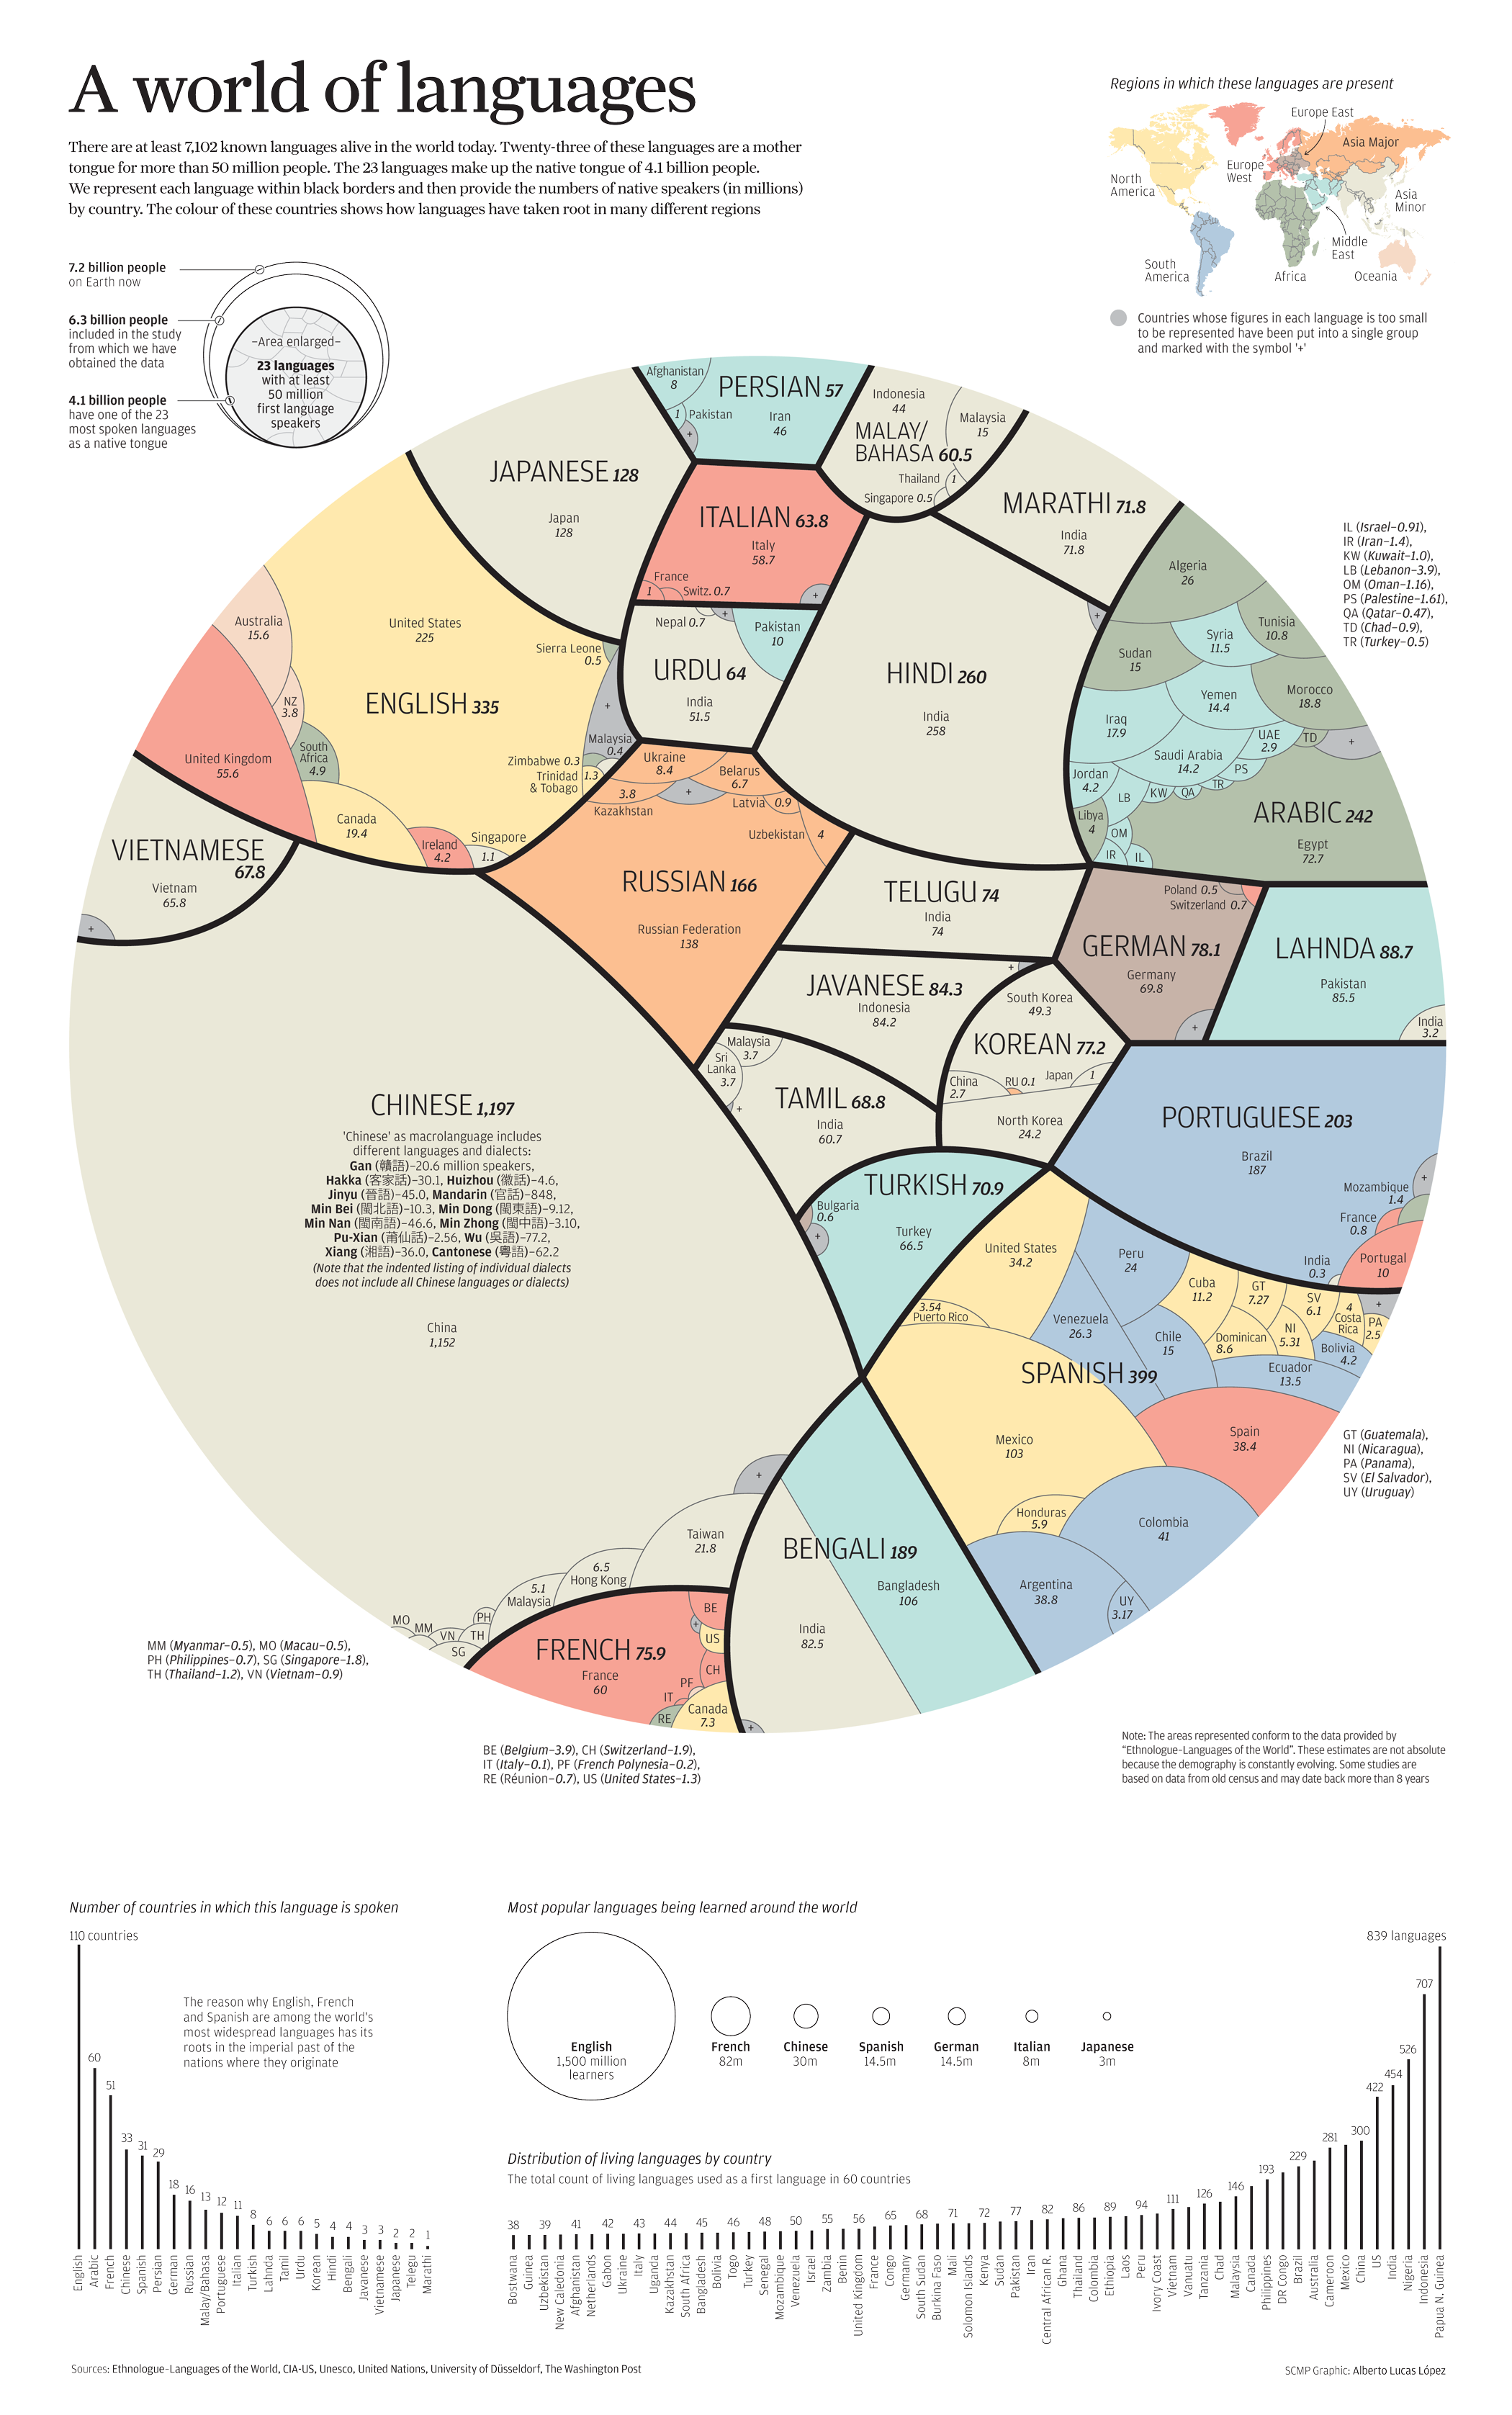
Languages provide a window into culture and history. They’re also a unique way to map the world – not through landmasses or geopolitical borders, but through mother tongues.
The Tower of Babel
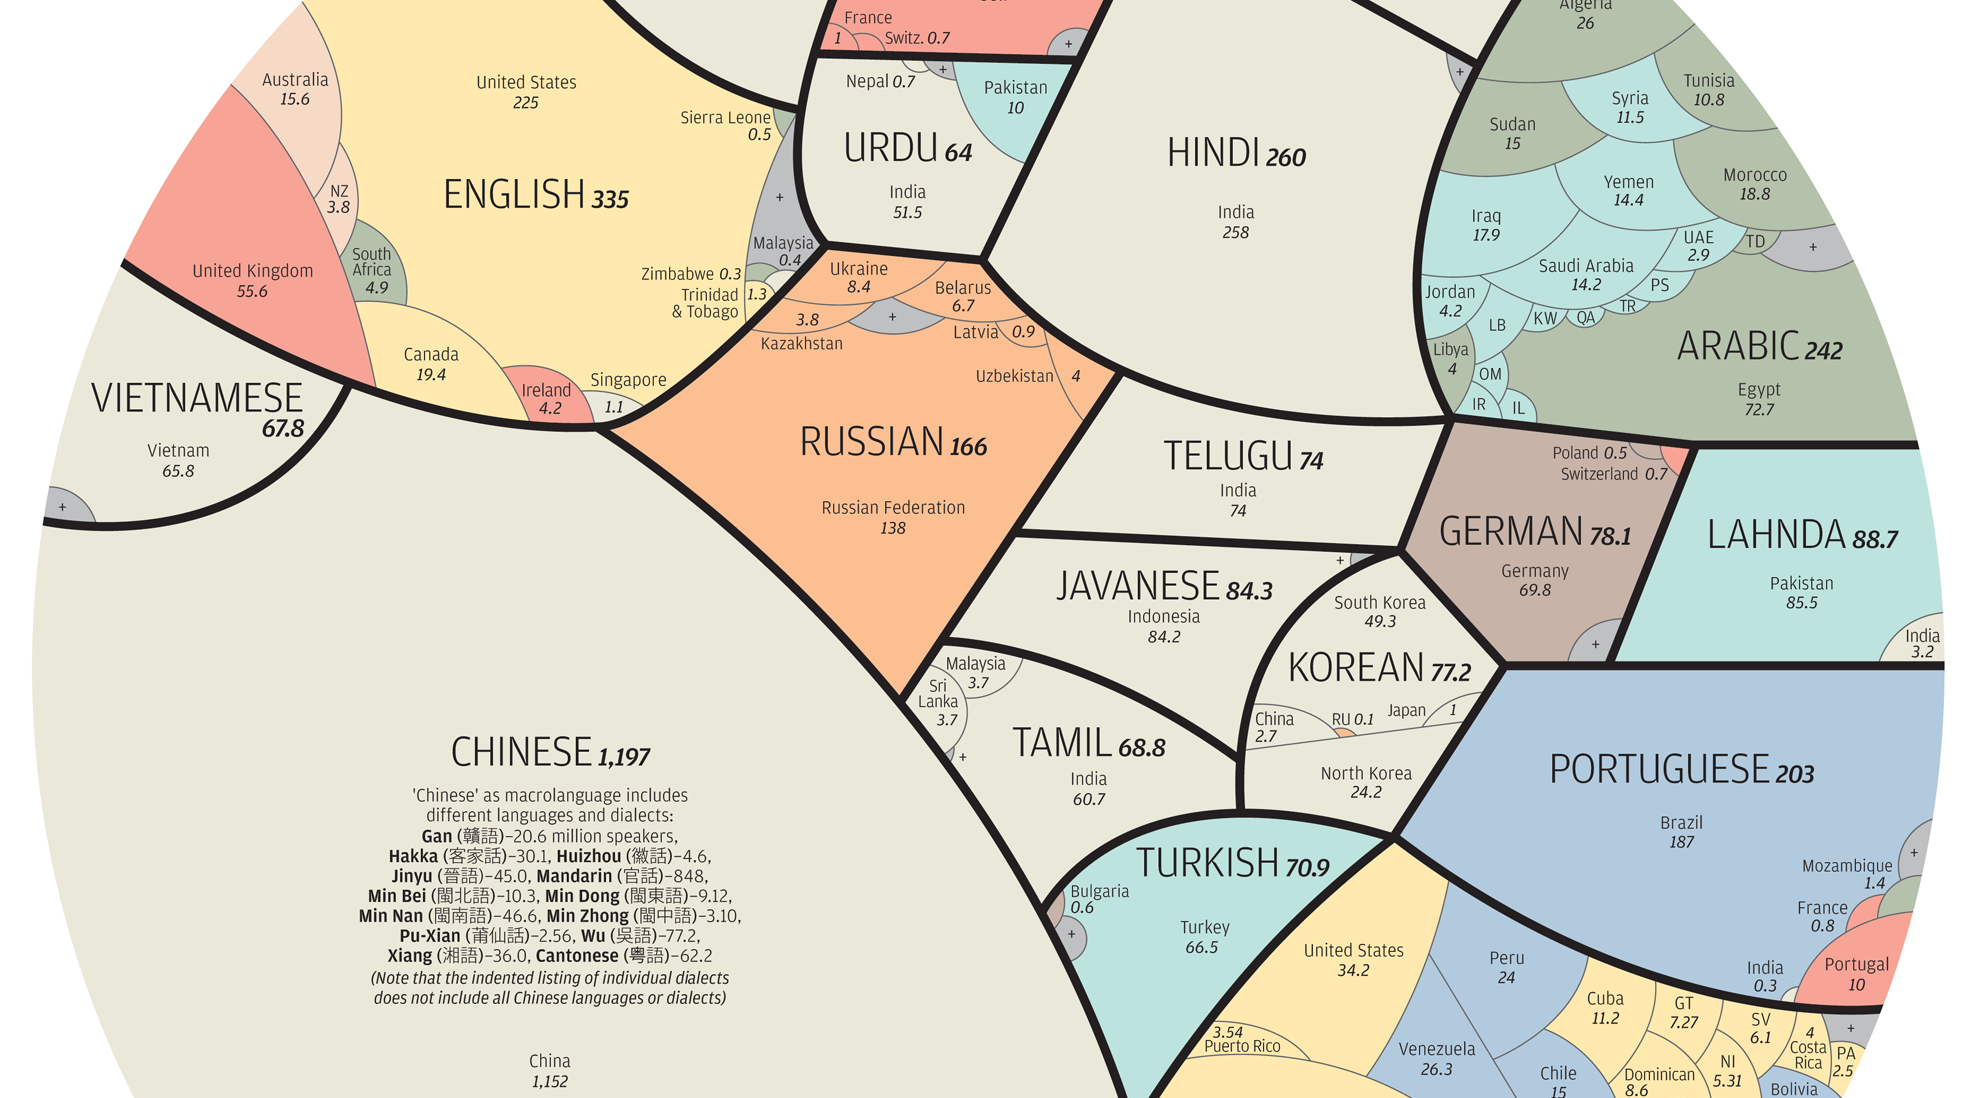
Today’s infographic from Alberto Lucas Lopez condenses the 7,102 known living languages today into a stunning visualization, with individual colors representing each world region.
Only 23 languages are spoken by at least 50 million native speakers. What’s more, over half the planet speaks at least one of these 23 languages.
Chinese dominates as a macrolanguage, but it’s important to note that it consists of numerous languages. Mandarin, Yue (including Cantonese), Min, Wu, and Hakka cover over 200 individual dialects, which vary further by geographic location.
| Country | Native Chinese speakers (millions) |
|---|---|
| 🇨🇳 China | 1,152.0 |
| 🇹🇼 Taiwan | 21.8 |
| 🇭🇰 Hong Kong SAR | 6.5 |
| 🇲🇾 Malaysia | 5.1 |
| 🇸🇬 Singapore | 1.8 |
| 🇹🇭 Thailand | 1.2 |
| 🇻🇳 Vietnam | 0.9 |
| 🇵🇭 Philippines | 0.7 |
| 🇲🇲 Myanmar | 0.5 |
| 🇲🇴 Macau SAR | 0.5 |
| Other | 6.0 |
| Total | 1,197 million |
Chinese is one of the most challenging languages for English speakers to pick up, in part due its completely unfamiliar scripts. You’d have to know at least 3,000 characters to be able to read a newspaper, a far cry from memorizing the A-Z alphabet.
Spanglish Takes Over
After Chinese, the languages of Spanish and English sit in second and third place in terms of global popularity. The rapid proliferation of these languages can be traced back to the history of Spanish conquistadors in the Americas, and British colonies around the world.
Animation: Map of Colonization (1492 – 2008):
Today, Spanish has 399 million native speakers, but these are mostly concentrated in Latin America. English has 335 million native speakers under its belt, with a widespread reach all over the globe.
Two Worlds, One Family
While the visualization makes all the world languages seem disparate, this linguistic family tree shows how they grew from a common root. It also explains how languages can evolve and branch out over time.
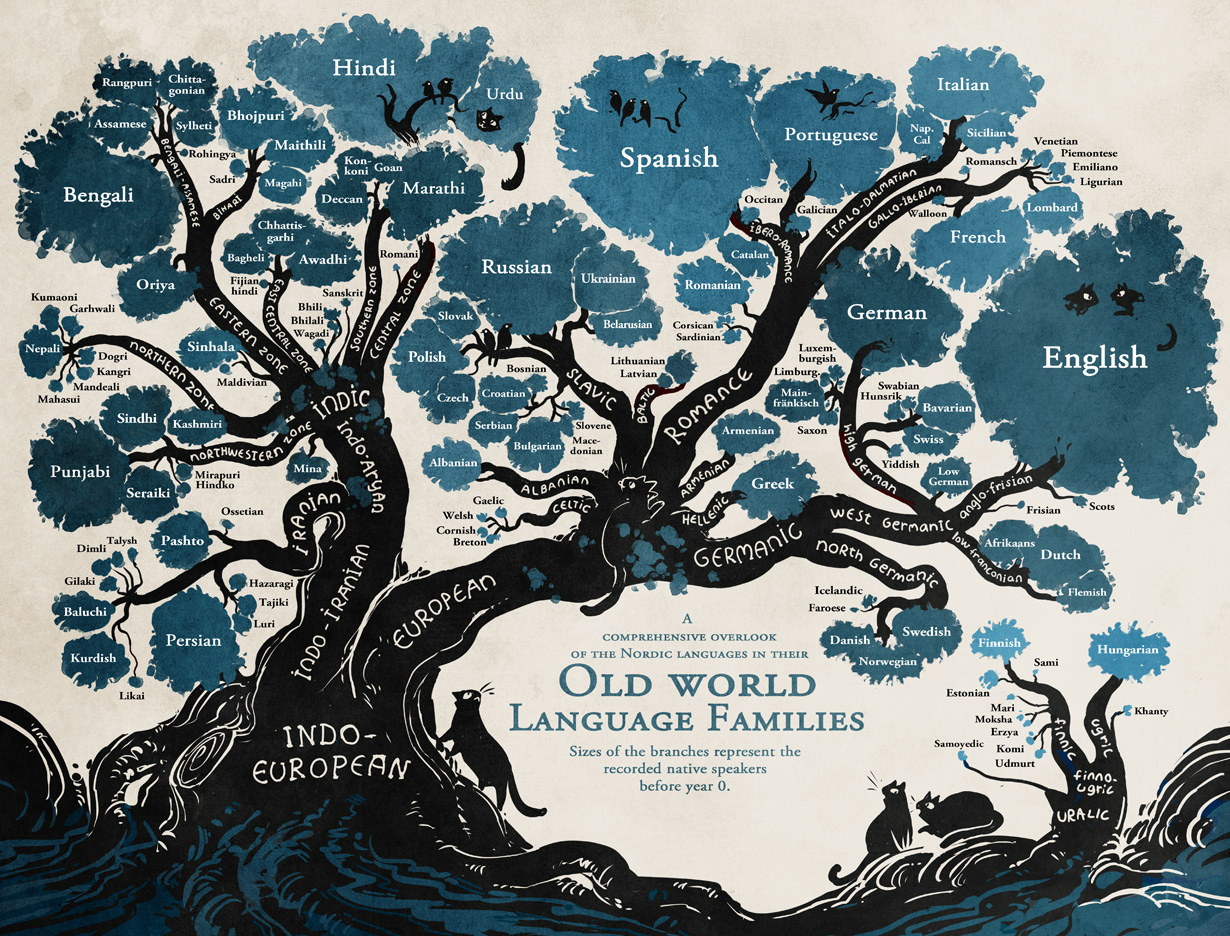
Created by Minna Sundberg. Full version.
This linguistic tree also includes many languages that are not on the large visualization of 23 mother tongues. Some of them might be considered endangered or at risk today, such as Catalan or Welsh. However, with globalization, a few interesting linguistic trends are arising.
1. Language revival
Certain enclaves of marginalized languages are being preserved out of pride for the traditional and cultural histories attached.
While Catalan was once banned, its rebirth is a key marker of identity in Barcelona. More than 150 universities teach Catalan worldwide. In the case of Welsh, a mammoth university project plans to make sure it does not die out. Researchers are compiling ten million Welsh words to preserve the past, present, and future of the language.
2. Language forecast
At this point in time, English is the lingua franca – adopted as a common language among speakers with different mother tongues. However, this status might soon be fuzzier as demographic trends continue.
The rise of China is an obvious one to consider. As China continues to increase its economic might and influence, its languages will proliferate as well.
At the same time, 26 African countries are projected to double their current size, many of which speak French as a first language. One study by investment bank Natixis suggests that Africa’s growth may well bring French to the forefront – making it the most-spoken language by 2050.
Could French provide a certain je ne sais quoi that no other world language can quite replace?
This post was first published in 2018. We have since updated it, adding in new content for 2021.


VC+
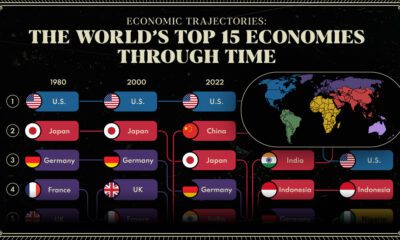
VC+: Get Our Key Takeaways From the IMF’s World Economic Outlook
A sneak preview of the exclusive VC+ Special Dispatch—your shortcut to understanding IMF’s World Economic Outlook report.

Have you read IMF’s latest World Economic Outlook yet? At a daunting 202 pages, we don’t blame you if it’s still on your to-do list.
But don’t worry, you don’t need to read the whole April release, because we’ve already done the hard work for you.
To save you time and effort, the Visual Capitalist team has compiled a visual analysis of everything you need to know from the report—and our VC+ Special Dispatch is available exclusively to VC+ members. All you need to do is log into the VC+ Archive.
If you’re not already subscribed to VC+, make sure you sign up now to access the full analysis of the IMF report, and more (we release similar deep dives every week).
For now, here’s what VC+ members get to see.
Your Shortcut to Understanding IMF’s World Economic Outlook
With long and short-term growth prospects declining for many countries around the world, this Special Dispatch offers a visual analysis of the key figures and takeaways from the IMF’s report including:
- The global decline in economic growth forecasts
- Real GDP growth and inflation forecasts for major nations in 2024
- When interest rate cuts will happen and interest rate forecasts
- How debt-to-GDP ratios have changed since 2000
- And much more!

Get the Full Breakdown in the Next VC+ Special Dispatch
VC+ members can access the full Special Dispatch by logging into the VC+ Archive, where you can also check out previous releases.
Make sure you join VC+ now to see exclusive charts and the full analysis of key takeaways from IMF’s World Economic Outlook.
Don’t miss out. Become a VC+ member today.
What You Get When You Become a VC+ Member
VC+ is Visual Capitalist’s premium subscription. As a member, you’ll get the following:
- Special Dispatches: Deep dive visual briefings on crucial reports and global trends
- Markets This Month: A snappy summary of the state of the markets and what to look out for
- The Trendline: Weekly curation of the best visualizations from across the globe
- Global Forecast Series: Our flagship annual report that covers everything you need to know related to the economy, markets, geopolitics, and the latest tech trends
- VC+ Archive: Hundreds of previously released VC+ briefings and reports that you’ve been missing out on, all in one dedicated hub
You can get all of the above, and more, by joining VC+ today.

-

 Education1 week ago
How Hard Is It to Get Into an Ivy League School?
-

 Technology2 weeks ago
Ranked: Semiconductor Companies by Industry Revenue Share
-

 Markets2 weeks ago
Ranked: The World’s Top Flight Routes, by Revenue
-

 Demographics2 weeks ago
Population Projections: The World’s 6 Largest Countries in 2075
-

 Markets2 weeks ago
The Top 10 States by Real GDP Growth in 2023
-

 Demographics2 weeks ago
The Smallest Gender Wage Gaps in OECD Countries
-

 Economy2 weeks ago
Where U.S. Inflation Hit the Hardest in March 2024
-

 Green2 weeks ago
Top Countries By Forest Growth Since 2001