Markets
$63 Trillion of World Debt in One Visualization
Enjoy this graphic? You can also find it in our new infographic book – now available on Amazon!
$63 Trillion of World Debt in One Visualization
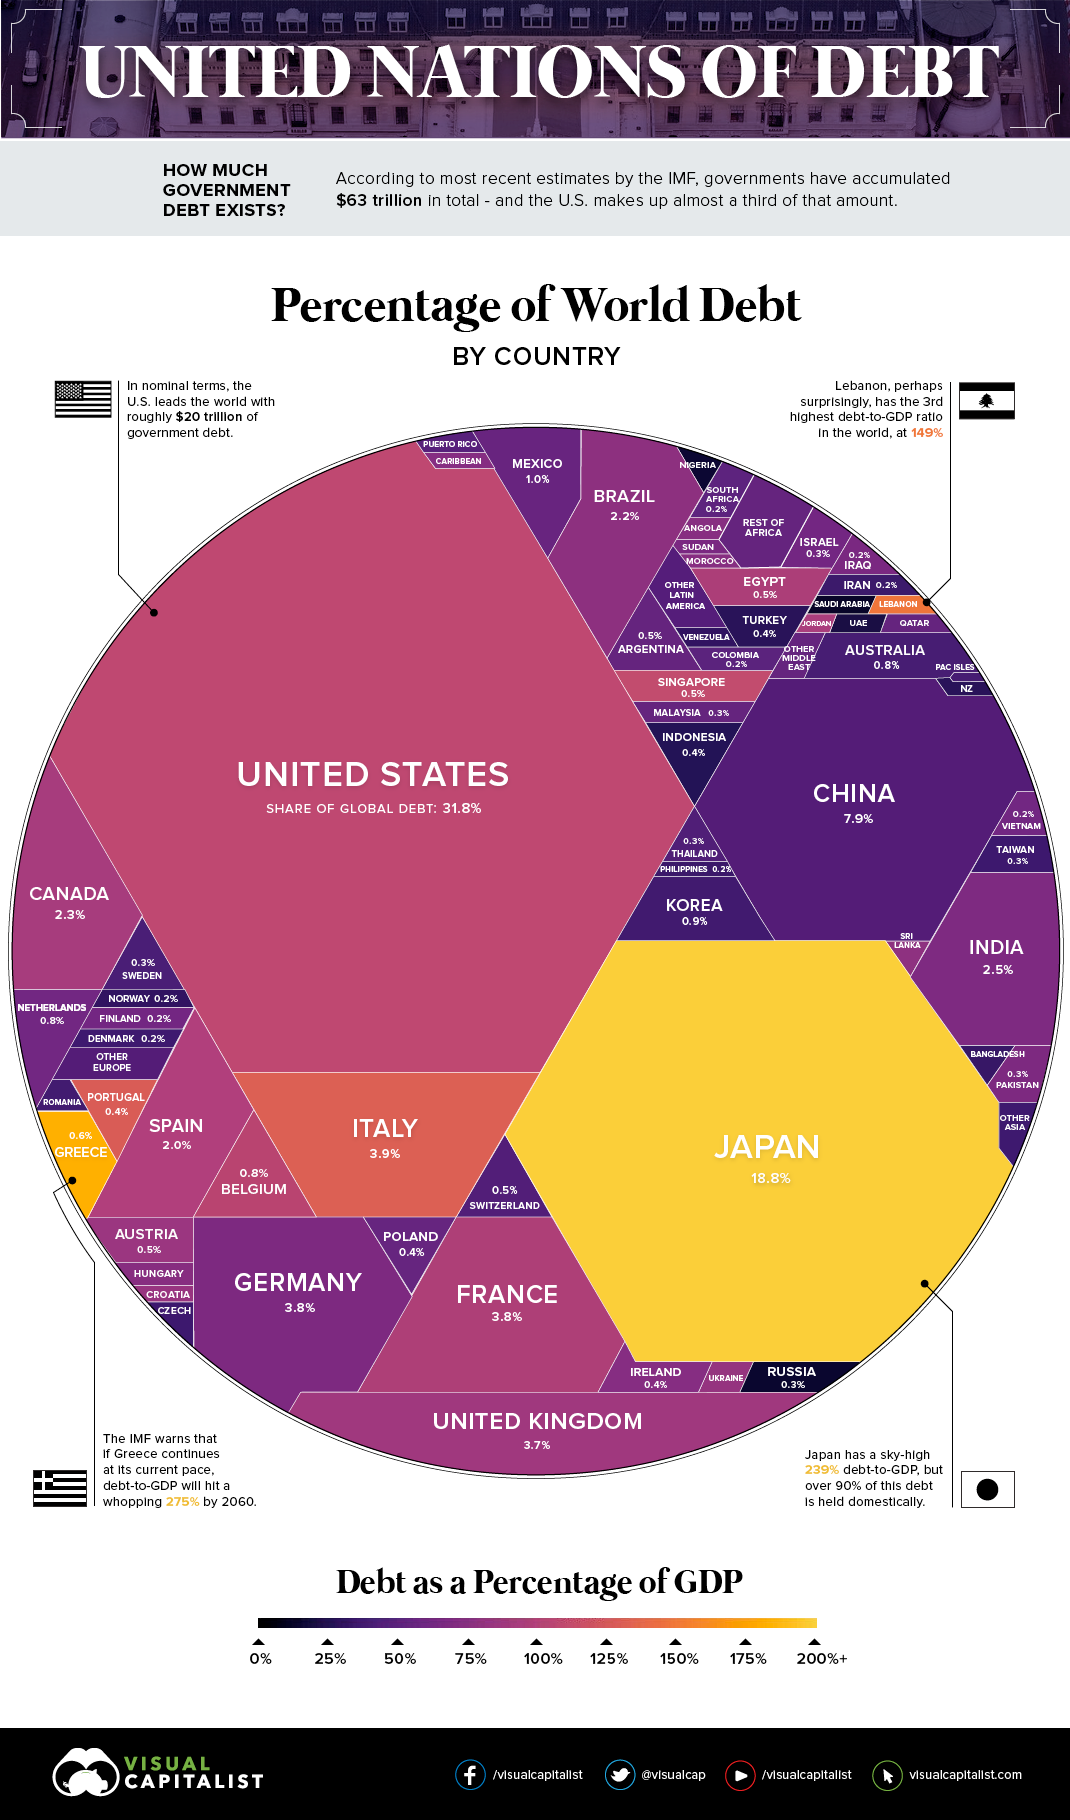
If you add up all the money that national governments have borrowed, it tallies to a hefty $63 trillion.
In an ideal situation, governments are just borrowing this money to cover short-term budget deficits or to finance mission critical projects. However, around the globe, countries have taken to the idea of running constant deficits as the normal course of business, and too much accumulation of debt is not healthy for countries or the global economy as a whole.
The U.S. is a prime example of “debt creep” – the country hasn’t posted an annual budget surplus since 2001, when the federal debt was only $6.9 trillion (54% of GDP). Fast forward to today, and the debt has ballooned to roughly $20 trillion (107% of GDP), which is equal to 31.8% of the world’s sovereign debt nominally.
The World Debt Leaderboard
In today’s infographic, we look at two major measures: (1) Share of global debt as a percentage, and (2) Debt-to-GDP.
Let’s look at the top five “leaders” in each category, starting with share of global debt on a nominal basis:
| Rank | Countries | Debt ($B) | % of Global Debt | Debt-to-GDP |
|---|---|---|---|---|
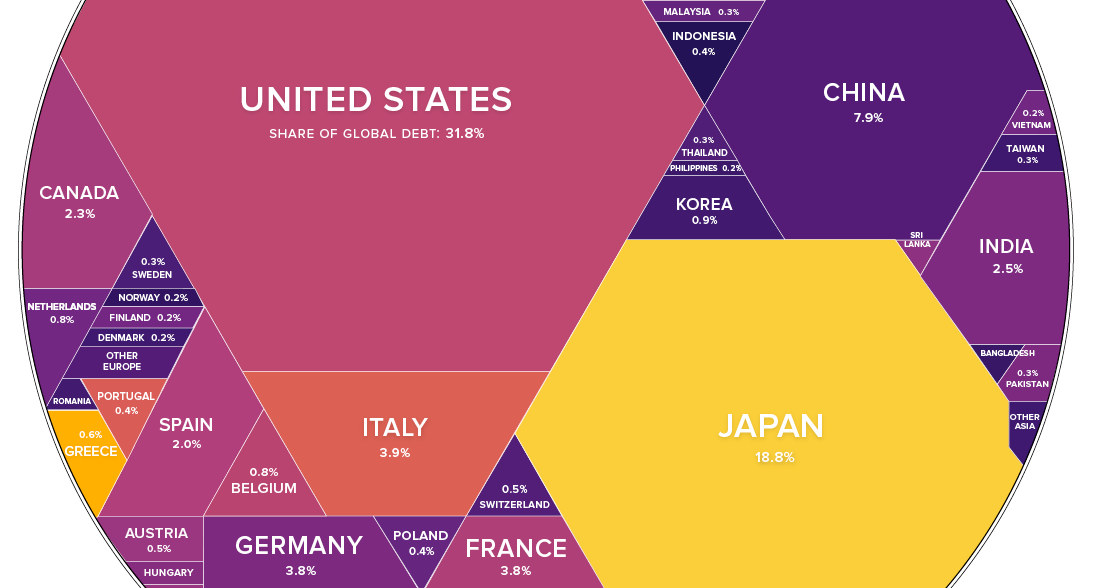
| #1 | United States | $19,947 | 31.8% | 107.1% |
| #2 | Japan | $11,813 | 18.8% | 239.3% |
| #3 | China | $4,976 | 7.9% | 44.3% |
| #4 | Italy | $2,454 | 3.9% | 132.6% |
| #5 | France | $2,375 | 3.8% | 96.3% |
Together, just these five countries together hold 66% of the world’s debt in nominal terms – good for a total of $41.6 trillion.
Next, here’s the top five for Debt-to-GDP:
| Rank | Country | Debt ($B) | % of Global Debt | Debt-to-GDP |
|---|---|---|---|---|
| #1 | Japan | $11,813 | 18.8% | 239.3% |
| #2 | Greece | $353 | 0.6% | 181.6% |
| #3 | Lebanon | $75 | 0.1% | 148.7% |
| #4 | Italy | $2,454 | 3.9% | 132.6% |
| #5 | Portugal | $267 | 0.4% | 130.3% |
While only Italy and Japan here are considered major economies on a global scale, the high debt levels of countries like Greece or Portugal are also important to monitor.
In the IMF’s baseline scenario, Greece’s government debt will reach 275% of its GDP by 2060, when its financing needs will represent 62% of GDP.
A recent IMF report, obtained by Bloomberg
Greece, for example, is continuing along a particularly unsustainable path – and external creditors are getting stingier. Most recently, both the IMF and Greece’s euro-area creditors have demanded for the country to implement a law that automatically introduces austerity measures if a budget surplus of 3.5% of GDP isn’t hit.
While Greece has dismissed such demands as “unacceptable”, the country – along with many others around the globe – will have to accept that constant debt accumulation has eventual consequences.


Markets
Mapped: Europe’s GDP Per Capita, by Country
Which European economies are richest on a GDP per capita basis? This map shows the results for 44 countries across the continent.


Mapped: Europe’s GDP Per Capita, by Country (2024)
This was originally posted on our Voronoi app. Download the app for free on iOS or Android and discover incredible data-driven charts from a variety of trusted sources.
Europe is home to some of the largest and most sophisticated economies in the world. But how do countries in the region compare with each other on a per capita productivity basis?
In this map, we show Europe’s GDP per capita levels across 44 nations in current U.S. dollars. Data for this visualization and article is sourced from the International Monetary Fund (IMF) via their DataMapper tool, updated April 2024.
Europe’s Richest and Poorest Nations, By GDP Per Capita
Luxembourg, Ireland, and Switzerland, lead the list of Europe’s richest nations by GDP per capita, all above $100,000.
| Rank | Country | GDP Per Capita (2024) |
|---|---|---|
| 1 | 🇱🇺 Luxembourg | $131,380 |
| 2 | 🇮🇪 Ireland | $106,060 |
| 3 | 🇨🇭 Switzerland | $105,670 |
| 4 | 🇳🇴 Norway | $94,660 |
| 5 | 🇮🇸 Iceland | $84,590 |
| 6 | 🇩🇰 Denmark | $68,900 |
| 7 | 🇳🇱 Netherlands | $63,750 |
| 8 | 🇸🇲 San Marino | $59,410 |
| 9 | 🇦🇹 Austria | $59,230 |
| 10 | 🇸🇪 Sweden | $58,530 |
| 11 | 🇧🇪 Belgium | $55,540 |
| 12 | 🇫🇮 Finland | $55,130 |
| 13 | 🇩🇪 Germany | $54,290 |
| 14 | 🇬🇧 UK | $51,070 |
| 15 | 🇫🇷 France | $47,360 |
| 16 | 🇦🇩 Andorra | $44,900 |
| 17 | 🇲🇹 Malta | $41,740 |
| 18 | 🇮🇹 Italy | $39,580 |
| 19 | 🇨🇾 Cyprus | $37,150 |
| 20 | 🇪🇸 Spain | $34,050 |
| 21 | 🇸🇮 Slovenia | $34,030 |
| 22 | 🇪🇪 Estonia | $31,850 |
| 23 | 🇨🇿 Czech Republic | $29,800 |
| 24 | 🇵🇹 Portugal | $28,970 |
| 25 | 🇱🇹 Lithuania | $28,410 |
| 26 | 🇸🇰 Slovakia | $25,930 |
| 27 | 🇱🇻 Latvia | $24,190 |
| 28 | 🇬🇷 Greece | $23,970 |
| 29 | 🇭🇺 Hungary | $23,320 |
| 30 | 🇵🇱 Poland | $23,010 |
| 31 | 🇭🇷 Croatia | $22,970 |
| 32 | 🇷🇴 Romania | $19,530 |
| 33 | 🇧🇬 Bulgaria | $16,940 |
| 34 | 🇷🇺 Russia | $14,390 |
| 35 | 🇹🇷 Türkiye | $12,760 |
| 36 | 🇲🇪 Montenegro | $12,650 |
| 37 | 🇷🇸 Serbia | $12,380 |
| 38 | 🇦🇱 Albania | $8,920 |
| 39 | 🇧🇦 Bosnia & Herzegovina | $8,420 |
| 40 | 🇲🇰 North Macedonia | $7,690 |
| 41 | 🇧🇾 Belarus | $7,560 |
| 42 | 🇲🇩 Moldova | $7,490 |
| 43 | 🇽🇰 Kosovo | $6,390 |
| 44 | 🇺🇦 Ukraine | $5,660 |
| N/A | 🇪🇺 EU Average | $44,200 |
Note: Figures are rounded.
Three Nordic countries (Norway, Iceland, Denmark) also place highly, between $70,000-90,000. Other Nordic peers, Sweden and Finland rank just outside the top 10, between $55,000-60,000.
Meanwhile, Europe’s biggest economies in absolute terms, Germany, UK, and France, rank closer to the middle of the top 20, with GDP per capitas around $50,000.
Finally, at the end of the scale, Eastern Europe as a whole tends to have much lower per capita GDPs. In that group, Ukraine ranks last, at $5,660.
A Closer Look at Ukraine
For a broader comparison, Ukraine’s per capita GDP is similar to Iran ($5,310), El Salvador ($5,540), and Guatemala ($5,680).
According to experts, Ukraine’s economy has historically underperformed to expectations. After the fall of the Berlin Wall, the economy contracted for five straight years. Its transition to a Western, liberalized economic structure was overshadowed by widespread corruption, a limited taxpool, and few revenue sources.
Politically, its transformation from authoritarian regime to civil democracy has proved difficult, especially when it comes to institution building.
Finally, after the 2022 invasion of the country, Ukraine’s GDP contracted by 30% in a single year—the largest loss since independence. Large scale emigration—to the tune of six million refugees—is also playing a role.
Despite these challenges, the country’s economic growth has somewhat stabilized while fighting continues.

-

 Markets6 days ago
The Most Valuable Companies in Major EU Economies
-

 Wealth2 weeks ago
Charted: Which City Has the Most Billionaires in 2024?
-

 Technology2 weeks ago
All of the Grants Given by the U.S. CHIPS Act
-

 Green2 weeks ago
The Carbon Footprint of Major Travel Methods
-

 United States1 week ago
Visualizing the Most Common Pets in the U.S.
-

 Culture1 week ago
The World’s Top Media Franchises by All-Time Revenue
-

 voronoi1 week ago
Best Visualizations of April on the Voronoi App
-

 Wealth1 week ago
Charted: Which Country Has the Most Billionaires in 2024?