Money
Where do the World’s Millionaires Live?
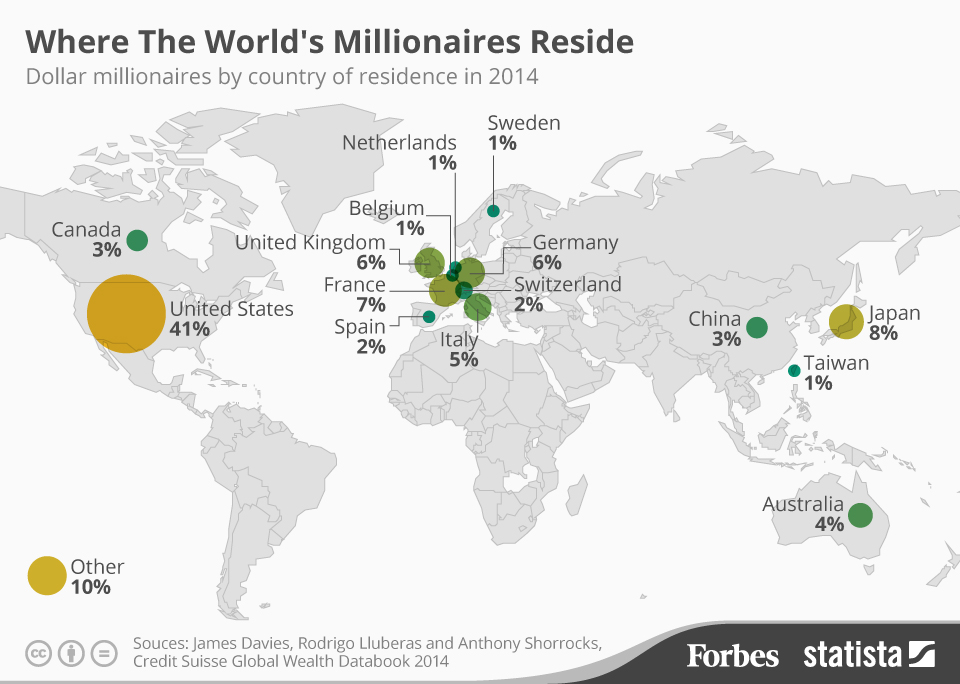
There are 34,837,000 millionaires scattered across the globe. Ever wonder where all of these people reside? The Credit Suisse Global Wealth Report is here to help.
The following three infographics show: Millionaires by country, millionaires by density (per city), and developing countries with the biggest concentration of millionaires.
The United States comes in first place by a wide margin, with 41% of the world’s millionaires.
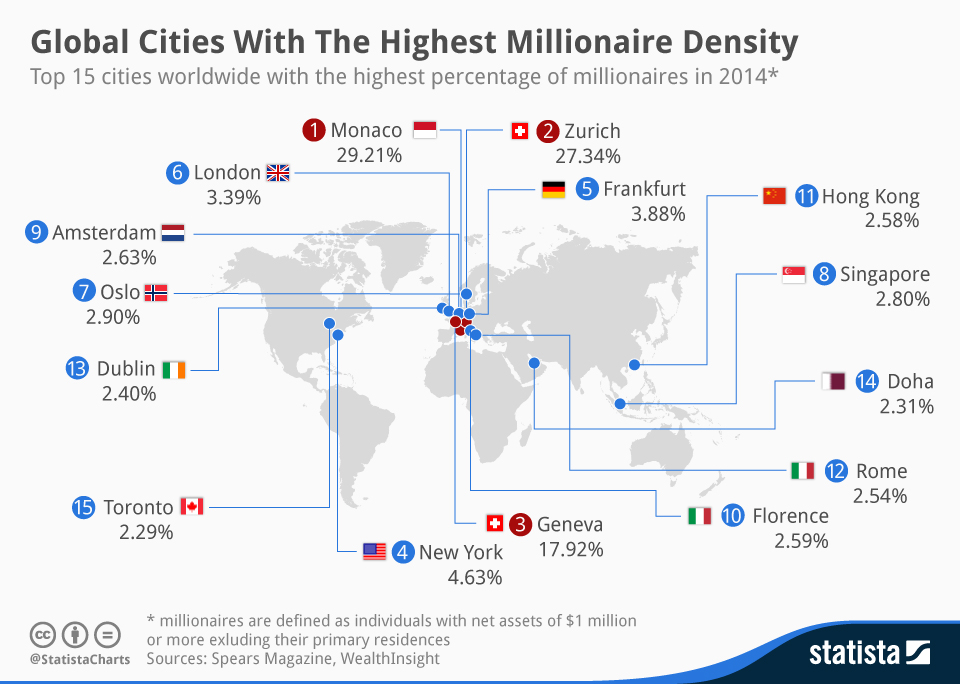
Amazingly, 10,000 of Monaco’s 37,000 residents are millionaires. Monaco is a tiny principality next to the French Riviera that is famous for its beaches. Monaco and Zurich have the two highest concentrations of millionaires per city.
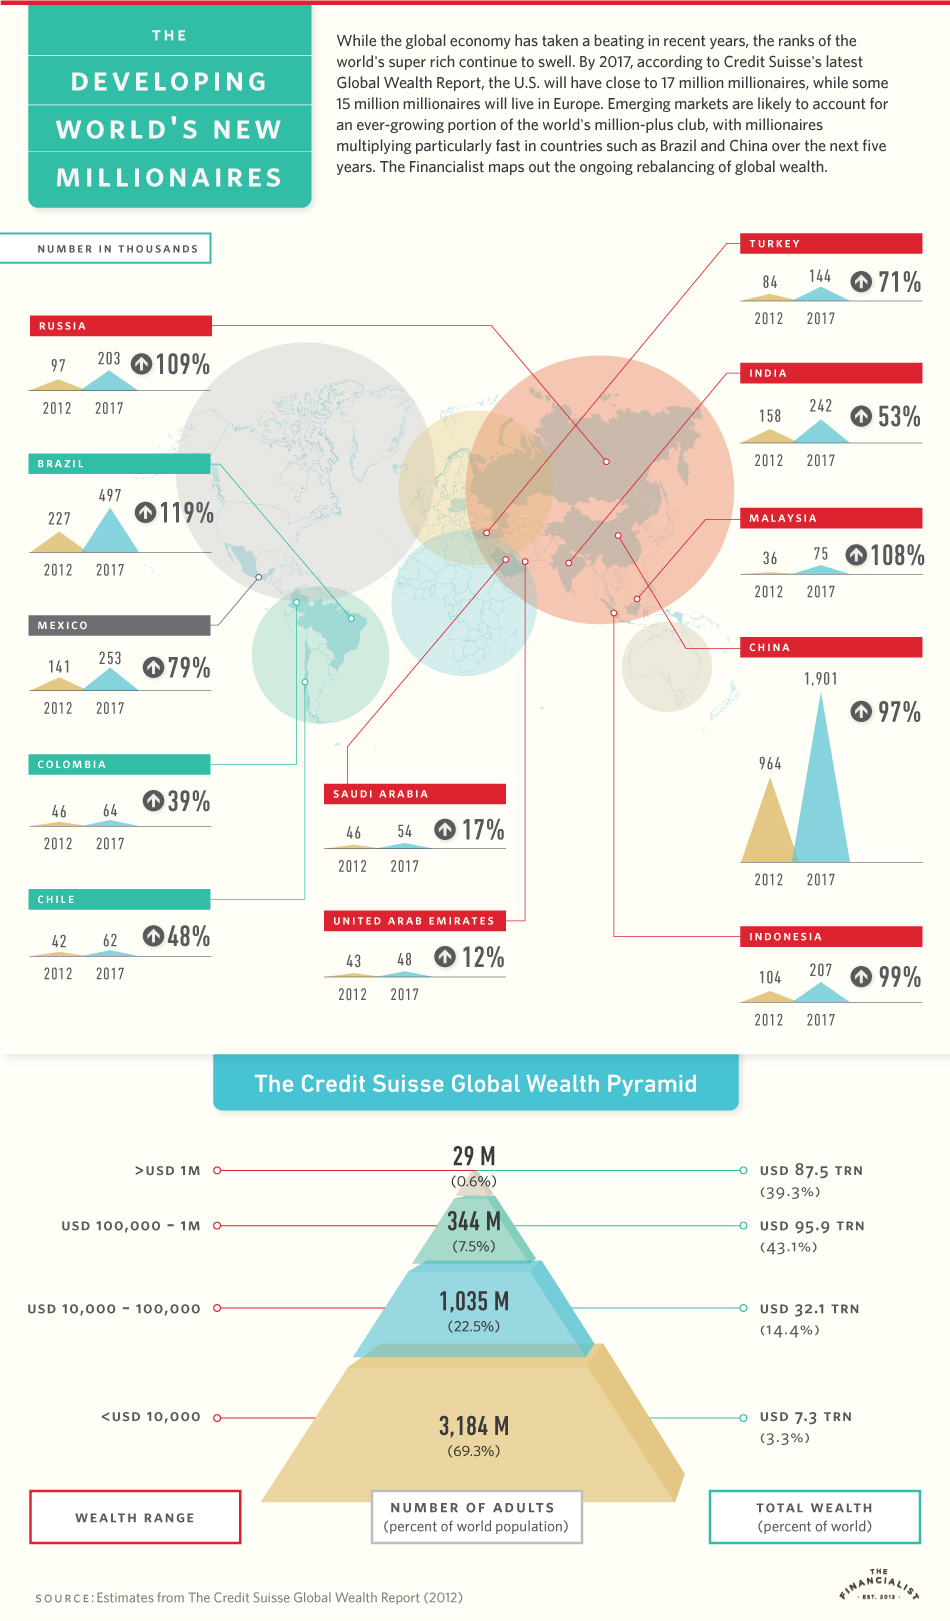
China is on pace to have just short of 2 million millionaires by 2017.


Money
Charted: Which City Has the Most Billionaires in 2024?
Just two countries account for half of the top 20 cities with the most billionaires. And the majority of the other half are found in Asia.


Charted: Which Country Has the Most Billionaires in 2024?
This was originally posted on our Voronoi app. Download the app for free on iOS or Android and discover incredible data-driven charts from a variety of trusted sources.
Some cities seem to attract the rich. Take New York City for example, which has 340,000 high-net-worth residents with investable assets of more than $1 million.
But there’s a vast difference between being a millionaire and a billionaire. So where do the richest of them all live?
Using data from the Hurun Global Rich List 2024, we rank the top 20 cities with the highest number of billionaires in 2024.
A caveat to these rich lists: sources often vary on figures and exact rankings. For example, in last year’s reports, Forbes had New York as the city with the most billionaires, while the Hurun Global Rich List placed Beijing at the top spot.
Ranked: Top 20 Cities with the Most Billionaires in 2024
The Chinese economy’s doldrums over the course of the past year have affected its ultra-wealthy residents in key cities.
Beijing, the city with the most billionaires in 2023, has not only ceded its spot to New York, but has dropped to #4, overtaken by London and Mumbai.
| Rank | City | Billionaires | Rank Change YoY |
|---|---|---|---|
| 1 | 🇺🇸 New York | 119 | +1 |
| 2 | 🇬🇧 London | 97 | +3 |
| 3 | 🇮🇳 Mumbai | 92 | +4 |
| 4 | 🇨🇳 Beijing | 91 | -3 |
| 5 | 🇨🇳 Shanghai | 87 | -2 |
| 6 | 🇨🇳 Shenzhen | 84 | -2 |
| 7 | 🇭🇰 Hong Kong | 65 | -1 |
| 8 | 🇷🇺 Moscow | 59 | No Change |
| 9 | 🇮🇳 New Delhi | 57 | +6 |
| 10 | 🇺🇸 San Francisco | 52 | No Change |
| 11 | 🇹🇭 Bangkok | 49 | +2 |
| 12 | 🇹🇼 Taipei | 45 | +2 |
| 13 | 🇫🇷 Paris | 44 | -2 |
| 14 | 🇨🇳 Hangzhou | 43 | -5 |
| 15 | 🇸🇬 Singapore | 42 | New to Top 20 |
| 16 | 🇨🇳 Guangzhou | 39 | -4 |
| 17T | 🇮🇩 Jakarta | 37 | +1 |
| 17T | 🇧🇷 Sao Paulo | 37 | No Change |
| 19T | 🇺🇸 Los Angeles | 31 | No Change |
| 19T | 🇰🇷 Seoul | 31 | -3 |
In fact all Chinese cities on the top 20 list have lost billionaires between 2023–24. Consequently, they’ve all lost ranking spots as well, with Hangzhou seeing the biggest slide (-5) in the top 20.
Where China lost, all other Asian cities—except Seoul—in the top 20 have gained ranks. Indian cities lead the way, with New Delhi (+6) and Mumbai (+3) having climbed the most.
At a country level, China and the U.S combine to make up half of the cities in the top 20. They are also home to about half of the world’s 3,200 billionaire population.
In other news of note: Hurun officially counts Taylor Swift as a billionaire, estimating her net worth at $1.2 billion.

-

 Debt1 week ago
How Debt-to-GDP Ratios Have Changed Since 2000
-

 Markets2 weeks ago
Ranked: The World’s Top Flight Routes, by Revenue
-

 Countries2 weeks ago
Population Projections: The World’s 6 Largest Countries in 2075
-

 Markets2 weeks ago
The Top 10 States by Real GDP Growth in 2023
-

 Demographics2 weeks ago
The Smallest Gender Wage Gaps in OECD Countries
-

 United States2 weeks ago
Where U.S. Inflation Hit the Hardest in March 2024
-

 Green2 weeks ago
Top Countries By Forest Growth Since 2001
-

 United States2 weeks ago
Ranked: The Largest U.S. Corporations by Number of Employees