Markets
Walmart Nation: Mapping the Largest Employers in the U.S.
Walmart Nation: Mapping the Largest Employers in the U.S.
The Chart of the Week is a weekly Visual Capitalist feature on Fridays.
In an era where Amazon steals most of the headlines, it’s easy to forget about brick-and-mortar retailers like Walmart.
But, even though the market values the Bezos e-commerce juggernaut at about twice the sum of Walmart, the blue big-box store is very formidable in other ways. For example, revenue and earnings are two areas where Walmart still reigns supreme, and the stock just hit all-time highs yesterday on an earnings beat.
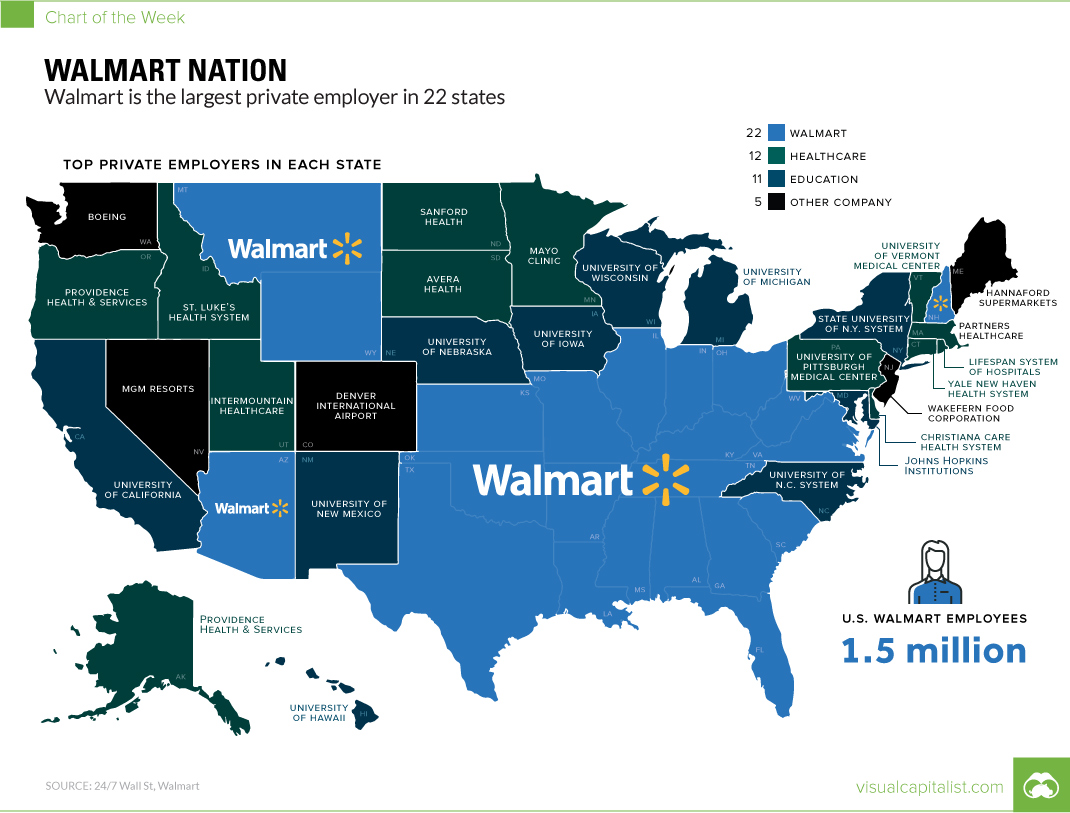
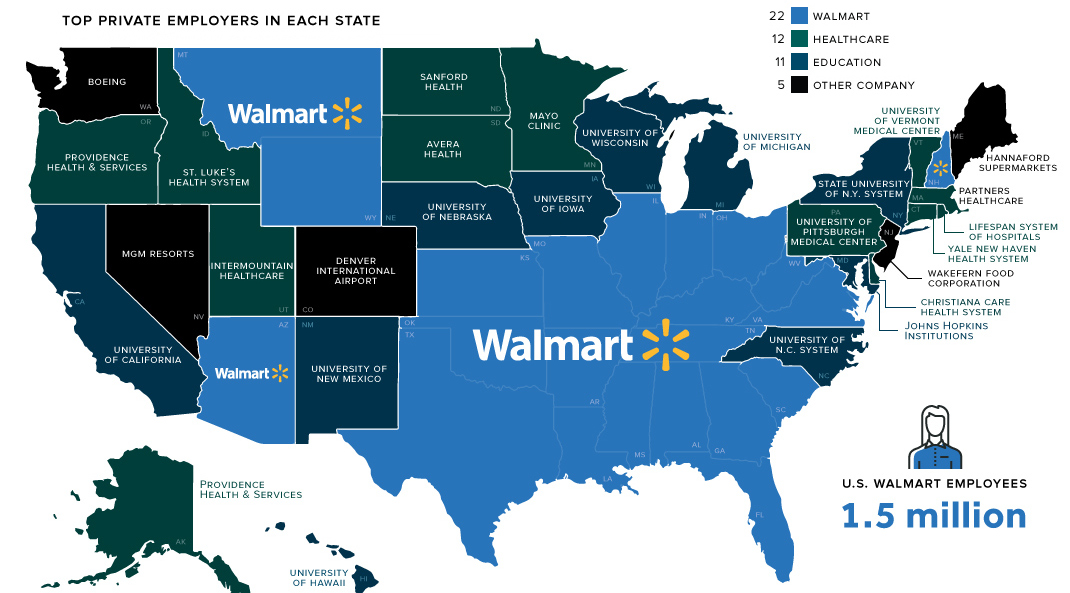
That’s not all, though. As today’s map shows, Walmart is dominant in one other notable way: the company is the biggest private employer in America in a whopping 22 states.
Wally World
Using data from 24/7 Wall Street, we mapped out the largest employer (excluding public administrative bodies, such as state governments) in each state.
Here are the states where Walmart took the title:
| State | Company | # of employees |
|---|---|---|
| Alabama | Walmart | 38,041 |
| Arizona | Walmart | 33,910 |
| Arkansas | Walmart | 53,310 |
| Florida | Walmart | 108,321 |
| Georgia | Walmart | 59,371 |
| Illinois | Walmart | 54,698 |
| Indiana | Walmart | 39,667 |
| Kansas | Walmart | 20,938 |
| Kentucky | Walmart | 30,181 |
| Louisiana | Walmart | 36,992 |
| Mississippi | Walmart | 24,898 |
| Missouri | Walmart | 43,203 |
| Montana | Walmart | 4,776 |
| New Hampshire | Walmart | 8,284 |
| Ohio | Walmart | 50,481 |
| Oklahoma | Walmart | 34,014 |
| South Carolina | Walmart | 32,267 |
| Tennessee | Walmart | 41,487 |
| Texas | Walmart | 171,531 |
| Virginia | Walmart | 44,621 |
| West Virginia | Walmart | 12,321 |
| Wyoming | Walmart | 4,699 |
The company has 1.5 million employees in the U.S. – and about 950,000 of them are in the states above.
A Southern Institution
In Walmart’s home state of Arkansas, the company employees 53,310 people, or about 4% of the non-farm work force. That includes about 18,600 jobs at the HQ in Bentonville, AR.
Despite the company’s obvious influence in the state where it was founded, Walmart is also the largest employer across the South in general. Whether it is Texas (171,531 employees) or Virginia (44,621), there are Walmarts aplenty in the states surrounding Arkansas.
One notable exception to this rule? North Carolina, where the University of North Carolina University system employs 74,079 people. However, that doesn’t mean that Walmart has zero presence in the Tar Heel State – it actually has 218 retail stores and 58,525 employees in North Carolina, according to its website.
Your Turn, Amazon
In case you may be wondering, Amazon is not the largest employer in any state – even in the company’s home state of Washington, where it still lags behind Boeing.
However, Amazon’s epic ramp-up is quickly taking over Seattle, and the company now has as much office space there as the city’s next 40 biggest employers combined.
And who knows, with over 238 bids for Amazon’s new HQ2, it’s possible that the company could be adding up to 50,000 new jobs in another state very soon.


Markets
The European Stock Market: Attractive Valuations Offer Opportunities
On average, the European stock market has valuations that are nearly 50% lower than U.S. valuations. But how can you access the market?


European Stock Market: Attractive Valuations Offer Opportunities
Europe is known for some established brands, from L’Oréal to Louis Vuitton. However, the European stock market offers additional opportunities that may be lesser known.
The above infographic, sponsored by STOXX, outlines why investors may want to consider European stocks.
Attractive Valuations
Compared to most North American and Asian markets, European stocks offer lower or comparable valuations.
| Index | Price-to-Earnings Ratio | Price-to-Book Ratio |
|---|---|---|
| EURO STOXX 50 | 14.9 | 2.2 |
| STOXX Europe 600 | 14.4 | 2 |
| U.S. | 25.9 | 4.7 |
| Canada | 16.1 | 1.8 |
| Japan | 15.4 | 1.6 |
| Asia Pacific ex. China | 17.1 | 1.8 |
Data as of February 29, 2024. See graphic for full index names. Ratios based on trailing 12 month financials. The price to earnings ratio excludes companies with negative earnings.
On average, European valuations are nearly 50% lower than U.S. valuations, potentially offering an affordable entry point for investors.
Research also shows that lower price ratios have historically led to higher long-term returns.
Market Movements Not Closely Connected
Over the last decade, the European stock market had low-to-moderate correlation with North American and Asian equities.
The below chart shows correlations from February 2014 to February 2024. A value closer to zero indicates low correlation, while a value of one would indicate that two regions are moving in perfect unison.
| EURO STOXX 50 | STOXX EUROPE 600 | U.S. | Canada | Japan | Asia Pacific ex. China |
|
|---|---|---|---|---|---|---|
| EURO STOXX 50 | 1.00 | 0.97 | 0.55 | 0.67 | 0.24 | 0.43 |
| STOXX EUROPE 600 | 1.00 | 0.56 | 0.71 | 0.28 | 0.48 | |
| U.S. | 1.00 | 0.73 | 0.12 | 0.25 | ||
| Canada | 1.00 | 0.22 | 0.40 | |||
| Japan | 1.00 | 0.88 | ||||
| Asia Pacific ex. China | 1.00 |
Data is based on daily USD returns.
European equities had relatively independent market movements from North American and Asian markets. One contributing factor could be the differing sector weights in each market. For instance, technology makes up a quarter of the U.S. market, but health care and industrials dominate the broader European market.
Ultimately, European equities can enhance portfolio diversification and have the potential to mitigate risk for investors.
Tracking the Market
For investors interested in European equities, STOXX offers a variety of flagship indices:
| Index | Description | Market Cap |
|---|---|---|
| STOXX Europe 600 | Pan-regional, broad market | €10.5T |
| STOXX Developed Europe | Pan-regional, broad-market | €9.9T |
| STOXX Europe 600 ESG-X | Pan-regional, broad market, sustainability focus | €9.7T |
| STOXX Europe 50 | Pan-regional, blue-chip | €5.1T |
| EURO STOXX 50 | Eurozone, blue-chip | €3.5T |
Data is as of February 29, 2024. Market cap is free float, which represents the shares that are readily available for public trading on stock exchanges.
The EURO STOXX 50 tracks the Eurozone’s biggest and most traded companies. It also underlies one of the world’s largest ranges of ETFs and mutual funds. As of November 2023, there were €27.3 billion in ETFs and €23.5B in mutual fund assets under management tracking the index.
“For the past 25 years, the EURO STOXX 50 has served as an accurate, reliable and tradable representation of the Eurozone equity market.”
— Axel Lomholt, General Manager at STOXX
Partnering with STOXX to Track the European Stock Market
Are you interested in European equities? STOXX can be a valuable partner:
- Comprehensive, liquid and investable ecosystem
- European heritage, global reach
- Highly sophisticated customization capabilities
- Open architecture approach to using data
- Close partnerships with clients
- Part of ISS STOXX and Deutsche Börse Group
With a full suite of indices, STOXX can help you benchmark against the European stock market.
Learn how STOXX’s European indices offer liquid and effective market access.

-

 Economy1 day ago
Economic Growth Forecasts for G7 and BRICS Countries in 2024
The IMF has released its economic growth forecasts for 2024. How do the G7 and BRICS countries compare?
-

 Markets1 week ago
U.S. Debt Interest Payments Reach $1 Trillion
U.S. debt interest payments have surged past the $1 trillion dollar mark, amid high interest rates and an ever-expanding debt burden.
-

 United States1 week ago
Ranked: The Largest U.S. Corporations by Number of Employees
We visualized the top U.S. companies by employees, revealing the massive scale of retailers like Walmart, Target, and Home Depot.
-

 Markets2 weeks ago
The Top 10 States by Real GDP Growth in 2023
This graphic shows the states with the highest real GDP growth rate in 2023, largely propelled by the oil and gas boom.
-

 Markets2 weeks ago
Ranked: The World’s Top Flight Routes, by Revenue
In this graphic, we show the highest earning flight routes globally as air travel continued to rebound in 2023.
-

 Markets2 weeks ago
Ranked: The Most Valuable Housing Markets in America
The U.S. residential real estate market is worth a staggering $47.5 trillion. Here are the most valuable housing markets in the country.


-

 Mining1 week ago
Gold vs. S&P 500: Which Has Grown More Over Five Years?
-
Markets2 weeks ago
Ranked: The Most Valuable Housing Markets in America
-

 Money2 weeks ago
Which States Have the Highest Minimum Wage in America?
-

 AI2 weeks ago
Ranked: Semiconductor Companies by Industry Revenue Share
-
Markets2 weeks ago
Ranked: The World’s Top Flight Routes, by Revenue
-

 Demographics2 weeks ago
Population Projections: The World’s 6 Largest Countries in 2075
-
Markets2 weeks ago
The Top 10 States by Real GDP Growth in 2023
-

 Demographics2 weeks ago
The Smallest Gender Wage Gaps in OECD Countries