Markets
Visualized: Ranking the Goods Most Traded Between the U.S. and China
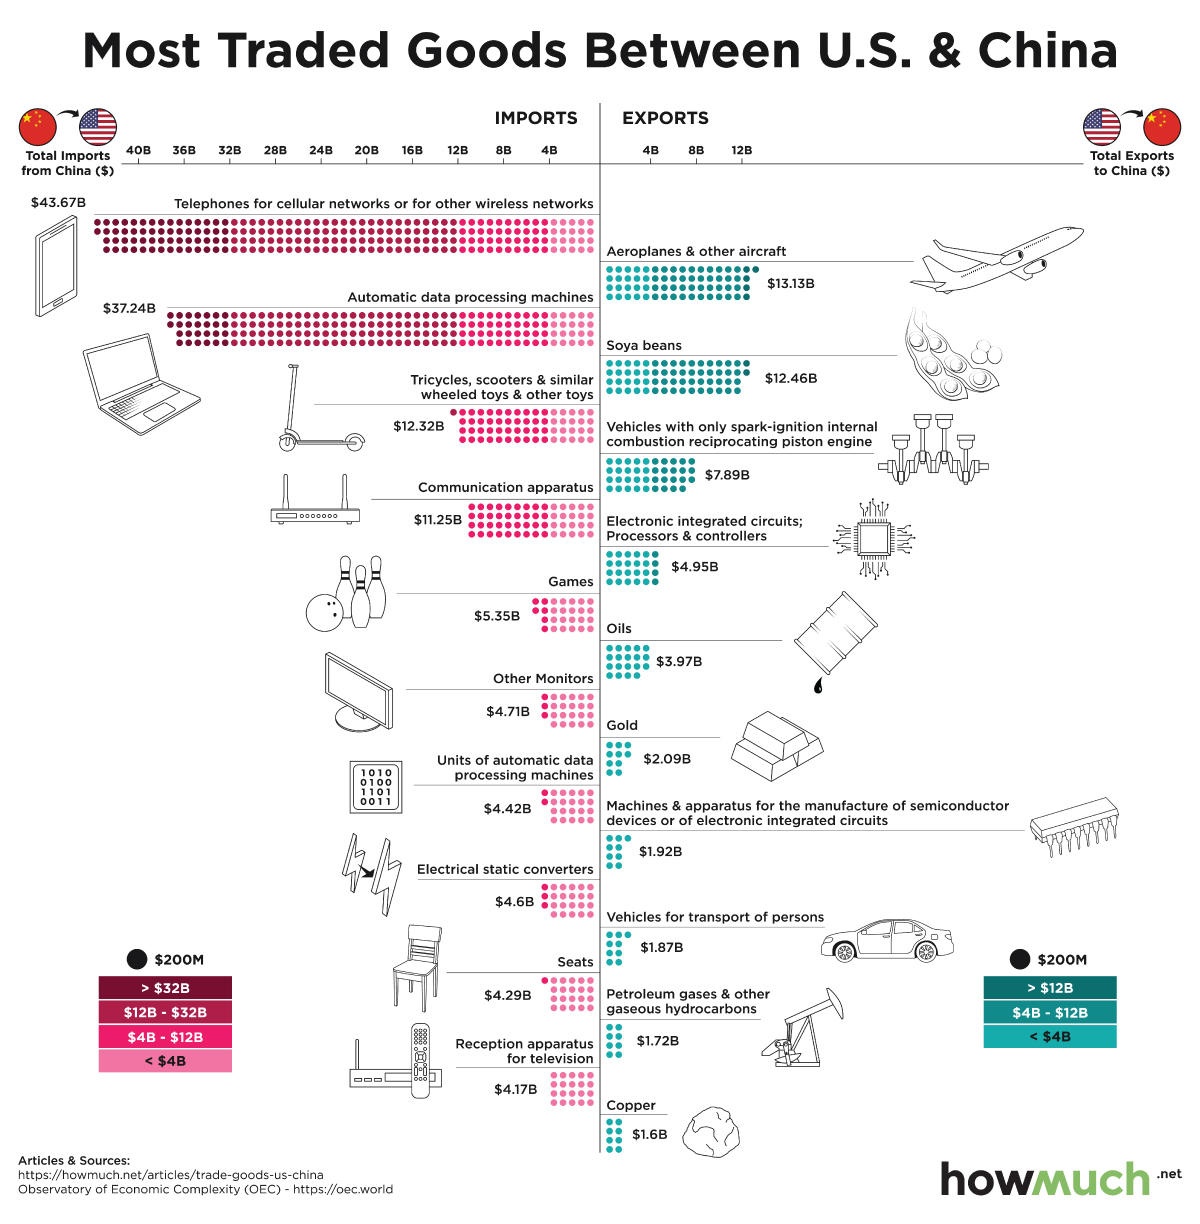
The Most Traded Goods Between the U.S. and China
From a young age, many of us were taught that sharing is caring.
Many countries have also followed this simple principle, in the interest of growth and prosperity, when doing business on a global scale.
Today’s infographic from HowMuch.net charts the top imports and exports between the U.S. and China, pulled from the Observatory of Economic Complexity’s (OEC) global market data for 2017.
Which items do you find most surprising?
Give and Take: The Trade Relationship of the U.S. and China
Two of the world’s largest superpowers today, the U.S. and China have typically had a long-standing trade relationship going back decades.
The table below shows the top 10 exports the U.S. sent to China in 2017, along with the proportion of each item in the total export value of $132 billion. The top 10 items account for 39% of total exports to China.
The Top 10 Exports from the U.S. to China (2017)
| Items | Value (US$B) | % of Total Exports |
|---|---|---|
| Aeroplanes and other aircraft | $13.1 | 9.9% |
| Soya beans | $12.5 | 9.4% |
| Vehicles with only spark-ignition internal combustion reciprocating piston engine | $7.9 | 6.0% |
| Electronic integrated circuits; Processors and controllers | $4.9 | 3.7% |
| Oils | $4.0 | 3.0% |
| Gold | $2.1 | 1.6% |
| Machines and apparatus for the manufacture of semiconductor devices or of electronic integrated circuits | $1.9 | 1.5% |
| Vehicles for transport of persons | $1.9 | 1.4% |
| Petroleum gases and other gaseous hydrocarbons | $1.7 | 1.3% |
| Copper | $1.6 | 1.2% |
While the majority of these are highly specialized, manufactured products─such as airplanes, integrated circuits, and semiconductors─the U.S. still relies on exporting many basic commodities such as gold, copper, and soya beans.
Below is the list of the top 10 imported products from China, and the percent that each product accounts of the total $444 billion in 2017. These top 10 items make up 30% of all products imported from China.
The Top 10 Imports from China to the U.S. (2017)
| Items | Value (US$B) | % of Total Imports |
|---|---|---|
| Telephones for cellular networks or for other wireless networks | $43.7 | 9.8% |
| Automatic data processing machines | $37.2 | 8.4% |
| Trycicles, scooters and similar wheeled toys & other toys | $12.3 | 2.8% |
| Communication apparatus | $11.3 | 2.5% |
| Games; articles for funfair | $5.4 | 1.2% |
| Other Monitors | $4.7 | 1.1% |
| Units of automatic data processing machines | $4.4 | 1.0% |
| Electrical static converters | $4.6 | 1.0% |
| Seats | $4.3 | 1.0% |
| Reception apparatus for television | $4.2 | 0.9% |
China is best known for its electronics and technology-focused products─with electronics products accounting for two-thirds of the top 10 Chinese imports. In 2017, China also dominated all electronics imports into the U.S., claiming over 60% of the market.
But how has the recent trade war impacted the imports and exports between the U.S. and China?
The U.S.-China Trade War Continues
At one point, China was the United States’ top trading partner in terms of the total value of imports and exports. Since the trade war began in 2018, China has fallen to third place.
For example, soybean exports to China in 2019 are predicted to only reach a third of numbers seen in 2018, and the price of this commodity has been nearly cut in half.
In the first nine months of 2019 alone, the U.S. saw a 13.5% drop in imported products from China, due to actual and threatened increased tariffs. In addition, U.S. exports to China dropped by 15.5%─a significant loss of $53 billion.
The Future of U.S.-China Trade
To date, the U.S. has enacted tariffs on over $550 billion worth of imported products from China. In response to the U.S. tariffs, China has added tariffs to $185 billion worth of exported goods from the United States.
With the 2020 U.S. presidential election looming on the horizon, threats of increased tariffs seem to dominate headlines internationally. If these trends continue, many U.S. businesses—both at home and abroad in China—could find their bottom lines threatened by rising trade costs.


Markets
The European Stock Market: Attractive Valuations Offer Opportunities
On average, the European stock market has valuations that are nearly 50% lower than U.S. valuations. But how can you access the market?


European Stock Market: Attractive Valuations Offer Opportunities
Europe is known for some established brands, from L’Oréal to Louis Vuitton. However, the European stock market offers additional opportunities that may be lesser known.
The above infographic, sponsored by STOXX, outlines why investors may want to consider European stocks.
Attractive Valuations
Compared to most North American and Asian markets, European stocks offer lower or comparable valuations.
| Index | Price-to-Earnings Ratio | Price-to-Book Ratio |
|---|---|---|
| EURO STOXX 50 | 14.9 | 2.2 |
| STOXX Europe 600 | 14.4 | 2 |
| U.S. | 25.9 | 4.7 |
| Canada | 16.1 | 1.8 |
| Japan | 15.4 | 1.6 |
| Asia Pacific ex. China | 17.1 | 1.8 |
Data as of February 29, 2024. See graphic for full index names. Ratios based on trailing 12 month financials. The price to earnings ratio excludes companies with negative earnings.
On average, European valuations are nearly 50% lower than U.S. valuations, potentially offering an affordable entry point for investors.
Research also shows that lower price ratios have historically led to higher long-term returns.
Market Movements Not Closely Connected
Over the last decade, the European stock market had low-to-moderate correlation with North American and Asian equities.
The below chart shows correlations from February 2014 to February 2024. A value closer to zero indicates low correlation, while a value of one would indicate that two regions are moving in perfect unison.
| EURO STOXX 50 | STOXX EUROPE 600 | U.S. | Canada | Japan | Asia Pacific ex. China |
|
|---|---|---|---|---|---|---|
| EURO STOXX 50 | 1.00 | 0.97 | 0.55 | 0.67 | 0.24 | 0.43 |
| STOXX EUROPE 600 | 1.00 | 0.56 | 0.71 | 0.28 | 0.48 | |
| U.S. | 1.00 | 0.73 | 0.12 | 0.25 | ||
| Canada | 1.00 | 0.22 | 0.40 | |||
| Japan | 1.00 | 0.88 | ||||
| Asia Pacific ex. China | 1.00 |
Data is based on daily USD returns.
European equities had relatively independent market movements from North American and Asian markets. One contributing factor could be the differing sector weights in each market. For instance, technology makes up a quarter of the U.S. market, but health care and industrials dominate the broader European market.
Ultimately, European equities can enhance portfolio diversification and have the potential to mitigate risk for investors.
Tracking the Market
For investors interested in European equities, STOXX offers a variety of flagship indices:
| Index | Description | Market Cap |
|---|---|---|
| STOXX Europe 600 | Pan-regional, broad market | €10.5T |
| STOXX Developed Europe | Pan-regional, broad-market | €9.9T |
| STOXX Europe 600 ESG-X | Pan-regional, broad market, sustainability focus | €9.7T |
| STOXX Europe 50 | Pan-regional, blue-chip | €5.1T |
| EURO STOXX 50 | Eurozone, blue-chip | €3.5T |
Data is as of February 29, 2024. Market cap is free float, which represents the shares that are readily available for public trading on stock exchanges.
The EURO STOXX 50 tracks the Eurozone’s biggest and most traded companies. It also underlies one of the world’s largest ranges of ETFs and mutual funds. As of November 2023, there were €27.3 billion in ETFs and €23.5B in mutual fund assets under management tracking the index.
“For the past 25 years, the EURO STOXX 50 has served as an accurate, reliable and tradable representation of the Eurozone equity market.”
— Axel Lomholt, General Manager at STOXX
Partnering with STOXX to Track the European Stock Market
Are you interested in European equities? STOXX can be a valuable partner:
- Comprehensive, liquid and investable ecosystem
- European heritage, global reach
- Highly sophisticated customization capabilities
- Open architecture approach to using data
- Close partnerships with clients
- Part of ISS STOXX and Deutsche Börse Group
With a full suite of indices, STOXX can help you benchmark against the European stock market.
Learn how STOXX’s European indices offer liquid and effective market access.

-

 Economy2 days ago
Economic Growth Forecasts for G7 and BRICS Countries in 2024
The IMF has released its economic growth forecasts for 2024. How do the G7 and BRICS countries compare?
-

 Markets1 week ago
U.S. Debt Interest Payments Reach $1 Trillion
U.S. debt interest payments have surged past the $1 trillion dollar mark, amid high interest rates and an ever-expanding debt burden.
-

 United States2 weeks ago
Ranked: The Largest U.S. Corporations by Number of Employees
We visualized the top U.S. companies by employees, revealing the massive scale of retailers like Walmart, Target, and Home Depot.
-

 Markets2 weeks ago
The Top 10 States by Real GDP Growth in 2023
This graphic shows the states with the highest real GDP growth rate in 2023, largely propelled by the oil and gas boom.
-

 Markets2 weeks ago
Ranked: The World’s Top Flight Routes, by Revenue
In this graphic, we show the highest earning flight routes globally as air travel continued to rebound in 2023.
-

 Markets3 weeks ago
Ranked: The Most Valuable Housing Markets in America
The U.S. residential real estate market is worth a staggering $47.5 trillion. Here are the most valuable housing markets in the country.


-

 Debt1 week ago
How Debt-to-GDP Ratios Have Changed Since 2000
-
Markets2 weeks ago
Ranked: The World’s Top Flight Routes, by Revenue
-

 Countries2 weeks ago
Population Projections: The World’s 6 Largest Countries in 2075
-
Markets2 weeks ago
The Top 10 States by Real GDP Growth in 2023
-

 Demographics2 weeks ago
The Smallest Gender Wage Gaps in OECD Countries
-

 Economy2 weeks ago
Where U.S. Inflation Hit the Hardest in March 2024
-

 Green2 weeks ago
Top Countries By Forest Growth Since 2001
-
United States2 weeks ago
Ranked: The Largest U.S. Corporations by Number of Employees