Money
Visualizing U.S. Millionaires by State of Residence
Visualizing U.S. Millionaires by State of Residence
There are literally millions of millionaires in the United States.
In fact, there are 7.1 million households in the country that have investable assets of $1 million or more.
Impressively, this gives the U.S. a higher total population of millionaires than any other country in the world, even though China’s rapidly rising wealth is also quite notable.
Millionaires by State
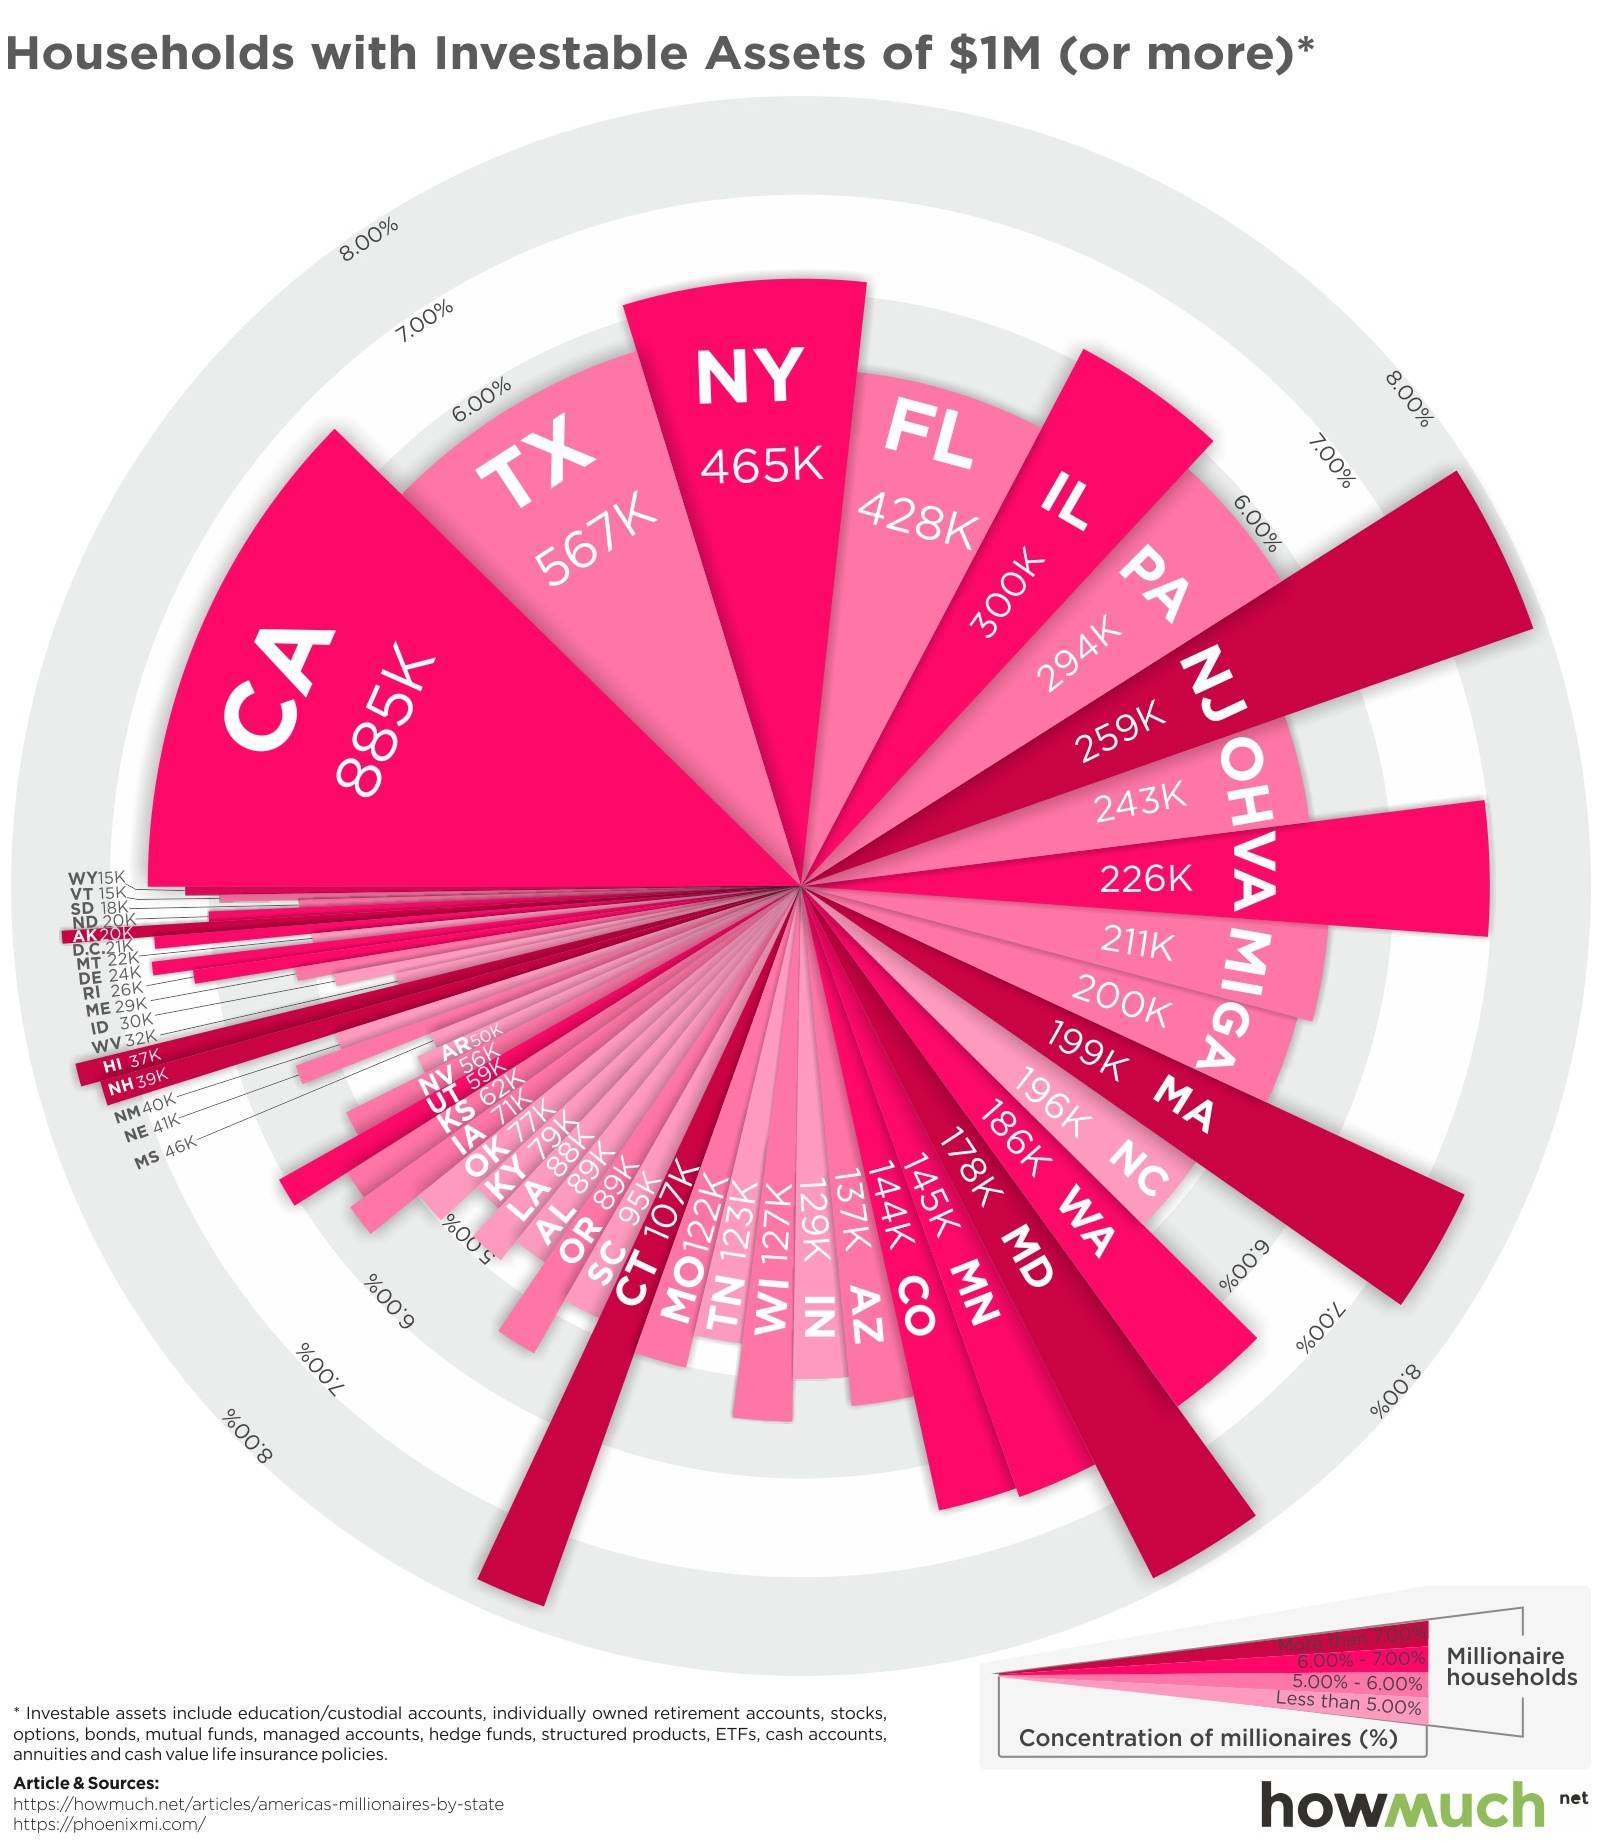
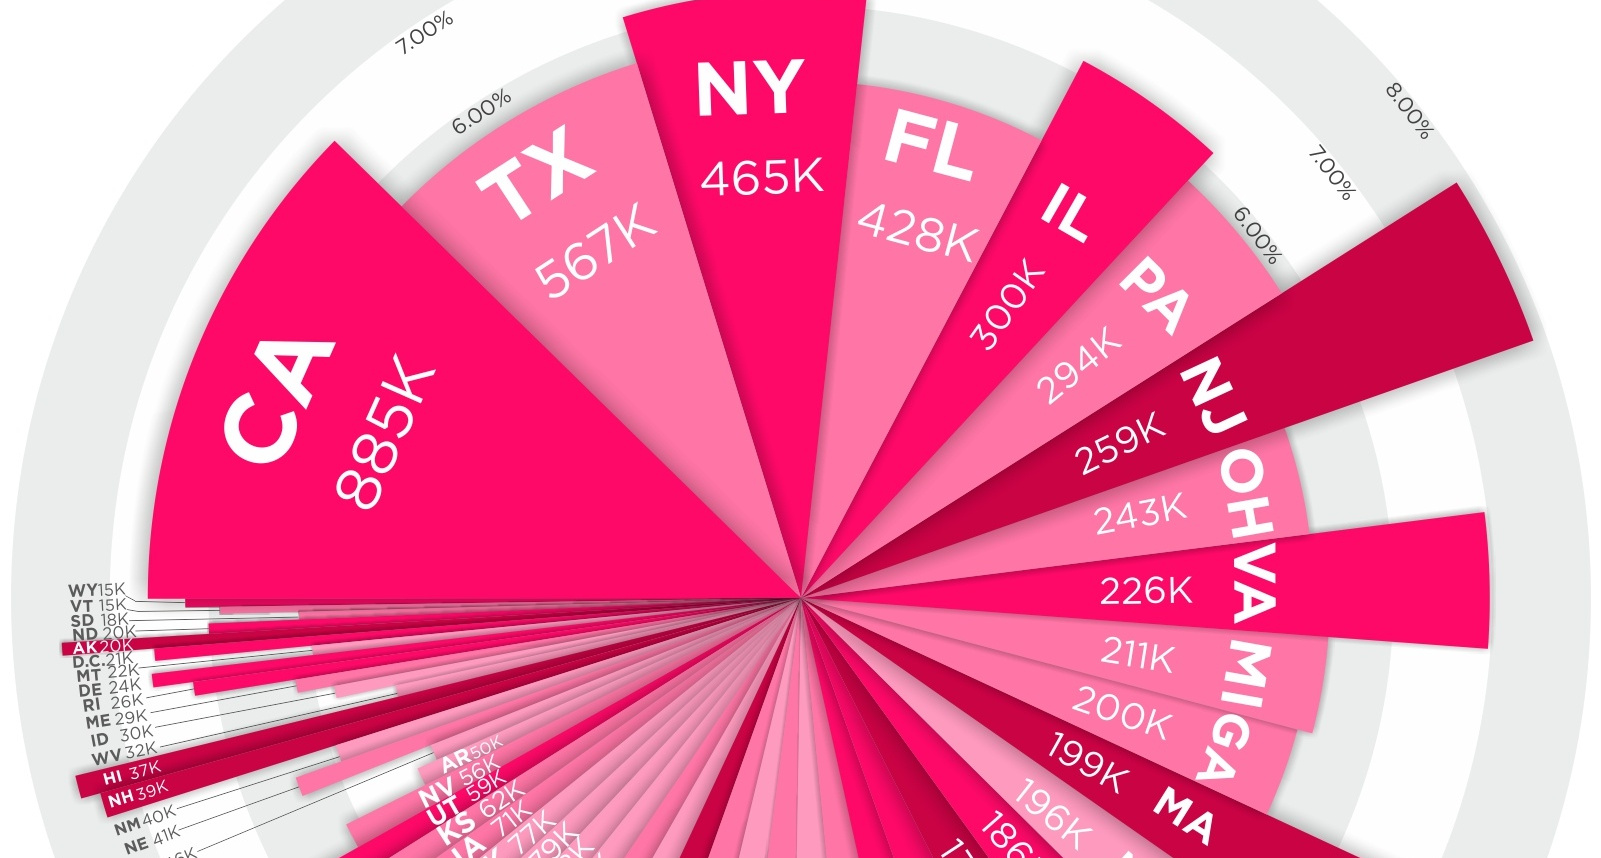
Today’s visualization comes to us from HowMuch.net, and it breaks down U.S. millionaires by state.
Here are the states with the highest millionaire populations, in absolute terms:
| Rank | State | Millionaire households | % of all households |
|---|---|---|---|
| #1 | California | 885,225 | 6.61% |
| #2 | Texas | 566,578 | 5.66% |
| #3 | New York | 465,479 | 6.15% |
| #4 | Florida | 427,824 | 5.23% |
| #5 | Illinois | 300,142 | 6.14% |
| #6 | Pennsylvania | 294,002 | 5.77% |
| #7 | New Jersey | 258,988 | 7.86% |
| #8 | Ohio | 243,118 | 5.19% |
| #9 | Virginia | 226,167 | 6.98% |
| #10 | Michigan | 210,957 | 5.35% |
Not surprisingly, states like California, Texas, New York, and Florida dominate this list. They all have high millionaire populations, but they are also the four most populous states in general.
Millionaire Concentration
When looking at millionaires per capita, aforementioned states like New York, Texas, and Florida all fall off the Top 10 list altogether.
The state of California, however, remains clinging on to the #10 spot:
| Rank | State | Millionaire households | % of all households |
|---|---|---|---|
| #1 | Maryland | 178,003 | 7.87% |
| #2 | New Jersey | 258,988 | 7.86% |
| #3 | Connecticut | 106,892 | 7.75% |
| #4 | Hawaii | 36,903 | 7.57% |
| #5 | Alaska | 20,444 | 7.50% |
| #6 | Massachusetts | 198,750 | 7.41% |
| #7 | New Hampshire | 39,209 | 7.36% |
| #8 | Virginia | 226,167 | 6.98% |
| #9 | Delaware | 24,212 | 6.62% |
| #10 | California | 885,225 | 6.61% |
As you can see, the states surrounding hubs like New York City and D.C. shoot up the rankings when looking at the data this way.
New Jersey and Connecticut are in two of the top three spots – and of course New York City is home to well over 300,000 millionaires itself.
Meanwhile, Maryland walks away with the title of most millionaires per capita. It may be surprising, but this is the seventh year in a row that Maryland has ranked number one in the country for this metric.


Wealth
Charted: Which Country Has the Most Billionaires in 2024?
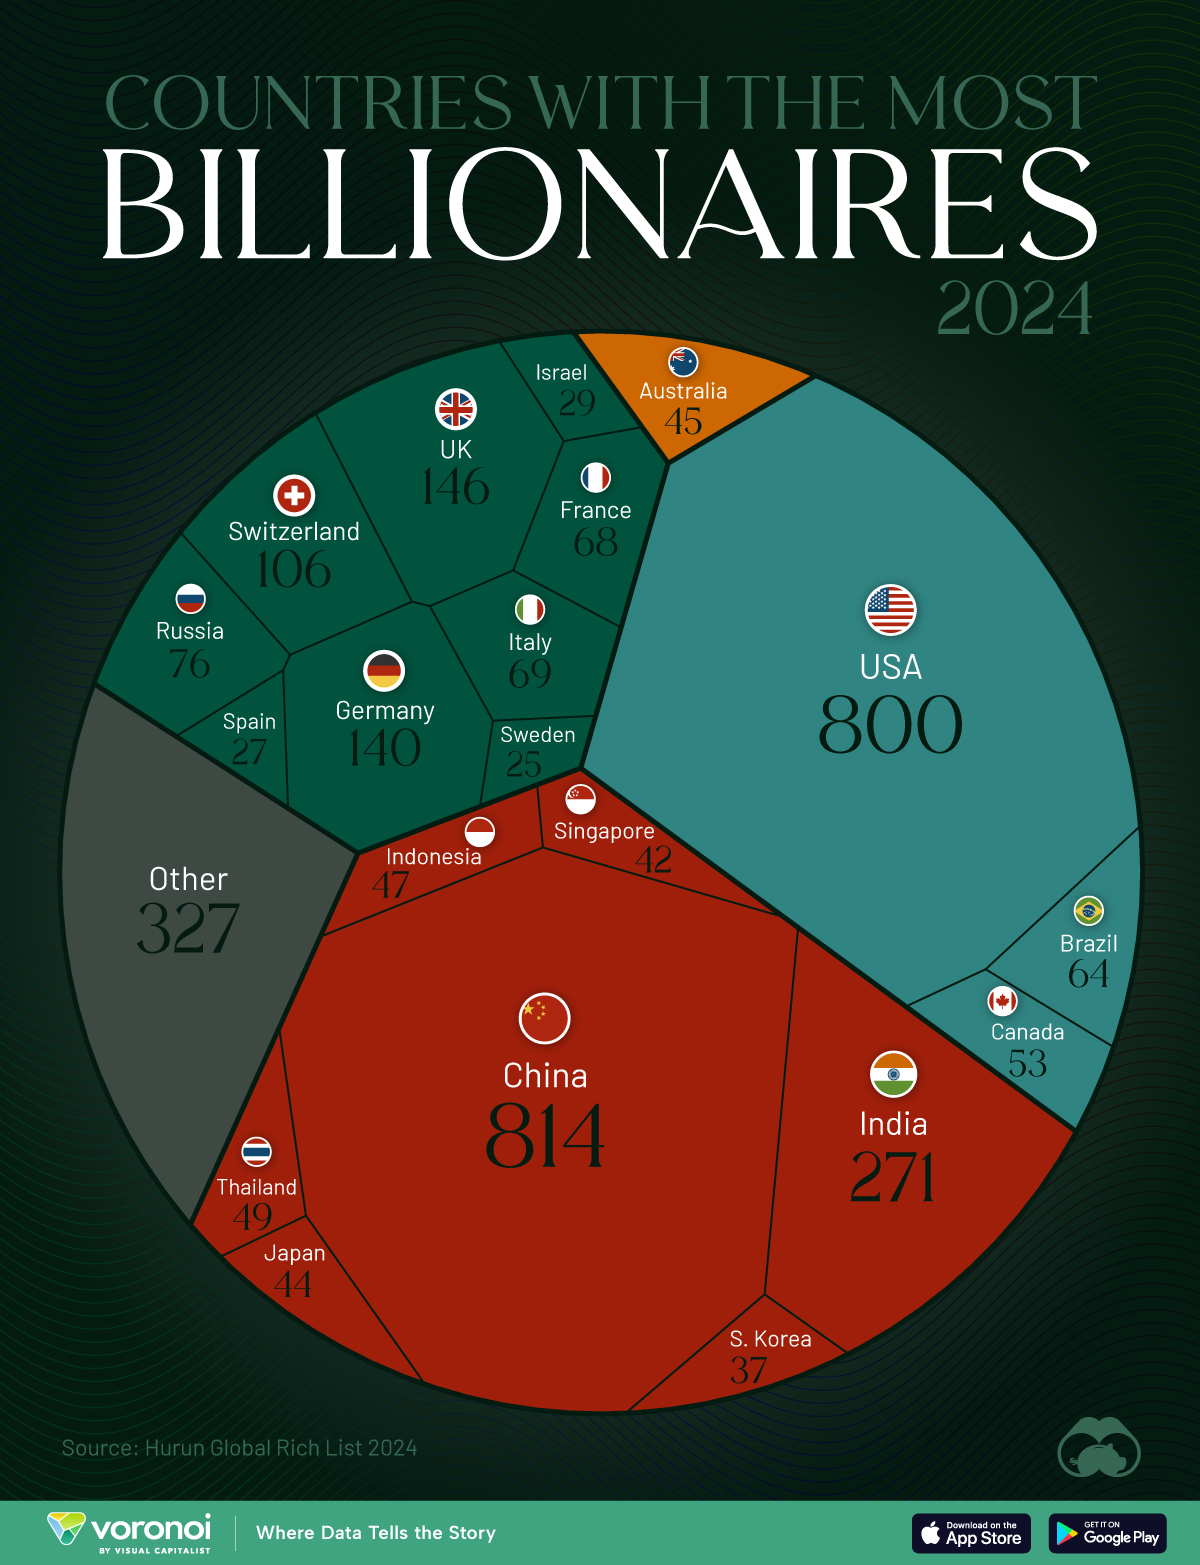
According to the annual Hurun Global Rich List, the U.S. and China are home to nearly half of the world’s 3,279 billionaires in 2024.
Charted: Which Country Has the Most Billionaires in 2024?
This was originally posted on our Voronoi app. Download the app for free on iOS or Android and discover incredible data-driven charts from a variety of trusted sources.
The world has always had people with incredible wealth: from Roman emperors to John D. Rockefeller who became the world’s first billionaire in measurable dollars. But where do the very wealthiest people live right now?
We visualize the countries with the most billionaires in 2024, sourced from the annual Hurun Global Rich list. A country and city aggregate is also available here.
A caveat to this data. Total wealth estimates are notoriously difficult to get right, and different sources can vary in their billionaire data. For example, Forbes, switches ranks for the U.S. and China, though the overall top three remain the same.
Forbes also has Bernard Arnault as the current richest individual, while Hurun places Elon Musk atop the ranks. Nevertheless, their overall top 10 is similar with a few ranking differences.
Ranked: Countries with the Most Billionaires in 2024
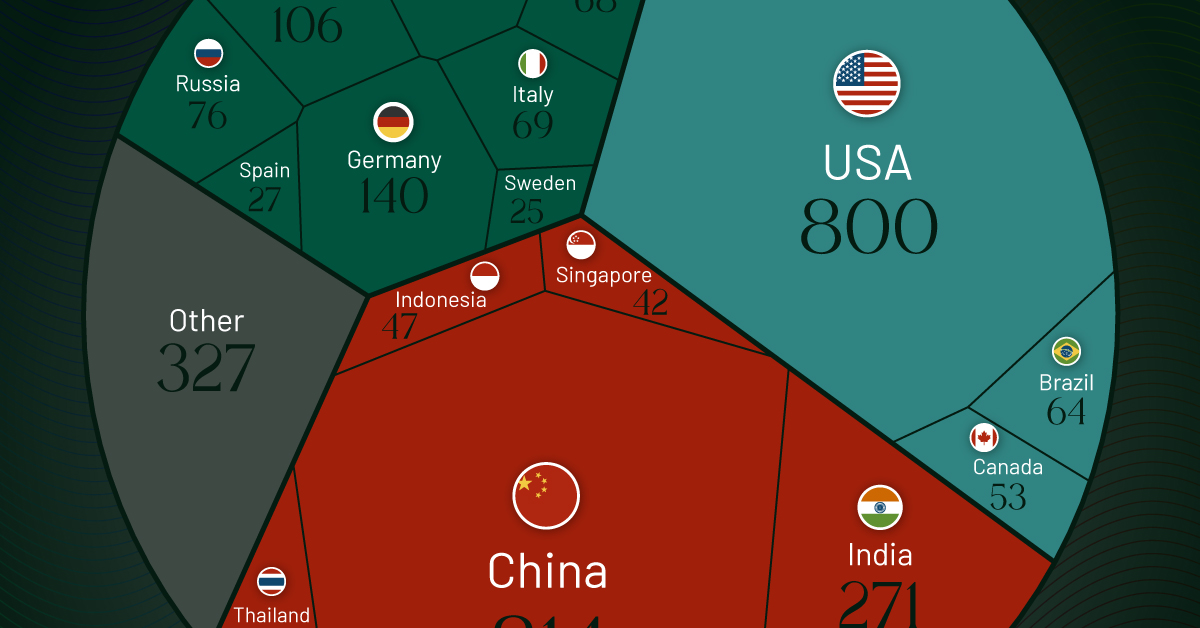
China has 814 billionaires, the most in the world, according to the Hurun Global Rich List 2024. Despite holding on to the top spot, China lost 155 billionaires year-over-year, while the U.S. gained 109. The gap between the two countries has now reduced to just 14 billionaires.
| Rank | Country | Billionaires | Change YoY |
|---|---|---|---|
| 1 | 🇨🇳 China | 814 | -155 |
| 2 | 🇺🇸 U.S. | 800 | +109 |
| 3 | 🇮🇳 India | 271 | +84 |
| 4 | 🇬🇧 UK | 146 | +12 |
| 5 | 🇩🇪 Germany | 140 | -4 |
| 6 | 🇨🇭 Switzerland | 106 | +6 |
| 7 | 🇷🇺 Russia | 76 | +6 |
| 8 | 🇮🇹 Italy | 69 | +11 |
| 9 | 🇫🇷 France | 68 | -4 |
| 10 | 🇧🇷 Brazil | 64 | +13 |
| 11 | 🇨🇦 Canada | 53 | +8 |
| 12 | 🇹🇭 Thailand | 49 | +3 |
| 13 | 🇮🇩 Indonesia | 47 | +12 |
| 14 | 🇦🇺 Australia | 45 | 0 |
| 15 | 🇯🇵 Japan | 44 | +12 |
| 16 | 🇸🇬 Singapore | 42 | +5 |
| 17 | 🇰🇷 South Korea | 37 | +4 |
| 18 | 🇮🇱 Israel | 29 | +9 |
| 19 | 🇪🇸 Spain | 27 | +1 |
| 20 | 🇸🇪 Sweden | 25 | -2 |
| N/A | 🌍 Other | 327 | N/A |
Together, the U.S. and China account for nearly half of the 3,279 billionaires globally, leagues ahead of closest peers, #3 India (271) and #4 UK (146).
Collectively however, European countries account for six of the top 10 and eight of the top 20 countries with the most billionaires.
Naturally, the world’s largest economies tend to be overrepresented on billionaire counts, as they provide more opportunities for wealth creation.
Switzerland, Singapore, and Sweden are outliers in this regard, with only one of them making the top 20 economies by total gross domestic product.
All three countries are perceived to have high tax rates, generally not conducive to amassing wealth. But perceptions can be misleading. Sweden, for example, has no inheritance tax, a flat rate on capital gains, and a corporate tax rate at 21%.

-

 Lithium7 days ago
Ranked: The Top 10 EV Battery Manufacturers in 2023
-

 Green2 weeks ago
Top Countries By Forest Growth Since 2001
-

 United States2 weeks ago
Ranked: The Largest U.S. Corporations by Number of Employees
-

 Maps2 weeks ago
The Largest Earthquakes in the New York Area (1970-2024)
-

 Green2 weeks ago
Ranked: The Countries With the Most Air Pollution in 2023
-

 Green2 weeks ago
Ranking the Top 15 Countries by Carbon Tax Revenue
-

 Markets2 weeks ago
U.S. Debt Interest Payments Reach $1 Trillion
-

 Mining2 weeks ago
Gold vs. S&P 500: Which Has Grown More Over Five Years?