Money
Visualizing the Global Millionaire Population
Visualizing the Global Millionaire Population
A look at wealth by region, fortune size, and city
The Chart of the Week is a weekly Visual Capitalist feature on Fridays.
When we think of the term “millionaire”, it’s only natural for our thoughts to be skewed towards the famous business magnates that have amassed giant fortunes, like Jeff Bezos, Elon Musk, or Warren Buffett.
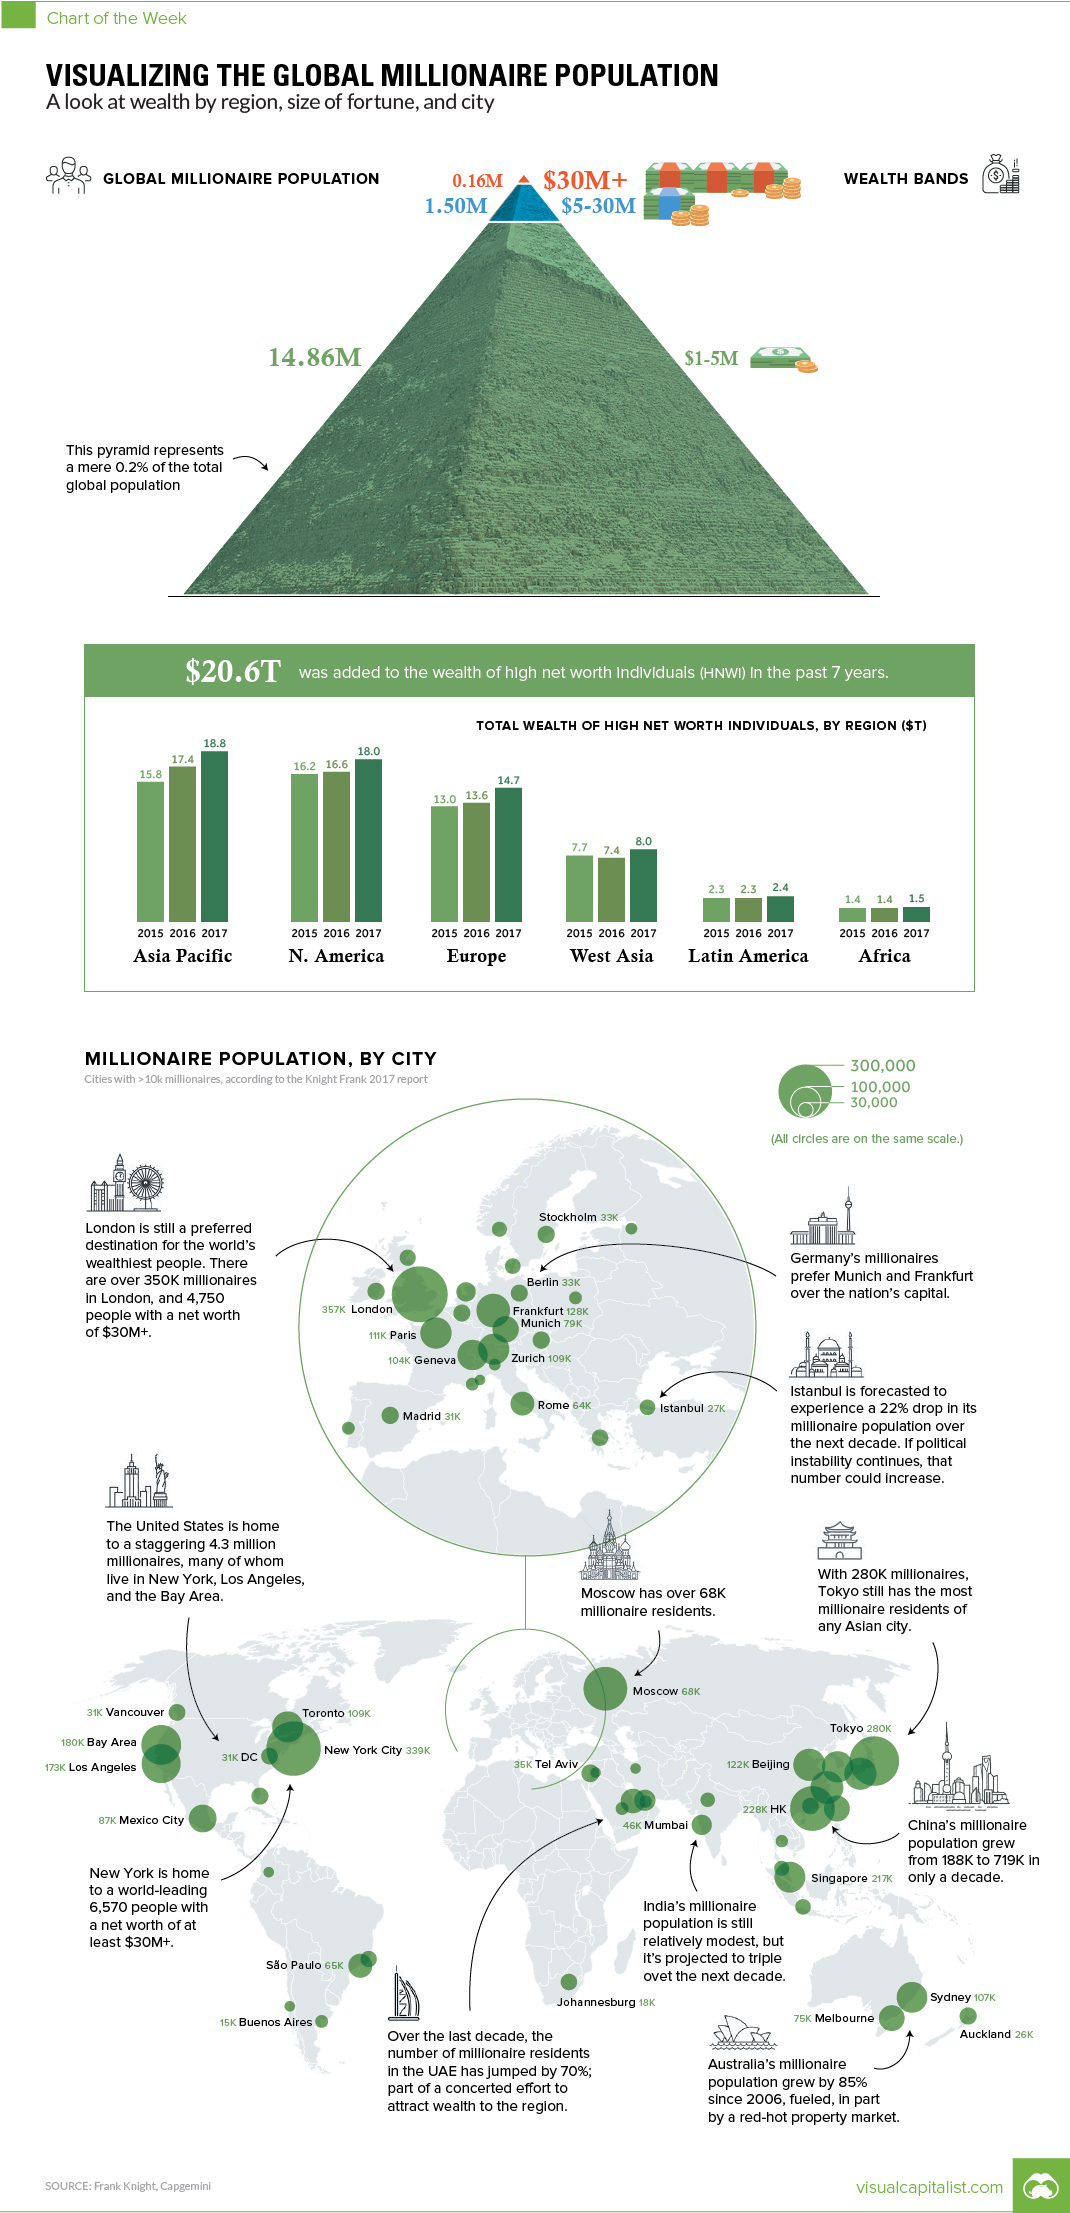
However, the reality is that those types of ultra high net worth individuals (UHNWIs) with fortunes above $30 million are a fairly rare commodity – and when it’s all said and done, they make up a very tiny percentage of the millionaire population as a whole.
| Fortune Size | Number (Globally) | % of Millionaire Population |
|---|---|---|
| $30+ mm | 160,000 | 1.0% |
| $5mm - $30mm | 1,500,000 | 9.1% |
| $1mm - $5mm | 14,860,000 | 90.0% |
The vast majority of millionaires (90.0%) globally have fortunes between $1 million and $5 million, and you’re probably not going to find many of them with a sprawling mansion or a new Rolls Royce in the garage.
In fact, most millionaires drive a Ford.
Local Millionaires
So where will you find all of the world’s millionaires?
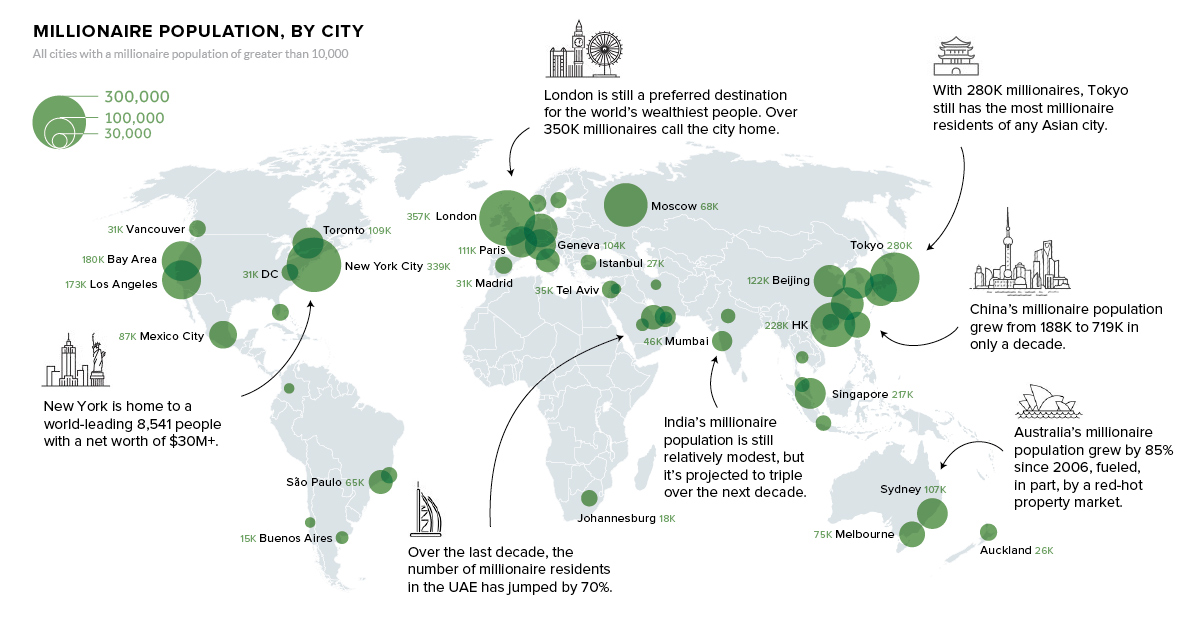
They are most likely to be found in big cities – places where they can use and display their wealth. These are also the places where big opportunities tend to be found, so it’s no surprise to see millionaires cluster in world-class cities like New York, Hong Kong, London, Tokyo, or Singapore.
Regions below are sorted by the total millionaires in each city. Data comes from the Knight Frank 2017 report.
Top Cities in Asia
| Rank (Asia) | City | Country | # of Millionaires |
|---|---|---|---|
| #1 | Tokyo | Japan | 279,800 |
| #2 | Hong Kong | Hong Kong | 227,900 |
| #3 | Singapore | Singapore | 217,300 |
| #4 | Beijing | China | 122,100 |
| #5 | Osaka | Japan | 117,700 |
| #6 | Shanghai | China | 117,600 |
| #7 | Seoul | South Korea | 108,100 |
| #8 | Taipei | Taiwan | 76,700 |
| #9 | Mumbai | India | 46,100 |
| #10 | Shenzhen | China | 31,400 |
Tokyo, Hong Kong, and Singapore are the undisputed millionaire population capitals in Asia, but mainland China is coming up quick from behind.
In just the last 10 years, China has upped its millionaire count by 281% to 719,400 in total – and Beijing (with 122,100 millionaires) now cracks the top five list in Asia.
Top Cities in Oceania
| Rank (Oceania) | City | City | # of Millionaires |
|---|---|---|---|
| #1 | Sydney | Australia | 106,800 |
| #2 | Melbourne | Australia | 74,800 |
| #3 | Auckland | New Zealand | 25,600 |
Australia’s millionaire count has soared 85% over the last 10 years, thanks in part to red-hot property prices.
Top Cities in Europe
| Rank (Europe) | City | Country | # of Millionaires |
|---|---|---|---|
| #1 | London | UK | 357,200 |
| #2 | Frankfurt | Germany | 128,300 |
| #3 | Paris | France | 110,900 |
| #4 | Zurich | Switzerland | 109,200 |
| #5 | Geneva | Switzerland | 104,300 |
| #6 | Munich | Germany | 78,900 |
| #7 | Moscow | Russia | 68,200 |
| #8 | Rome | Italy | 64,300 |
| #9 | Amsterdam | Netherlands | 42,600 |
| #10 | Brussels | Belgium | 34,700 |
London is the millionaire capital for the world, with 357,200 of them.
Despite its relatively small size in comparison to the European heavyweights, Switzerland also has two cities in the top five: Geneva and Zurich.
Top Cities in the Middle East
| Rank (Middle East) | City | Country | # of Millionaires |
|---|---|---|---|
| #1 | Dubai | UAE | 50,400 |
| #2 | Tel Aviv | Israel | 35,200 |
| #3 | Istanbul | Turkey | 27,300 |
| #4 | Doha | Qatar | 25,800 |
| #5 | Abu Dhabi | UAE | 17,100 |
| #6 | Riyadh | Saudi Arabia | 16,200 |
| #7 | Tehran | Iran | 14,000 |
| #8 | Jerusalem | Israel | 13,100 |
Not surprisingly, Dubai is the biggest destination for the ultra-rich to flock to in the Middle East.
Top Cities in Latin America
| Rank (Latin America) | City | Country | # of Millionaires |
|---|---|---|---|
| #1 | Mexico City | Mexico | 86,700 |
| #2 | São Paulo | Brazil | 64,500 |
| #3 | Rio de Janeiro | Brazil | 35,300 |
| #4 | Buenos Aires | Argentina | 15,400 |
| #5 | Bogota | Colombia | 14,900 |
| #6 | Santiago | Chile | 10,800 |
Mexico City, and then the two big ones in Brazil (São Paulo and Rio), are where millionaires congregate in Latin America.
Top Cities in North America
| Rank (North America) | City | Country | # of Millionaires |
|---|---|---|---|
| #1 | New York City | USA | 339,200 |
| #2 | Bay Area | USA | 180,300 |
| #3 | Los Angeles | USA | 173,300 |
| #4 | Toronto | Canada | 109,300 |
| #5 | Miami | USA | 31,600 |
| #6 | Washington D.C. | USA | 31,200 |
| #7 | Vancouver | Canada | 31,100 |
The U.S. has 4.3 million millionaires, and they are widely dispersed through the country.
The Knight Frank 2017 report lists five cities: NYC, Washington, D.C., San Francisco (incl. Bay Area), Los Angeles, and Miami – all of which, according to their calculations, have more than 30k millionaires.
Canada’s Toronto also has broken the six-digit barrier with over 100,000 millionaires. That puts the Big Smoke in pretty unique company, as only 17 cities globally can make such a claim.


Money
Charted: Who Has Savings in This Economy?
Older, better-educated adults are winning the savings game, reveals a January survey by the National Opinion Research Center at the University of Chicago.


Who Has Savings in This Economy?
This was originally posted on our Voronoi app. Download the app for free on iOS or Android and discover incredible data-driven charts from a variety of trusted sources.
Two full years of inflation have taken their toll on American households. In 2023, the country’s collective credit card debt crossed $1 trillion for the first time. So who is managing to save money in the current economic environment?
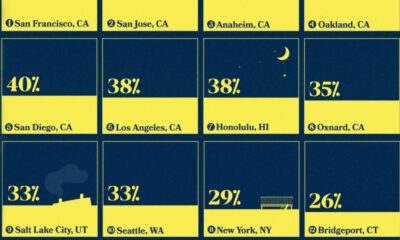
We visualize the percentage of respondents to the statement “I have money leftover at the end of the month” categorized by age and education qualifications. Data is sourced from a National Endowment for Financial Education (NEFE) report, published last month.
The survey for NEFE was conducted from January 12-14, 2024, by the National Opinion Research Center at the University of Chicago. It involved 1,222 adults aged 18+ and aimed to be representative of the U.S. population.
Older Americans Save More Than Their Younger Counterparts
General trends from this dataset indicate that as respondents get older, a higher percentage of them are able to save.
| Age | Always/Often | Sometimes | Rarely/Never |
|---|---|---|---|
| 18–29 | 29% | 33% | 38% |
| 30–44 | 36% | 27% | 37% |
| 45–59 | 39% | 23% | 38% |
| Above 60 | 49% | 28% | 23% |
| All Adults | 39% | 33% | 27% |
Note: Percentages are rounded and may not sum to 100.
Perhaps not surprisingly, those aged 60+ are the age group with the highest percentage saying they have leftover money at the end of the month. This age group spent the most time making peak earnings in their careers, are more likely to have investments, and are more likely to have paid off major expenses like a mortgage or raising a family.
The Impact of Higher Education on Earnings and Savings
Based on this survey, higher education dramatically improves one’s ability to save. Shown in the table below, those with a bachelor’s degree or higher are three times more likely to have leftover money than those without a high school diploma.
| Education | Always/Often | Sometimes | Rarely/Never |
|---|---|---|---|
| No HS Diploma | 18% | 26% | 56% |
| HS Diploma | 28% | 33% | 39% |
| Associate Degree | 33% | 31% | 36% |
| Bachelor/Higher Degree | 59% | 21% | 20% |
| All Adults | 39% | 33% | 27% |
Note: Percentages are rounded and may not sum to 100.
As the Bureau of Labor Statistics notes, earnings improve with every level of education completed.
For example, those with a high school diploma made 25% more than those without in 2022. And as the qualifications increase, the effects keep stacking.
Meanwhile, a Federal Reserve study also found that those with more education tended to make financial decisions that contributed to building wealth, of which the first step is to save.

-

 Maps1 week ago
The Largest Earthquakes in the New York Area (1970-2024)
-

 Money2 weeks ago
Where Does One U.S. Tax Dollar Go?
-

 Automotive2 weeks ago
Almost Every EV Stock is Down After Q1 2024
-

 AI2 weeks ago
The Stock Performance of U.S. Chipmakers So Far in 2024
-

 Markets2 weeks ago
Charted: Big Four Market Share by S&P 500 Audits
-

 Real Estate2 weeks ago
Ranked: The Most Valuable Housing Markets in America
-

 Money2 weeks ago
Which States Have the Highest Minimum Wage in America?
-

 AI2 weeks ago
Ranked: Semiconductor Companies by Industry Revenue Share