Markets
The 20 Biggest Bankruptcies in U.S. History
Doing business means taking calculated risks.
Regardless of whether you are opening a lemonade stand or you’re a leading executive at a Fortune 500 company, risk is an inevitable part of the game.
Taking bigger risks can generate proportional rewards – and sometimes, such as for the companies you’ll read about below, the risk-taking backfired to queue up some of the biggest bankruptcies in U.S. history.
Going For Broke
Today’s infographic comes to us from TitleMax, and it highlights the 20 biggest bankruptcies in the country’s history.
Companies below are sorted by total assets at the time of bankruptcy.
There are times when companies are forced to push in all of their chips to make a game-changing bet. Sometimes this pans out, and sometimes the plan fails miserably.
In other situations, companies were actually unaware they were “all-in”. Instead, the potentially destructive nature of the risk was not even on the radar, only to be later triggered through a global crisis or unanticipated “Black Swan” events.
The Biggest Bankruptcies in the U.S.
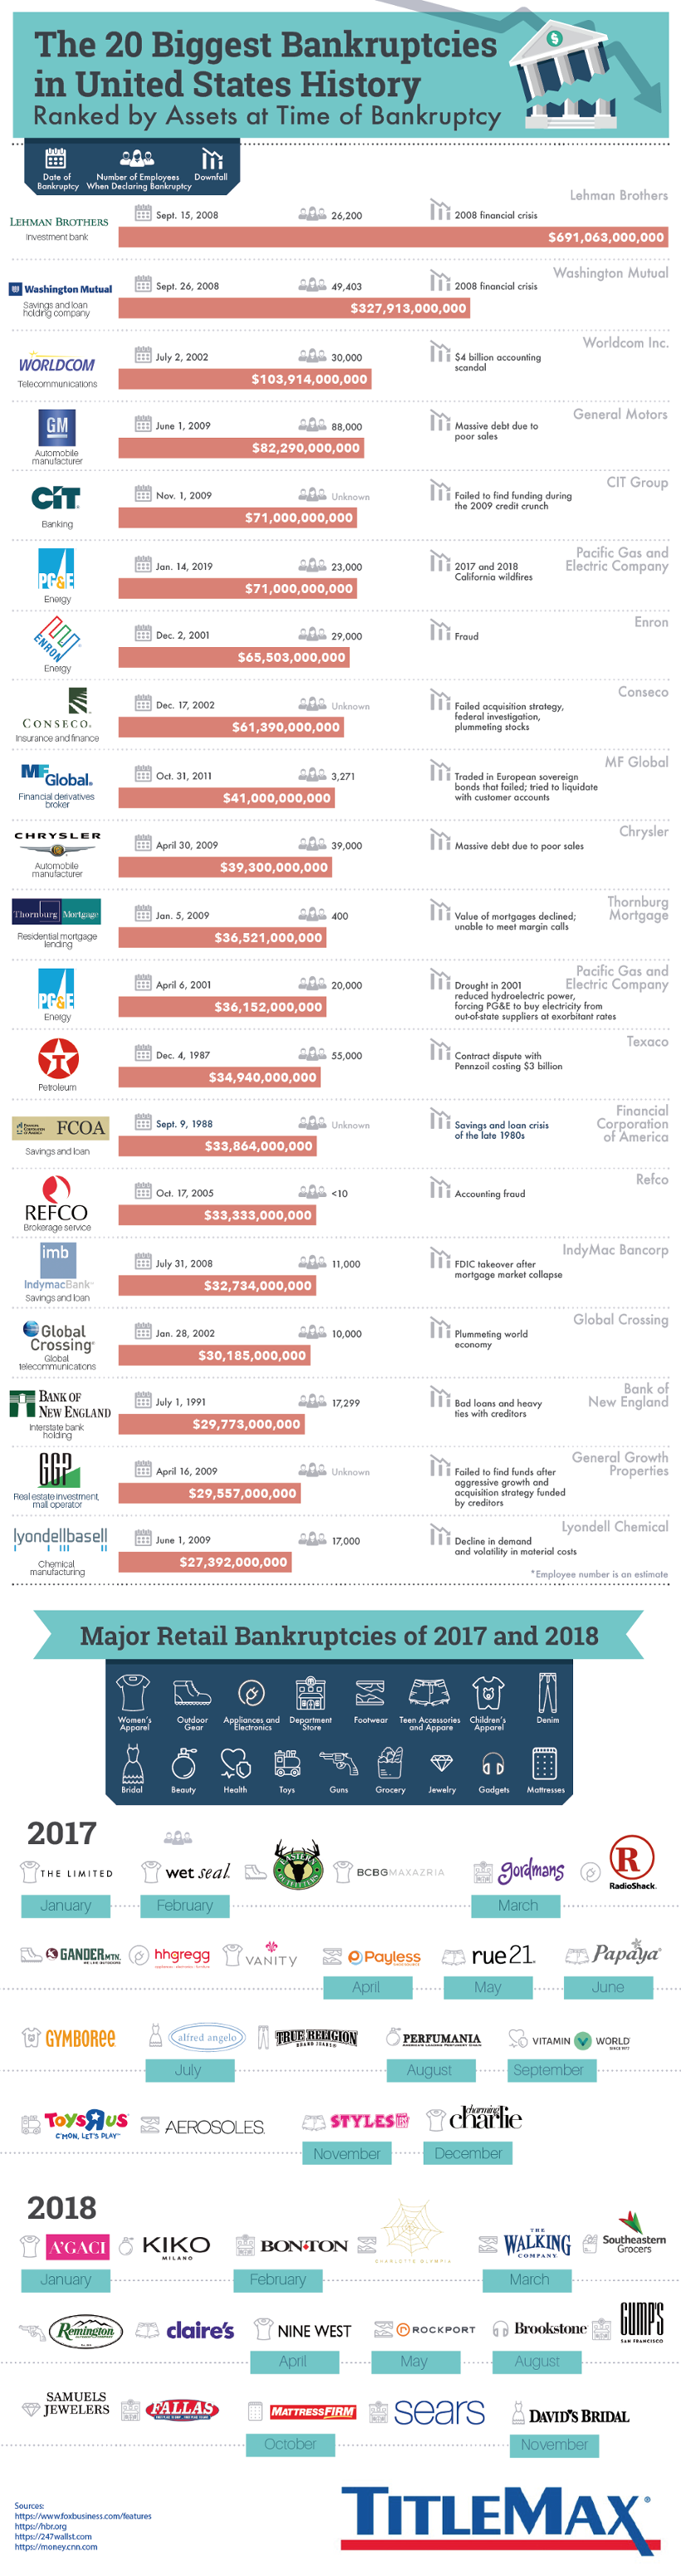
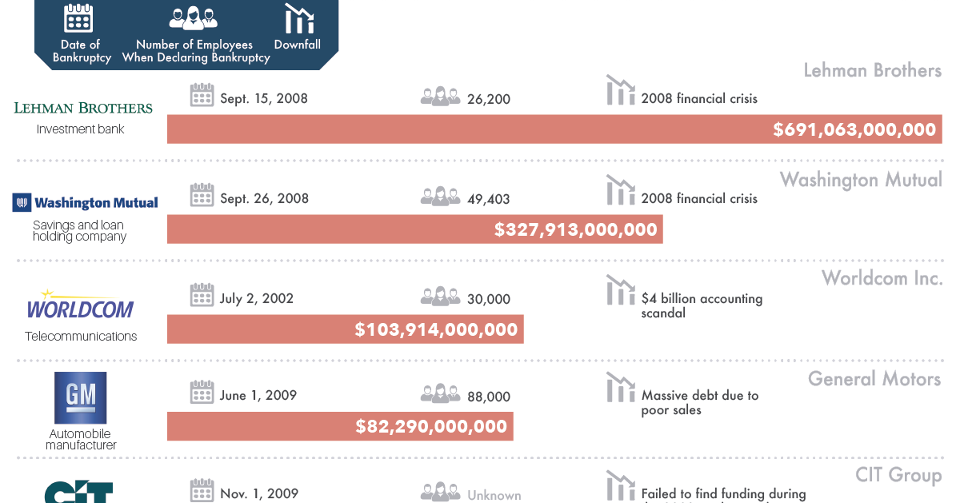
Here are the 20 biggest bankruptcies in U.S. history, and what triggered them:
| Rank | Company | Year | Assets at Bankruptcy | Downfall |
|---|---|---|---|---|
| #1 | Lehman Brothers | 2008 | $691 billion | 2008 financial crisis |
| #2 | Washington Mutual | 2008 | $328 billion | 2008 financial crisis |
| #3 | Worldcom Inc. | 2002 | $104 billion | Accounting scandal |
| #4 | GM | 2009 | $82 billion | Massive debt |
| #5 | CIT Group | 2009 | $71 billion | Credit crunch |
| #6 | Pacific Gas & Electric | 2019 | $71 billion | Wildfires |
| #7 | Enron | 2001 | $66 billion | Fraud |
| #8 | Conseco | 2002 | $61 billion | Failed acquisition strategy |
| #9 | MF Global | 2011 | $41 billion | European sovereign bonds |
| #10 | Chrysler | 2009 | $39 billion | Massive debt |
| #11 | Thornburg Mortgage | 2009 | $37 billion | Declining mortgage values |
| #12 | Pacific Gas & Electric | 2001 | $36 billion | Drought |
| #13 | Texaco | 1987 | $35 billion | Contract dispute |
| #14 | FCOA | 1988 | $34 billion | Savings and loan crisis |
| #15 | Refco | 2005 | $33 billion | Accounting fraud |
| #16 | IndyMac Bancorp | 2008 | $33 billion | Mortgage market collapse |
| #17 | Global Crossing | 2002 | $30 billion | Plummeting world economy |
| #18 | Bank of New England | 1991 | $30 billion | Bad loans |
| #19 | General Growth Properties | 2009 | $30 billion | Failed acquisition strategy |
| #20 | Lyondell Chemical | 2009 | $27 billion | Decline in demand |
The data set on the biggest bankruptcies is organized by assets at time of bankruptcy. Therefore, they are not in inflation-adjusted terms, meaning the list skews towards more recent events.
This makes the impact of the 2008 financial crisis particularly easy to spot.
The events and consequences relating to the crisis (loan defaults, illiquidity, and declining asset values) were enough to take down banks like Lehman Brothers and WaMu. The after effects – including a slumping global economy – led to a second wave of bankruptcies for companies such as GM and Chrysler.
In total, nine of the 20 biggest bankruptcies on the list occurred in the 2008-2009 span.
A Dubious Distinction
You may also notice that one company was on the list twice, and this was not an accident.
Pacific Gas & Electric, a California company that is the nation’s largest utility provider, has the dubious distinction of going bankrupt twice in the last 20 years. The first time, in 2001, resulted from a drought that limited hydro electricity generation, forcing the company to import electricity from outside sources at exorbitant prices.
The more recent instance happened earlier this year. Facing tens of billions of dollars in liabilities from raging wildfires in California, the utility filed for Chapter 11 protection yet another time.


Markets
The European Stock Market: Attractive Valuations Offer Opportunities
On average, the European stock market has valuations that are nearly 50% lower than U.S. valuations. But how can you access the market?


European Stock Market: Attractive Valuations Offer Opportunities
Europe is known for some established brands, from L’Oréal to Louis Vuitton. However, the European stock market offers additional opportunities that may be lesser known.
The above infographic, sponsored by STOXX, outlines why investors may want to consider European stocks.
Attractive Valuations
Compared to most North American and Asian markets, European stocks offer lower or comparable valuations.
| Index | Price-to-Earnings Ratio | Price-to-Book Ratio |
|---|---|---|
| EURO STOXX 50 | 14.9 | 2.2 |
| STOXX Europe 600 | 14.4 | 2 |
| U.S. | 25.9 | 4.7 |
| Canada | 16.1 | 1.8 |
| Japan | 15.4 | 1.6 |
| Asia Pacific ex. China | 17.1 | 1.8 |
Data as of February 29, 2024. See graphic for full index names. Ratios based on trailing 12 month financials. The price to earnings ratio excludes companies with negative earnings.
On average, European valuations are nearly 50% lower than U.S. valuations, potentially offering an affordable entry point for investors.
Research also shows that lower price ratios have historically led to higher long-term returns.
Market Movements Not Closely Connected
Over the last decade, the European stock market had low-to-moderate correlation with North American and Asian equities.
The below chart shows correlations from February 2014 to February 2024. A value closer to zero indicates low correlation, while a value of one would indicate that two regions are moving in perfect unison.
| EURO STOXX 50 | STOXX EUROPE 600 | U.S. | Canada | Japan | Asia Pacific ex. China |
|
|---|---|---|---|---|---|---|
| EURO STOXX 50 | 1.00 | 0.97 | 0.55 | 0.67 | 0.24 | 0.43 |
| STOXX EUROPE 600 | 1.00 | 0.56 | 0.71 | 0.28 | 0.48 | |
| U.S. | 1.00 | 0.73 | 0.12 | 0.25 | ||
| Canada | 1.00 | 0.22 | 0.40 | |||
| Japan | 1.00 | 0.88 | ||||
| Asia Pacific ex. China | 1.00 |
Data is based on daily USD returns.
European equities had relatively independent market movements from North American and Asian markets. One contributing factor could be the differing sector weights in each market. For instance, technology makes up a quarter of the U.S. market, but health care and industrials dominate the broader European market.
Ultimately, European equities can enhance portfolio diversification and have the potential to mitigate risk for investors.
Tracking the Market
For investors interested in European equities, STOXX offers a variety of flagship indices:
| Index | Description | Market Cap |
|---|---|---|
| STOXX Europe 600 | Pan-regional, broad market | €10.5T |
| STOXX Developed Europe | Pan-regional, broad-market | €9.9T |
| STOXX Europe 600 ESG-X | Pan-regional, broad market, sustainability focus | €9.7T |
| STOXX Europe 50 | Pan-regional, blue-chip | €5.1T |
| EURO STOXX 50 | Eurozone, blue-chip | €3.5T |
Data is as of February 29, 2024. Market cap is free float, which represents the shares that are readily available for public trading on stock exchanges.
The EURO STOXX 50 tracks the Eurozone’s biggest and most traded companies. It also underlies one of the world’s largest ranges of ETFs and mutual funds. As of November 2023, there were €27.3 billion in ETFs and €23.5B in mutual fund assets under management tracking the index.
“For the past 25 years, the EURO STOXX 50 has served as an accurate, reliable and tradable representation of the Eurozone equity market.”
— Axel Lomholt, General Manager at STOXX
Partnering with STOXX to Track the European Stock Market
Are you interested in European equities? STOXX can be a valuable partner:
- Comprehensive, liquid and investable ecosystem
- European heritage, global reach
- Highly sophisticated customization capabilities
- Open architecture approach to using data
- Close partnerships with clients
- Part of ISS STOXX and Deutsche Börse Group
With a full suite of indices, STOXX can help you benchmark against the European stock market.
Learn how STOXX’s European indices offer liquid and effective market access.

-

 Economy2 days ago
Economic Growth Forecasts for G7 and BRICS Countries in 2024
The IMF has released its economic growth forecasts for 2024. How do the G7 and BRICS countries compare?
-

 Markets1 week ago
U.S. Debt Interest Payments Reach $1 Trillion
U.S. debt interest payments have surged past the $1 trillion dollar mark, amid high interest rates and an ever-expanding debt burden.
-

 United States2 weeks ago
Ranked: The Largest U.S. Corporations by Number of Employees
We visualized the top U.S. companies by employees, revealing the massive scale of retailers like Walmart, Target, and Home Depot.
-

 Markets2 weeks ago
The Top 10 States by Real GDP Growth in 2023
This graphic shows the states with the highest real GDP growth rate in 2023, largely propelled by the oil and gas boom.
-

 Markets2 weeks ago
Ranked: The World’s Top Flight Routes, by Revenue
In this graphic, we show the highest earning flight routes globally as air travel continued to rebound in 2023.
-

 Markets2 weeks ago
Ranked: The Most Valuable Housing Markets in America
The U.S. residential real estate market is worth a staggering $47.5 trillion. Here are the most valuable housing markets in the country.


-

 Energy1 week ago
The World’s Biggest Nuclear Energy Producers
-

 Money2 weeks ago
Which States Have the Highest Minimum Wage in America?
-

 Technology2 weeks ago
Ranked: Semiconductor Companies by Industry Revenue Share
-
Markets2 weeks ago
Ranked: The World’s Top Flight Routes, by Revenue
-

 Demographics2 weeks ago
Population Projections: The World’s 6 Largest Countries in 2075
-
Markets2 weeks ago
The Top 10 States by Real GDP Growth in 2023
-

 Demographics2 weeks ago
The Smallest Gender Wage Gaps in OECD Countries
-

 Economy2 weeks ago
Where U.S. Inflation Hit the Hardest in March 2024