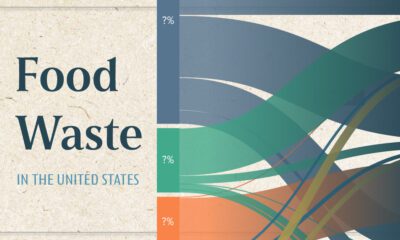

This chart visualizes the flow of the 80 millions tons of food waste in the United States in 2021, using data from ReFED.
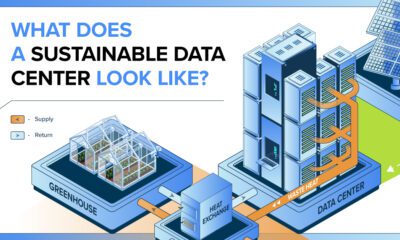

Data centers produce a staggering amount of heat, but what if instead of treating it as waste, we could harness it instead?


Which foods are linked with high CO2 emissions and high water use? We look at the environmental impacts of food production in this chart.
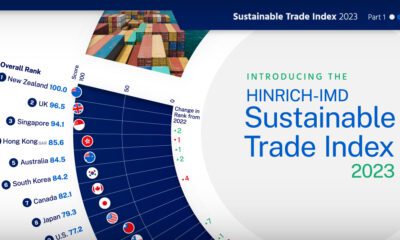

The Sustainable Trade Index 2023 is an annual ranking of the world's most sustainable economies. View this infographic to see the results.
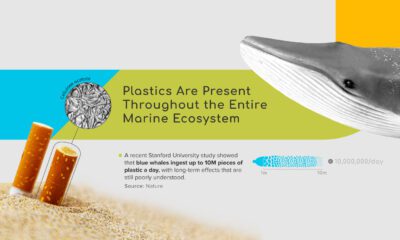

Around 80% of the 6 trillion cigarettes produced annually are littered, and many of those end up in oceans, adding to the plastic problem.
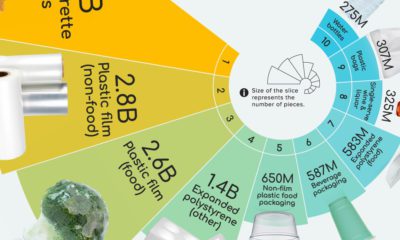

Plastic waste can now be found everywhere on Earth, from the highest peaks to the deepest seas, but what is the most littered item in the...
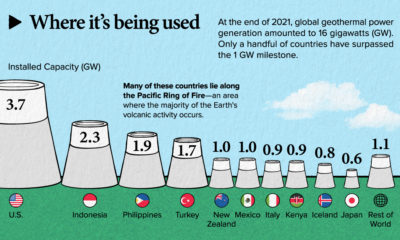

This infographic teaches you everything you need to know about geothermal energy in less than 5 minutes.
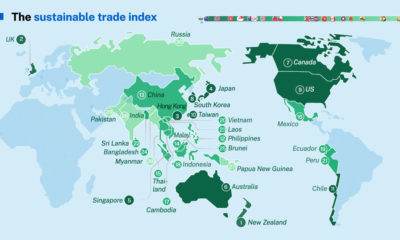

See which economies have the most sustainable trade policies in the Hinrich Foundation's 2022 Sustainable Trade Index.
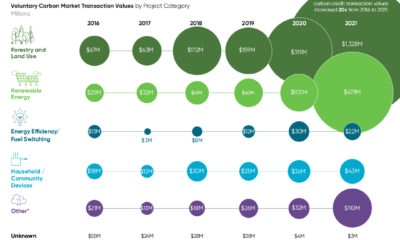

Carbon credits from nature-based solutions are in high demand as organizations look to shrink their carbon footprints.
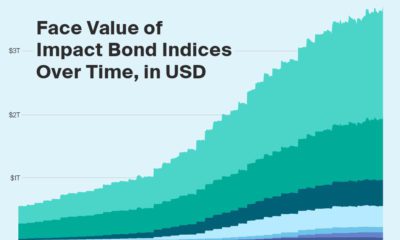

The face value of impact bond indices jumped by nearly 500% from 2018 to 2021. How do various types of sustainability indices help investors?


 Creator Program