Green
North America’s Devastating Wildfires, Viewed From Space
North America’s Devastating Wildfires, Viewed From Space
If you live on the west coast of North America, it’s likely that you’ve felt a bit smoked out, lately.
Wildfires in British Columbia, Canada are already the worst in the province’s history, while California has had a particularly rough season with human deaths, evacuations, and billions of dollars of damage.
Oregon has one confirmed death from a wildfire in mid-July, and Washington hasn’t gotten off easy, either. On July 31, 2018 a state of emergency was declared in the Evergreen State.
Visualizing Wildfires From Space
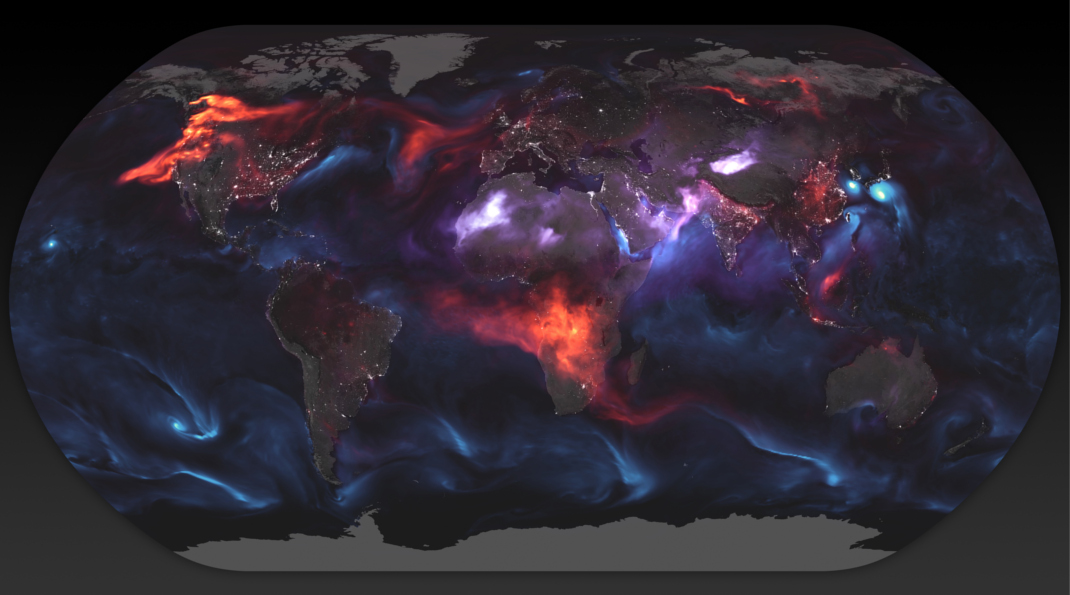
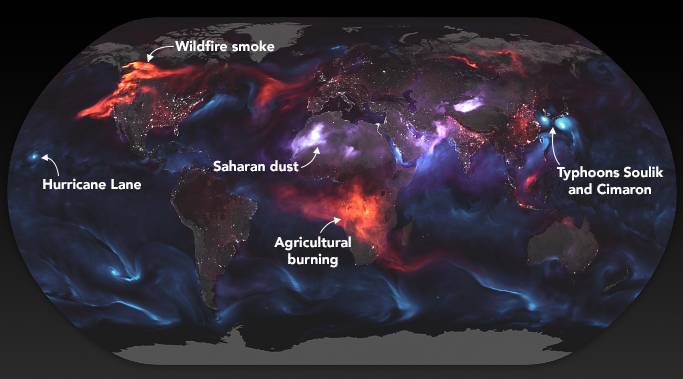
Today’s image comes to us from NASA, and it shows aerosols around the world including those originating from volcanoes, desert dust, cloud cover, sea-salt – and of course, smoke.
Here’s the same image with labels, indicating black carbon on the west coast of the continent:
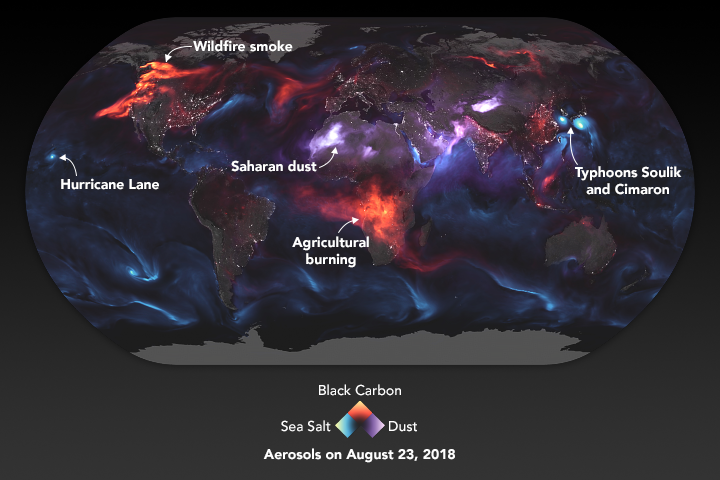
The wildfires are just as visible as the massive slash-and-burning occurring in Central Africa, hurricanes and typhoons, and even the dust swirling up from the Sahara, the world’s largest desert.
Here’s a visualization of the fires in North America, with some extra zoom:
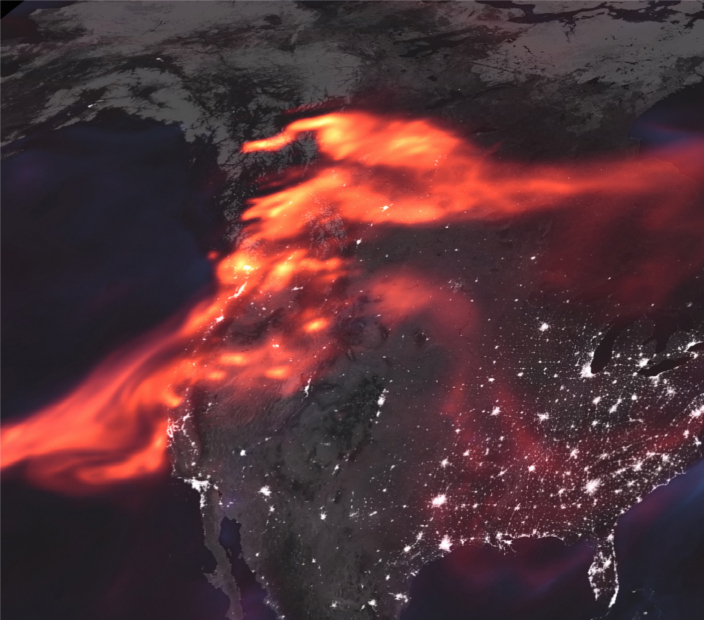
It’s clear from this image that smoke isn’t just affecting the coast – in fact, experts say it has been travelling as far as Ireland, in lesser concentrations of course.
Other Visuals
While we thought the visualization above was the most striking, there are countless of other examples from the last month that show the extent of wildfires and smoke on the west coast.
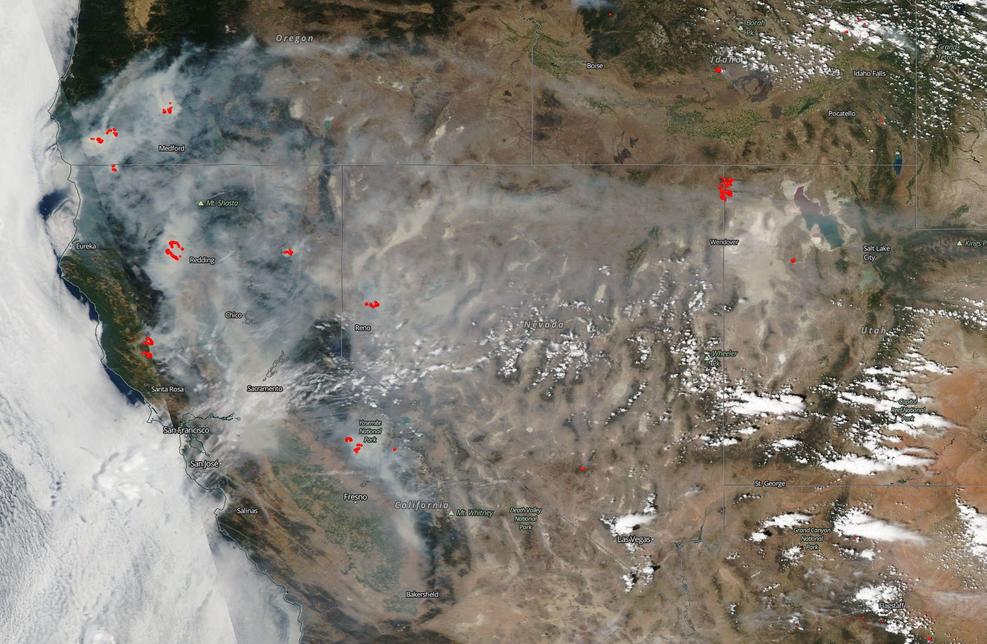
Here’s another shot from NASA from a few weeks ago, during peak wildfire season in California and Oregon:
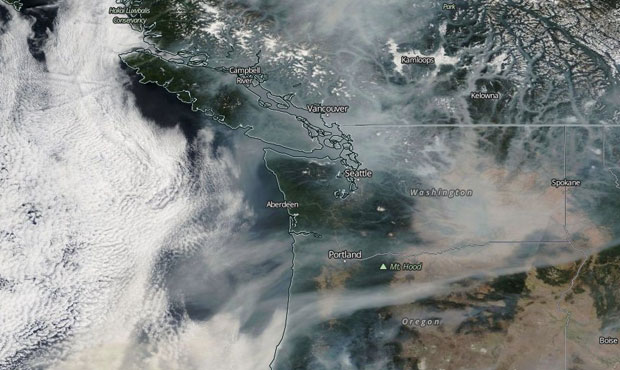
And here’s an image of Seattle and Vancouver from mid-August, when smoke from Canadian fires was so bad in those cities that it was like “inhaling seven cigarettes” per day:
Future Forecast
As we roll into September, the worst of the wildfire season is over.
Unfortunately, it’s already been the worst in British Columbia’s history. Here are the 10 worst fire seasons graphed since 1950, based on square kilometers burned:
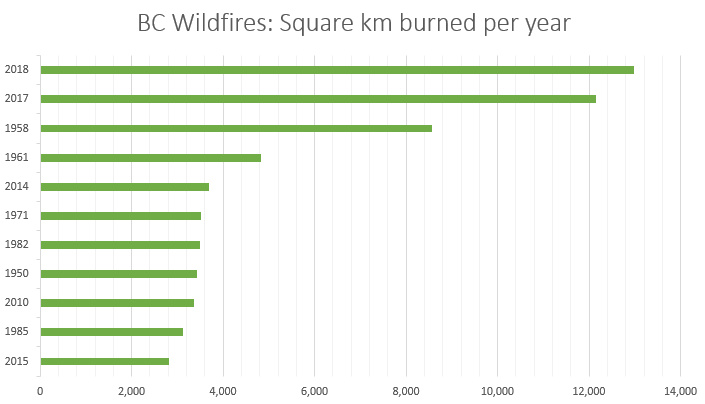
Data as of Aug 29, 2018, and from the BC Forest Service
While this year has been an anomaly, it may also be a preview of what’s to come. One recent report out of California said that the number of wildfires over 25,000 acres is likely to increase by 50% leading up to 2050.
Is this the new normal?


Green
The Carbon Footprint of Major Travel Methods
Going on a cruise ship and flying domestically are the most carbon-intensive travel methods.


The Carbon Footprint of Major Travel Methods
This was originally posted on our Voronoi app. Download the app for free on iOS or Android and discover incredible data-driven charts from a variety of trusted sources.
Did you know that transport accounts for nearly one-quarter of global energy-related carbon dioxide (CO₂) emissions?
This graphic illustrates the carbon footprints of major travel methods measured in grams of carbon dioxide equivalent (CO₂e) emitted per person to travel one kilometer. This includes both CO₂ and other greenhouse gases.
Data is sourced from Our World in Data, the UK Government’s Department for Energy Security and Net Zero, and The International Council on Clean Transportation, as of December 2022.
These figures should be interpreted as approximations, rather than exact numbers. There are many variables at play that determine the actual carbon footprint in any individual case, including vehicle type or model, occupancy, energy mix, and even weather.
Cruise Ships are the Most Carbon-Intensive Travel Method
According to these estimates, taking a cruise ship, flying domestically, and driving alone are some of the most carbon-intensive travel methods.
Cruise ships typically use heavy fuel oil, which is high in carbon content. The average cruise ship weighs between 70,000 to 180,000 metric tons, meaning they require large engines to get moving.
These massive vessels must also generate power for onboard amenities such as lighting, air conditioning, and entertainment systems.
Short-haul flights are also considered carbon-intensive due to the significant amount of fuel consumed during initial takeoff and climbing altitude, relative to a lower amount of cruising.
| Transportation method | CO₂ equivalent emissions per passenger km |
|---|---|
| Cruise Ship | 250 |
| Short-haul flight (i.e. within a U.S. state or European country) | 246 |
| Diesel car | 171 |
| Gas car | 170 |
| Medium-haul flight (i.e. international travel within Europe, or between U.S. states) | 151 |
| Long-haul flight (over 3,700 km, about the distance from LA to NY) | 147 |
| Motorbike | 113 |
| Bus (average) | 96 |
| Plug-in hybrid | 68 |
| Electric car | 47 |
| National rail | 35 |
| Tram | 28 |
| London Underground | 27 |
| Ferry (foot passenger) | 19 |
| Eurostar (International rail) | 4.5 |
Are EVs Greener?
Many experts agree that EVs produce a lower carbon footprint over time versus traditional internal combustion engine (ICE) vehicles.
However, the batteries in electric vehicles charge on the power that comes straight off the electrical grid—which in many places may be powered by fossil fuels. For that reason, the carbon footprint of an EV will depend largely on the blend of electricity sources used for charging.
There are also questions about how energy-intensive it is to build EVs compared to a comparable ICE vehicle.

-

 Lithium6 days ago
Ranked: The Top 10 EV Battery Manufacturers in 2023
-

 Green2 weeks ago
Top Countries By Forest Growth Since 2001
-

 United States2 weeks ago
Ranked: The Largest U.S. Corporations by Number of Employees
-

 Maps2 weeks ago
The Largest Earthquakes in the New York Area (1970-2024)
-

 Green2 weeks ago
Ranked: The Countries With the Most Air Pollution in 2023
-

 Green2 weeks ago
Ranking the Top 15 Countries by Carbon Tax Revenue
-

 Markets2 weeks ago
U.S. Debt Interest Payments Reach $1 Trillion
-

 Mining2 weeks ago
Gold vs. S&P 500: Which Has Grown More Over Five Years?