Markets
The Largest Company in Every State by Revenue
The Largest Company in Every State by Revenue
Pretty much every state has at least one workhorse company that posts a revenue number in the billions.
In a state like California or Texas, these companies tend to be gargantuan in size even from a national or international perspective. Apple ($216 billion) and ExxonMobil ($226 billion) are two prime examples, and they are obviously giant companies by almost any measure.
In other states, the largest company by revenue may fly more under the radar, or be known only on a regional basis. Sometimes these are actually the most interesting types of companies to learn more about.
What’s the largest company in every state?
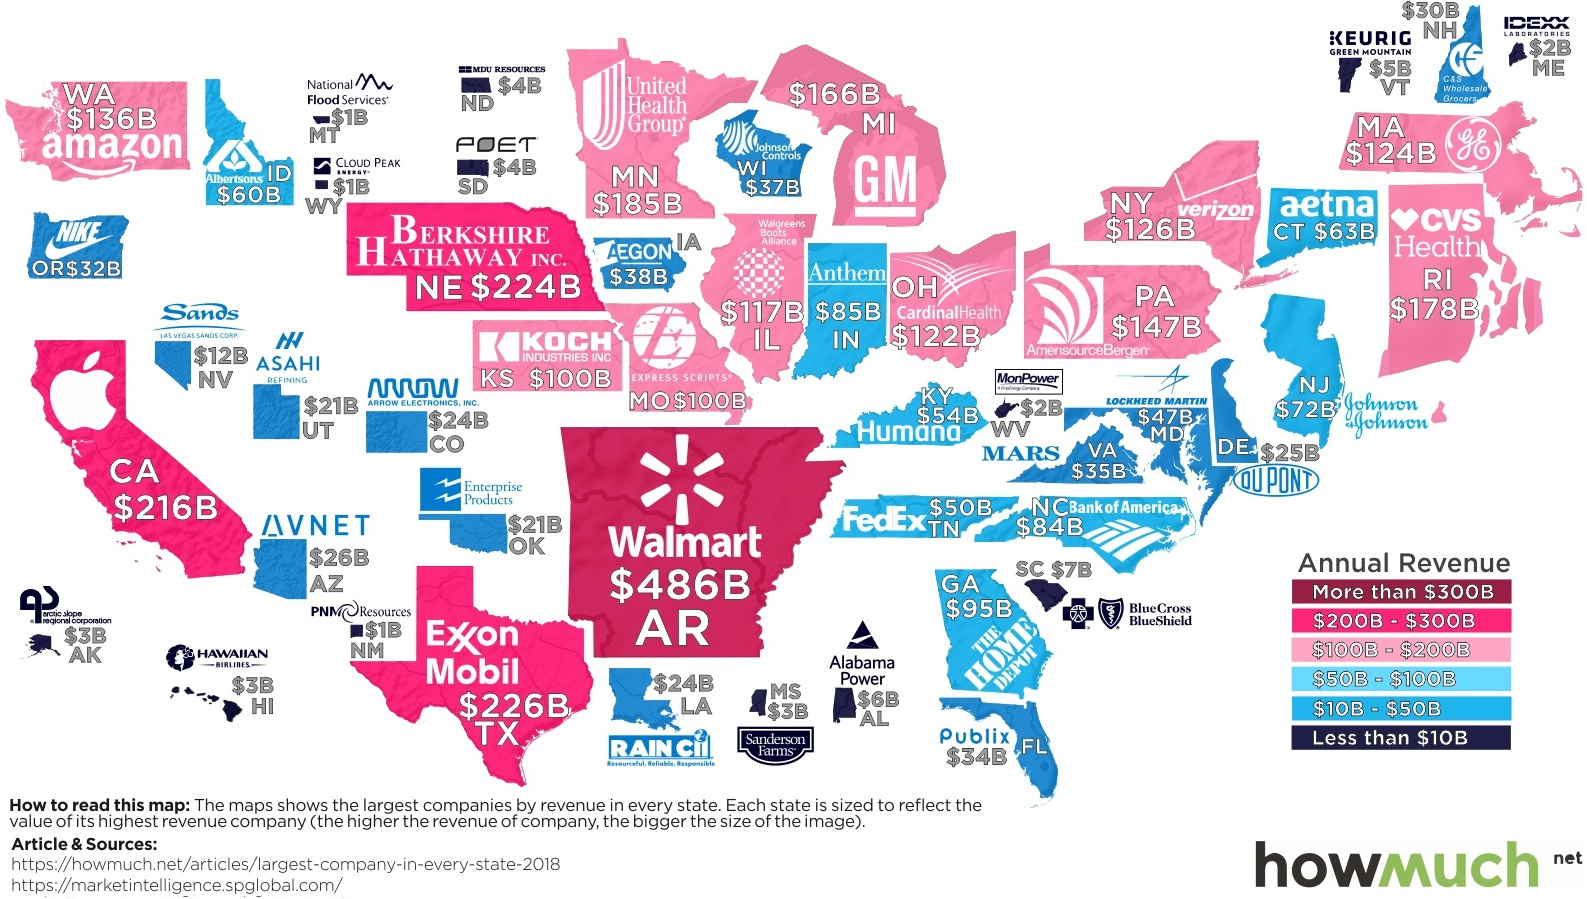
Today’s infographic comes to us from HowMuch.net and it shows the largest company in every state by revenue, based on 2017 data.
To start, here’s a list of the top 10 companies, and their respective states:
| Rank | Company | State | Revenue |
|---|---|---|---|
| #1 | Walmart | Arkansas | $486 billion |
| #2 | ExxonMobil | Texas | $226 billion |
| #3 | Berkshire Hathaway | Nebraska | $224 billion |
| #4 | Apple | California | $216 billion |
| #5 | UnitedHealth Group | Minnesota | $185 billion |
| #6 | CVS Health | Rhode Island | $178 billion |
| #7 | GM | Michigan | $166 billion |
| #8 | AmerisourceBergen | Pennsylvania | $147 billion |
| #9 | Amazon | Washington | $136 billion |
| #10 | Verizon | New York | $126 billion |
Walmart, which is also the top private employer in many states, had a whopping $486 billion of revenue. That’s more than double the amount done by each of the next few giant companies, including ExxonMobil, Berkshire Hathaway, and Apple.
While most of the “big” states like California, New York, and Texas are represented in the top 10, it’s worth noting that Arkansas (Walmart), Rhode Island (CVS), Minnesota (UnitedHealth Group), and Nebraska (Berkshire Hathaway) are outliers in that context.
Further, some of the country’s most populous and economically successful states don’t have a company on the top 10 list. Florida’s top company (Publix) brings in $34 billion per year, and the largest company in Illinois (Walgreens Boots Alliance) posted $117 billion – which puts it just off the list.
Ohio and New Jersey are two other big name states that also don’t appear there.
Under the Radar
Well-known companies and states aside, some of the most interesting companies on the list are the ones that are lesser known.
Sanderson Farms, for example, brings in $3 billion of revenue to make it the largest company by revenue in Mississippi. It’s the only Fortune 1000 company in the state, and it’s also the third largest poultry producer in the United States. Each week, Sanderson Farms produces 9.375 million chickens.
In Florida, Publix is a big deal. It’s a supermarket chain with over 1,000 stores (mostly in Florida and Georgia), and it brings in $34 billion of revenue per year. Interestingly, Publix is considered the largest employee-owned company in the world.
Appropriately, Nevada’s largest company by revenue is Las Vegas Sands – the company that owns The Venetian and The Palazzo on the Vegas strip. It also has properties in Macau, China, Singapore, and Pennsylvania.


Markets
The European Stock Market: Attractive Valuations Offer Opportunities
On average, the European stock market has valuations that are nearly 50% lower than U.S. valuations. But how can you access the market?


European Stock Market: Attractive Valuations Offer Opportunities
Europe is known for some established brands, from L’Oréal to Louis Vuitton. However, the European stock market offers additional opportunities that may be lesser known.
The above infographic, sponsored by STOXX, outlines why investors may want to consider European stocks.
Attractive Valuations
Compared to most North American and Asian markets, European stocks offer lower or comparable valuations.
| Index | Price-to-Earnings Ratio | Price-to-Book Ratio |
|---|---|---|
| EURO STOXX 50 | 14.9 | 2.2 |
| STOXX Europe 600 | 14.4 | 2 |
| U.S. | 25.9 | 4.7 |
| Canada | 16.1 | 1.8 |
| Japan | 15.4 | 1.6 |
| Asia Pacific ex. China | 17.1 | 1.8 |
Data as of February 29, 2024. See graphic for full index names. Ratios based on trailing 12 month financials. The price to earnings ratio excludes companies with negative earnings.
On average, European valuations are nearly 50% lower than U.S. valuations, potentially offering an affordable entry point for investors.
Research also shows that lower price ratios have historically led to higher long-term returns.
Market Movements Not Closely Connected
Over the last decade, the European stock market had low-to-moderate correlation with North American and Asian equities.
The below chart shows correlations from February 2014 to February 2024. A value closer to zero indicates low correlation, while a value of one would indicate that two regions are moving in perfect unison.
| EURO STOXX 50 | STOXX EUROPE 600 | U.S. | Canada | Japan | Asia Pacific ex. China |
|
|---|---|---|---|---|---|---|
| EURO STOXX 50 | 1.00 | 0.97 | 0.55 | 0.67 | 0.24 | 0.43 |
| STOXX EUROPE 600 | 1.00 | 0.56 | 0.71 | 0.28 | 0.48 | |
| U.S. | 1.00 | 0.73 | 0.12 | 0.25 | ||
| Canada | 1.00 | 0.22 | 0.40 | |||
| Japan | 1.00 | 0.88 | ||||
| Asia Pacific ex. China | 1.00 |
Data is based on daily USD returns.
European equities had relatively independent market movements from North American and Asian markets. One contributing factor could be the differing sector weights in each market. For instance, technology makes up a quarter of the U.S. market, but health care and industrials dominate the broader European market.
Ultimately, European equities can enhance portfolio diversification and have the potential to mitigate risk for investors.
Tracking the Market
For investors interested in European equities, STOXX offers a variety of flagship indices:
| Index | Description | Market Cap |
|---|---|---|
| STOXX Europe 600 | Pan-regional, broad market | €10.5T |
| STOXX Developed Europe | Pan-regional, broad-market | €9.9T |
| STOXX Europe 600 ESG-X | Pan-regional, broad market, sustainability focus | €9.7T |
| STOXX Europe 50 | Pan-regional, blue-chip | €5.1T |
| EURO STOXX 50 | Eurozone, blue-chip | €3.5T |
Data is as of February 29, 2024. Market cap is free float, which represents the shares that are readily available for public trading on stock exchanges.
The EURO STOXX 50 tracks the Eurozone’s biggest and most traded companies. It also underlies one of the world’s largest ranges of ETFs and mutual funds. As of November 2023, there were €27.3 billion in ETFs and €23.5B in mutual fund assets under management tracking the index.
“For the past 25 years, the EURO STOXX 50 has served as an accurate, reliable and tradable representation of the Eurozone equity market.”
— Axel Lomholt, General Manager at STOXX
Partnering with STOXX to Track the European Stock Market
Are you interested in European equities? STOXX can be a valuable partner:
- Comprehensive, liquid and investable ecosystem
- European heritage, global reach
- Highly sophisticated customization capabilities
- Open architecture approach to using data
- Close partnerships with clients
- Part of ISS STOXX and Deutsche Börse Group
With a full suite of indices, STOXX can help you benchmark against the European stock market.
Learn how STOXX’s European indices offer liquid and effective market access.

-

 Economy4 days ago
Economic Growth Forecasts for G7 and BRICS Countries in 2024
The IMF has released its economic growth forecasts for 2024. How do the G7 and BRICS countries compare?
-

 Markets2 weeks ago
U.S. Debt Interest Payments Reach $1 Trillion
U.S. debt interest payments have surged past the $1 trillion dollar mark, amid high interest rates and an ever-expanding debt burden.
-

 United States2 weeks ago
Ranked: The Largest U.S. Corporations by Number of Employees
We visualized the top U.S. companies by employees, revealing the massive scale of retailers like Walmart, Target, and Home Depot.
-

 Markets2 weeks ago
The Top 10 States by Real GDP Growth in 2023
This graphic shows the states with the highest real GDP growth rate in 2023, largely propelled by the oil and gas boom.
-

 Markets3 weeks ago
Ranked: The World’s Top Flight Routes, by Revenue
In this graphic, we show the highest earning flight routes globally as air travel continued to rebound in 2023.
-

 Markets3 weeks ago
Ranked: The Most Valuable Housing Markets in America
The U.S. residential real estate market is worth a staggering $47.5 trillion. Here are the most valuable housing markets in the country.


-

 Lithium6 days ago
Ranked: The Top 10 EV Battery Manufacturers in 2023
-

 Green2 weeks ago
Top Countries By Forest Growth Since 2001
-
United States2 weeks ago
Ranked: The Largest U.S. Corporations by Number of Employees
-

 Maps2 weeks ago
The Largest Earthquakes in the New York Area (1970-2024)
-

 Green2 weeks ago
Ranked: The Countries With the Most Air Pollution in 2023
-

 Green2 weeks ago
Ranking the Top 15 Countries by Carbon Tax Revenue
-
Markets2 weeks ago
U.S. Debt Interest Payments Reach $1 Trillion
-

 Mining2 weeks ago
Gold vs. S&P 500: Which Has Grown More Over Five Years?