Green
The Human Impact on the World’s Forests
View a high resolution version of this graphic.
Source: Global forest Watch
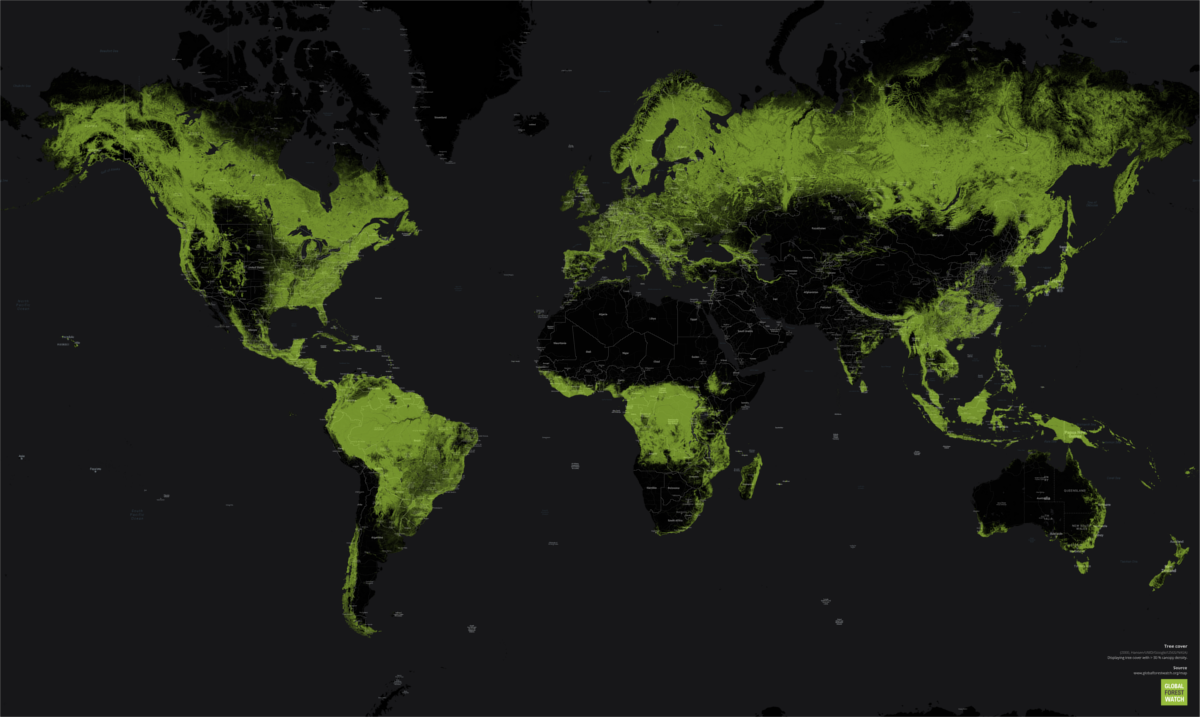
Snapshot of the World’s Forests
View the high resolution version of today’s graphic by clicking here.
Forests cover over 30% of the world’s land, but human activity is chipping away at the tree line.
At the outset of the 20th century, there was approximately 31 million square miles (50 million square km) of forest around the world. Today, that number has shrunk to less than 25 million square miles (40 million square km). Much of this decline can be attributed to expanding agricultural land use and increasing demand for wood and paper products.
Source: World Bank
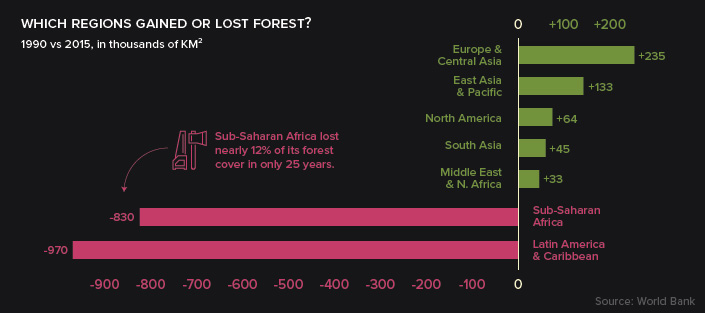
The growth and decline of forest cover is hardly uniform. Deserts, farmland, and urban areas ebb and flow around the world, and while some countries are rapidly removing trees from their ecosystem, others are seeing increases in their forest cover.
Receding Leaf Line
Since 1990, global forested area has shrunk by 2 million square miles (3.1 million square km), with many of those losses occurring in South America and Sub-Saharan Africa.
The Amazon Rainforest, one of the most important carbon sinks on the planet, has faced intense pressure from human activity over the last few decades. Brazil’s expanding network of roads has been critical for economic development, but the landscape often pays the price as the country increases its GDP per capita.

Rainforest turns to farmland in Brazil’s Rondônia state: 1984–2016
Across the Atlantic Ocean, Africa is grappling with deforestation.
West Africa, for example, has lost a shocking 90% of its forest cover over the last century – in a number of countries, all of the forest outside of protected areas has been logged, while illegal logging threatens parks and reserves.
If nothing is done, we may lose everything.
– Abraham Baffoe, Africa regional director at Proforest
Forest Renewal
Images of slash-and-burn land clearing and denuded hillsides grab the headlines, however, there are a few places in the world where forests are expanding.
Europe, in particular, has seen widespread regeneration of forests over the past century.
Source: Wageningen
China is another, perhaps surprising, place where there have been big increases in forested areas.
Each year, dust storms blowing in from the expanding Gobi Desert displace as much as 800 square miles (2,000 square km) of topsoil and damage crops adjacent to the expanding desert. In response, the government created the Three-North Shelterbelt Program, which they hope will halt desertification. Thousands of miles of newly-planted vegetation will act like a wall, containing the spread of the Gobi Desert.
The Big Picture
Activities that lead to deforestation differ from region to region, but they’re always economic in nature. Palm oil, logging, raising cattle, and even charcoal production are all ways people can pull themselves out of poverty in developing countries.
The good news is that as per capita incomes in developing countries continue to rise, pressure on forests should lessen.
This theory is best visualized by Kuznets Curve, which demonstrates a link between economic development and environmental degradation.
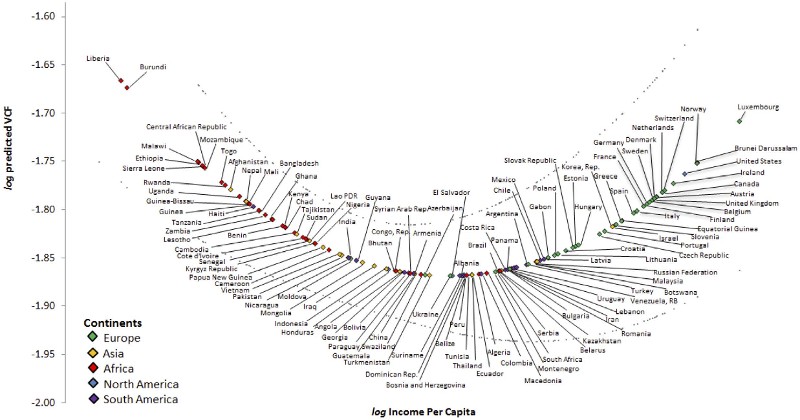
Click here to view the full sized version.
In regions with lax enforcement, corruption, and a large population of people living below the poverty line, deforestation could remain a problem until economic conditions improve. Thankfully, the five countries with the most forest cover – Russia, Brazil, Canada, U.S., and China – are on or are moving towards a more favorable side of the curve.
Another bright spot in this story is that governments are increasingly protecting habitat in the form of nature reserves and national parks. Since 1990, the amount of nationally protected land in the world has nearly doubled.


Green
The Carbon Footprint of Major Travel Methods
Going on a cruise ship and flying domestically are the most carbon-intensive travel methods.


The Carbon Footprint of Major Travel Methods
This was originally posted on our Voronoi app. Download the app for free on iOS or Android and discover incredible data-driven charts from a variety of trusted sources.
Did you know that transport accounts for nearly one-quarter of global energy-related carbon dioxide (CO₂) emissions?
This graphic illustrates the carbon footprints of major travel methods measured in grams of carbon dioxide equivalent (CO₂e) emitted per person to travel one kilometer. This includes both CO₂ and other greenhouse gases.
Data is sourced from Our World in Data, the UK Government’s Department for Energy Security and Net Zero, and The International Council on Clean Transportation, as of December 2022.
These figures should be interpreted as approximations, rather than exact numbers. There are many variables at play that determine the actual carbon footprint in any individual case, including vehicle type or model, occupancy, energy mix, and even weather.
Cruise Ships are the Most Carbon-Intensive Travel Method
According to these estimates, taking a cruise ship, flying domestically, and driving alone are some of the most carbon-intensive travel methods.
Cruise ships typically use heavy fuel oil, which is high in carbon content. The average cruise ship weighs between 70,000 to 180,000 metric tons, meaning they require large engines to get moving.
These massive vessels must also generate power for onboard amenities such as lighting, air conditioning, and entertainment systems.
Short-haul flights are also considered carbon-intensive due to the significant amount of fuel consumed during initial takeoff and climbing altitude, relative to a lower amount of cruising.
| Transportation method | CO₂ equivalent emissions per passenger km |
|---|---|
| Cruise Ship | 250 |
| Short-haul flight (i.e. within a U.S. state or European country) | 246 |
| Diesel car | 171 |
| Gas car | 170 |
| Medium-haul flight (i.e. international travel within Europe, or between U.S. states) | 151 |
| Long-haul flight (over 3,700 km, about the distance from LA to NY) | 147 |
| Motorbike | 113 |
| Bus (average) | 96 |
| Plug-in hybrid | 68 |
| Electric car | 47 |
| National rail | 35 |
| Tram | 28 |
| London Underground | 27 |
| Ferry (foot passenger) | 19 |
| Eurostar (International rail) | 4.5 |
Are EVs Greener?
Many experts agree that EVs produce a lower carbon footprint over time versus traditional internal combustion engine (ICE) vehicles.
However, the batteries in electric vehicles charge on the power that comes straight off the electrical grid—which in many places may be powered by fossil fuels. For that reason, the carbon footprint of an EV will depend largely on the blend of electricity sources used for charging.
There are also questions about how energy-intensive it is to build EVs compared to a comparable ICE vehicle.

-

 Technology6 days ago
All of the Grants Given by the U.S. CHIPS Act
-

 Uranium2 weeks ago
The World’s Biggest Nuclear Energy Producers
-

 Education2 weeks ago
How Hard Is It to Get Into an Ivy League School?
-

 Debt2 weeks ago
How Debt-to-GDP Ratios Have Changed Since 2000
-

 Sports2 weeks ago
The Highest Earning Athletes in Seven Professional Sports
-

 Science2 weeks ago
Visualizing the Average Lifespans of Mammals
-

 Brands1 week ago
How Tech Logos Have Evolved Over Time
-

 Energy1 week ago
Ranked: The Top 10 EV Battery Manufacturers in 2023