Markets
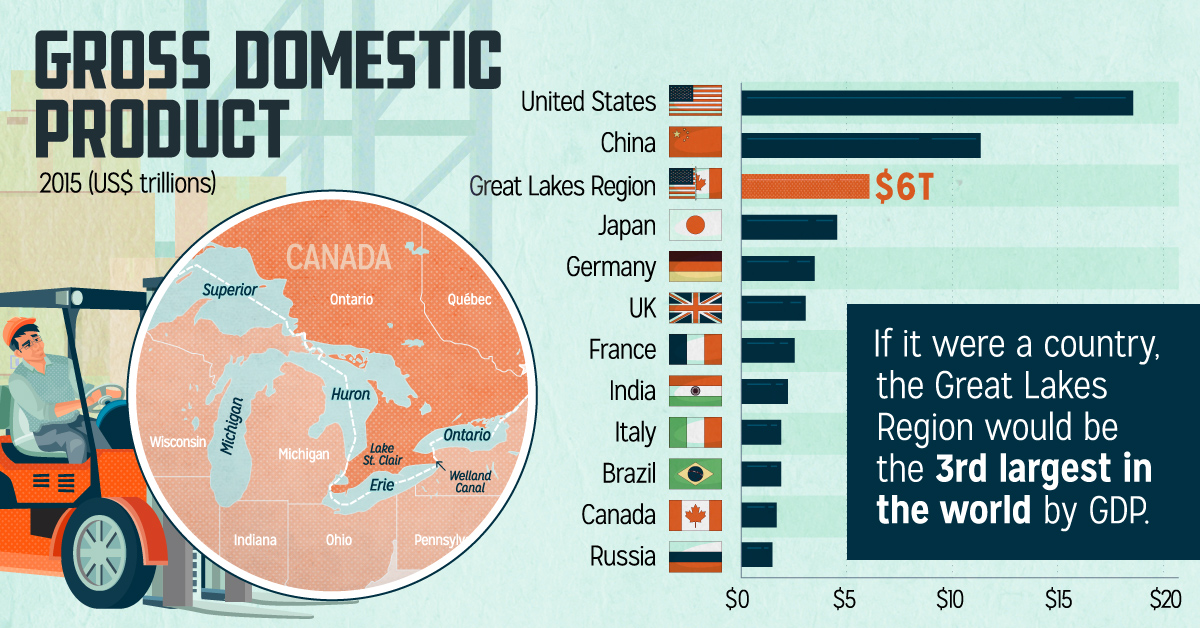
The Great Lakes Economy: The Growth Engine of North America
We don’t often think about the states and Canadian provinces surrounding the Great Lakes as its own economy – but maybe we should.
After all, the region is tightly integrated in terms of trade. It alone accounts for more than 50% of all U.S./Canadian bilateral border trade and sees over 200 million tons of cargo shipped annually. If it were its own country, it would have a GDP of US$6 trillion – making it the third biggest economy in the world.
An Economic Powerhouse
Today’s infographic comes from the Council of the Great Lakes Region, and it breaks down the massive economic impact and trade partnerships that stem from the region’s prolific waterways, and the people living around them.

The Great Lakes Region has always been a center of trade. From the fur trade of the 17th century to modern day, the area’s navigable terrain, waterways, and ports have made it an easy place for goods to exchange hands.
Overview: The Great Lakes Economy
The Great Lakes Region includes eight states (Minnesota, Wisconsin, Illinois, Indiana, Michigan, New York, Ohio, and Pennsylvania) and two Canadian provinces (Ontario and Quebec) that surround the five interconnected freshwater bodies known as the Great Lakes. The area is home to 107 million people, 51 million jobs, and a GDP of US$6 trillion – making the Great Lakes Economy a powerhouse on an international level.
In particular, the region is well-known globally for its manufacturing prowess. It’s home to automobile and aerospace giants like Ford, GM, Chrysler, Bombardier, GE Aviation, and Magna International, and also many other diverse industries. Education and health, shipping and logistics, agriculture, mining and energy, tourism, and finance are some of the other major industries that generate business for the region.
And despite having a border, the Great Lakes Economy is highly integrated. Each year, there is $278 billion in bilateral U.S.-Canadian trade in the Great Lakes area – more than the entire region trades with countries like Mexico, China, UK, Germany and Japan combined.
Cross-Border Customers
The relationship between U.S. states and Canadian provinces in the Great Lakes Region is unique, and relies on goods flowing both ways.
For U.S. companies in the region, 78% of the imports they bring in from Canada are “intermediate goods”, which are raw materials, parts and components, and services that are used to produce other goods and services in the United States.
Here’s a breakdown of Canadian intermediate goods bought by U.S. states:
| Rank | State | Canadian imports (Intermediate Goods, $USD) |
|---|---|---|
| #1 | Illinois | $25.5 billion |
| #2 | Michigan | $15.7 billion |
| #3 | New York | $11.6 billion |
| #4 | Ohio | $9.9 billion |
| #5 | Minnesota | $7.6 billion |
| #6 | Pennsylvania | $7.4 billion |
| #7 | Indiana | $5.3 billion |
| #8 | Wisconsin | $3.0 billion |
| Total | $86.0 billion |
Going the other way, Canadians buy billions of dollars worth of goods from the Great Lake states as well.
In fact, Canada is actually the biggest international customer for each state in the region – something we’ve previously shown in our USA/Canada trade infographic as well.
Bridge Over Troubled Water
Although rhetoric against the U.S./Canadian trade relationship has ramped up in the recent months, there is still one enduring symbol that exemplifies the intimate trade relationship of the two countries in the Great Lakes Economy: the Ambassador Bridge between Detroit, Michigan and Windsor, Ontario.
Each day, over this one 1.3 mi (2.3 km) suspension bridge alone, close to 10,000 trucks pass to generate close to US$500 million of international trade between the two nations.
That’s equal to 25% of all bilateral trade between Canada and the U.S. Amazingly, more bilateral trade happens over this single bridge than the U.S. does in its entirety with France, Germany, South Korea, or the United Kingdom.


Markets
The European Stock Market: Attractive Valuations Offer Opportunities
On average, the European stock market has valuations that are nearly 50% lower than U.S. valuations. But how can you access the market?


European Stock Market: Attractive Valuations Offer Opportunities
Europe is known for some established brands, from L’Oréal to Louis Vuitton. However, the European stock market offers additional opportunities that may be lesser known.
The above infographic, sponsored by STOXX, outlines why investors may want to consider European stocks.
Attractive Valuations
Compared to most North American and Asian markets, European stocks offer lower or comparable valuations.
| Index | Price-to-Earnings Ratio | Price-to-Book Ratio |
|---|---|---|
| EURO STOXX 50 | 14.9 | 2.2 |
| STOXX Europe 600 | 14.4 | 2 |
| U.S. | 25.9 | 4.7 |
| Canada | 16.1 | 1.8 |
| Japan | 15.4 | 1.6 |
| Asia Pacific ex. China | 17.1 | 1.8 |
Data as of February 29, 2024. See graphic for full index names. Ratios based on trailing 12 month financials. The price to earnings ratio excludes companies with negative earnings.
On average, European valuations are nearly 50% lower than U.S. valuations, potentially offering an affordable entry point for investors.
Research also shows that lower price ratios have historically led to higher long-term returns.
Market Movements Not Closely Connected
Over the last decade, the European stock market had low-to-moderate correlation with North American and Asian equities.
The below chart shows correlations from February 2014 to February 2024. A value closer to zero indicates low correlation, while a value of one would indicate that two regions are moving in perfect unison.
| EURO STOXX 50 | STOXX EUROPE 600 | U.S. | Canada | Japan | Asia Pacific ex. China |
|
|---|---|---|---|---|---|---|
| EURO STOXX 50 | 1.00 | 0.97 | 0.55 | 0.67 | 0.24 | 0.43 |
| STOXX EUROPE 600 | 1.00 | 0.56 | 0.71 | 0.28 | 0.48 | |
| U.S. | 1.00 | 0.73 | 0.12 | 0.25 | ||
| Canada | 1.00 | 0.22 | 0.40 | |||
| Japan | 1.00 | 0.88 | ||||
| Asia Pacific ex. China | 1.00 |
Data is based on daily USD returns.
European equities had relatively independent market movements from North American and Asian markets. One contributing factor could be the differing sector weights in each market. For instance, technology makes up a quarter of the U.S. market, but health care and industrials dominate the broader European market.
Ultimately, European equities can enhance portfolio diversification and have the potential to mitigate risk for investors.
Tracking the Market
For investors interested in European equities, STOXX offers a variety of flagship indices:
| Index | Description | Market Cap |
|---|---|---|
| STOXX Europe 600 | Pan-regional, broad market | €10.5T |
| STOXX Developed Europe | Pan-regional, broad-market | €9.9T |
| STOXX Europe 600 ESG-X | Pan-regional, broad market, sustainability focus | €9.7T |
| STOXX Europe 50 | Pan-regional, blue-chip | €5.1T |
| EURO STOXX 50 | Eurozone, blue-chip | €3.5T |
Data is as of February 29, 2024. Market cap is free float, which represents the shares that are readily available for public trading on stock exchanges.
The EURO STOXX 50 tracks the Eurozone’s biggest and most traded companies. It also underlies one of the world’s largest ranges of ETFs and mutual funds. As of November 2023, there were €27.3 billion in ETFs and €23.5B in mutual fund assets under management tracking the index.
“For the past 25 years, the EURO STOXX 50 has served as an accurate, reliable and tradable representation of the Eurozone equity market.”
— Axel Lomholt, General Manager at STOXX
Partnering with STOXX to Track the European Stock Market
Are you interested in European equities? STOXX can be a valuable partner:
- Comprehensive, liquid and investable ecosystem
- European heritage, global reach
- Highly sophisticated customization capabilities
- Open architecture approach to using data
- Close partnerships with clients
- Part of ISS STOXX and Deutsche Börse Group
With a full suite of indices, STOXX can help you benchmark against the European stock market.
Learn how STOXX’s European indices offer liquid and effective market access.

-

 Economy4 days ago
Economic Growth Forecasts for G7 and BRICS Countries in 2024
The IMF has released its economic growth forecasts for 2024. How do the G7 and BRICS countries compare?
-

 Markets2 weeks ago
U.S. Debt Interest Payments Reach $1 Trillion
U.S. debt interest payments have surged past the $1 trillion dollar mark, amid high interest rates and an ever-expanding debt burden.
-

 United States2 weeks ago
Ranked: The Largest U.S. Corporations by Number of Employees
We visualized the top U.S. companies by employees, revealing the massive scale of retailers like Walmart, Target, and Home Depot.
-

 Markets2 weeks ago
The Top 10 States by Real GDP Growth in 2023
This graphic shows the states with the highest real GDP growth rate in 2023, largely propelled by the oil and gas boom.
-

 Markets3 weeks ago
Ranked: The World’s Top Flight Routes, by Revenue
In this graphic, we show the highest earning flight routes globally as air travel continued to rebound in 2023.
-

 Markets3 weeks ago
Ranked: The Most Valuable Housing Markets in America
The U.S. residential real estate market is worth a staggering $47.5 trillion. Here are the most valuable housing markets in the country.


-

 Lithium6 days ago
Ranked: The Top 10 EV Battery Manufacturers in 2023
-

 Green2 weeks ago
Top Countries By Forest Growth Since 2001
-
United States2 weeks ago
Ranked: The Largest U.S. Corporations by Number of Employees
-

 Maps2 weeks ago
The Largest Earthquakes in the New York Area (1970-2024)
-

 Green2 weeks ago
Ranked: The Countries With the Most Air Pollution in 2023
-

 Green2 weeks ago
Ranking the Top 15 Countries by Carbon Tax Revenue
-
Markets2 weeks ago
U.S. Debt Interest Payments Reach $1 Trillion
-

 Mining2 weeks ago
Gold vs. S&P 500: Which Has Grown More Over Five Years?