Markets
Fertility Rates Keep Dropping, and it’s Going to Hit the Economy Hard
The Chart of the Week is a weekly Visual Capitalist feature on Fridays.
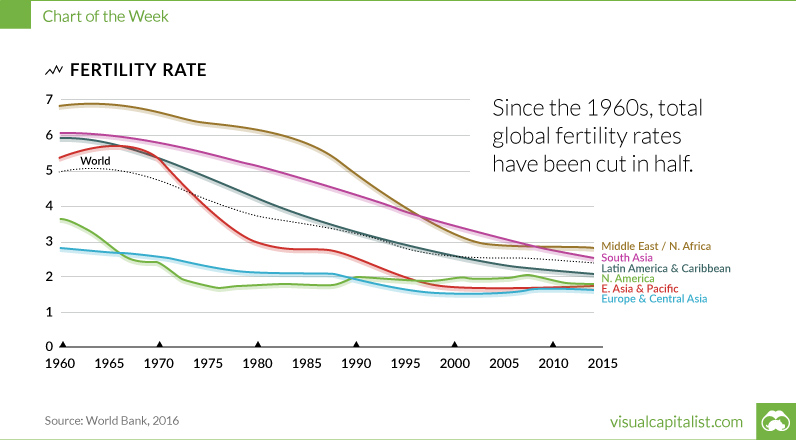
Total fertility rates, which can be defined as the average number of children born to a woman who survives her reproductive years (aged 15-49), have decreased globally by about half since 1960.
This has drastically shaped today’s global economy, but a continued decline could have much more severe long-term consequences. If the world has too many elderly dependents and not enough workers, the burden on economic growth will be difficult to overcome.
Fertility Rates Start to Decline
First, it’s important to address some of the reasons for these falling fertility rates.
In developed nations the introduction of commercially available birth control has played a large role, but this also coincided with several major societal shifts. Changing religious values, the emancipation of women and their increasing participation in the workforce, and higher costs of childcare and education have all factored into declining fertility rates.
Birthrates Wane, Economy Gains
Initially, reduced child dependency rates were actually beneficial to economic growth.
By delaying childbirth, men and women could gain an education before starting a family. This was important in a shifting labor market where smaller, family-run businesses were in decline and a more skilled and specialized labor force was in demand.
Men and women could also choose to start their careers before having families, while paying more in income taxes and enjoying the benefits of a higher disposable income. Increased spending power creates demand, which stimulates job growth – and the economy benefits in the short-term.
A Global Phenomenon
Worldwide fertility rates began to fall substantially in the mid-1960s. While each country has its own underlying causes for this, it is interesting that in developed and developing nations, the downward trend is similar.
Part of this is due to developing countries’ own efforts to rein in their rapidly expanding populations. In China, the One Child Policy was introduced in 1979, however fertility rates had already dropped significantly prior to this. India’s government was also active on this front, sterilizing an estimated 8.3 million people (mostly men) between 1975 and 1977 as a method of population control.
The Age Imbalance
So here we are now, with a global fertility rate of just 2.5 – roughly half of what it was 50 years ago.
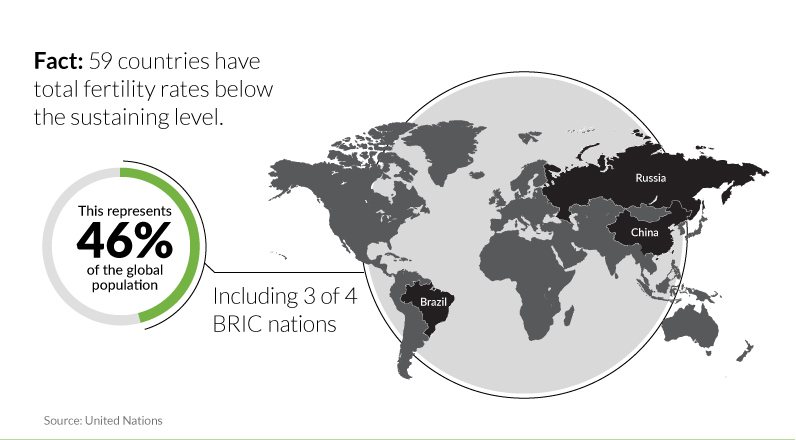
Today, 46% of the world’s population lives in countries that are below the average global replacement rate of 2.1 children per woman.
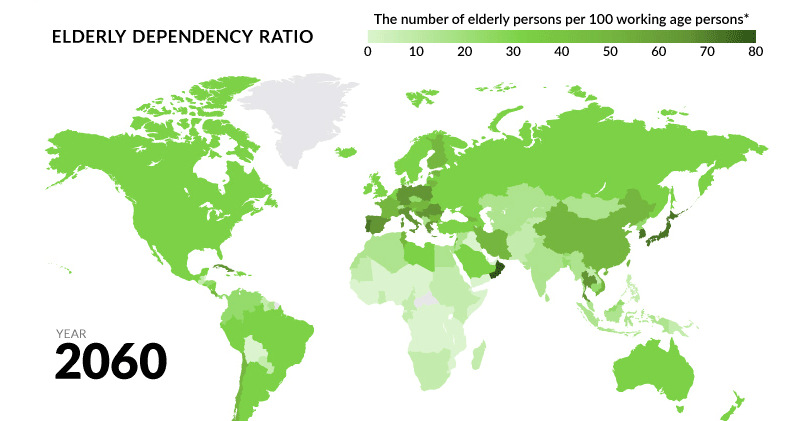
Because these countries (59 to be exact, including BRIC nations Brazil, Russia, and China) are not repopulating quickly enough to sustain their current populations, we are beginning to see a substantial imbalance in the ratio of elderly dependents to working-age people, which will only intensify over the coming decades.
By 2100, the U.N. predicts that nearly 30% of the population will be made of people 60 years and older. Life expectancy also continues to increase steadily, which means those dependents will be living even longer. Between 2000 and 2015 the average global life expectancy at birth increased by around 5 years, reaching an average of 73.8 years for females and 69.1 years for males.
Economic Reversal
What does this mean for the economy?
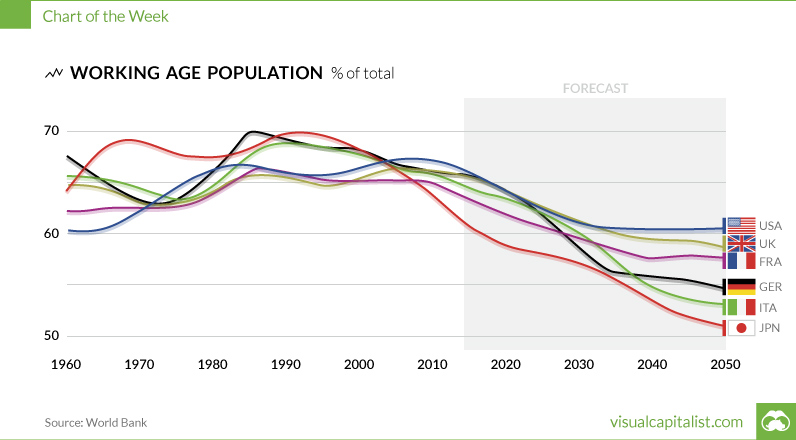
As this large aging population exits the workforce, most of the positive trends that were spurred by declining fertility rates will be reversed, and economic growth will face a significant burden.
The global increase of elderly dependent populations will have serious economic consequences. Health care costs for the elderly will strain resources, while the smaller working population will struggle to produce enough income tax revenue to support these rising costs. It’s likely this will cause spending power to decrease, consumerism to decline, job production to slow – and the economy to stagnate.
Solutions
Immigration has been a source of short-term population sustenance for many nations, including the U.S. and Britain. However, aside from obvious societal tensions associated with this strategy, immigrants are often adults themselves when they relocate, meaning they too will be elderly dependents soon.
Several nations are already experiencing the effects of a large proportion of elderly dependents. Japan, with one-quarter of its total population currently over the age of 65, has been a pioneer in developing technologies, such as robotics, as a solution to ease strained health care resources. Many countries are restructuring health care programs with long-term solutions in mind, while others are attempting to lower the cost of childcare and education.


Markets
The European Stock Market: Attractive Valuations Offer Opportunities
On average, the European stock market has valuations that are nearly 50% lower than U.S. valuations. But how can you access the market?


European Stock Market: Attractive Valuations Offer Opportunities
Europe is known for some established brands, from L’Oréal to Louis Vuitton. However, the European stock market offers additional opportunities that may be lesser known.
The above infographic, sponsored by STOXX, outlines why investors may want to consider European stocks.
Attractive Valuations
Compared to most North American and Asian markets, European stocks offer lower or comparable valuations.
| Index | Price-to-Earnings Ratio | Price-to-Book Ratio |
|---|---|---|
| EURO STOXX 50 | 14.9 | 2.2 |
| STOXX Europe 600 | 14.4 | 2 |
| U.S. | 25.9 | 4.7 |
| Canada | 16.1 | 1.8 |
| Japan | 15.4 | 1.6 |
| Asia Pacific ex. China | 17.1 | 1.8 |
Data as of February 29, 2024. See graphic for full index names. Ratios based on trailing 12 month financials. The price to earnings ratio excludes companies with negative earnings.
On average, European valuations are nearly 50% lower than U.S. valuations, potentially offering an affordable entry point for investors.
Research also shows that lower price ratios have historically led to higher long-term returns.
Market Movements Not Closely Connected
Over the last decade, the European stock market had low-to-moderate correlation with North American and Asian equities.
The below chart shows correlations from February 2014 to February 2024. A value closer to zero indicates low correlation, while a value of one would indicate that two regions are moving in perfect unison.
| EURO STOXX 50 | STOXX EUROPE 600 | U.S. | Canada | Japan | Asia Pacific ex. China |
|
|---|---|---|---|---|---|---|
| EURO STOXX 50 | 1.00 | 0.97 | 0.55 | 0.67 | 0.24 | 0.43 |
| STOXX EUROPE 600 | 1.00 | 0.56 | 0.71 | 0.28 | 0.48 | |
| U.S. | 1.00 | 0.73 | 0.12 | 0.25 | ||
| Canada | 1.00 | 0.22 | 0.40 | |||
| Japan | 1.00 | 0.88 | ||||
| Asia Pacific ex. China | 1.00 |
Data is based on daily USD returns.
European equities had relatively independent market movements from North American and Asian markets. One contributing factor could be the differing sector weights in each market. For instance, technology makes up a quarter of the U.S. market, but health care and industrials dominate the broader European market.
Ultimately, European equities can enhance portfolio diversification and have the potential to mitigate risk for investors.
Tracking the Market
For investors interested in European equities, STOXX offers a variety of flagship indices:
| Index | Description | Market Cap |
|---|---|---|
| STOXX Europe 600 | Pan-regional, broad market | €10.5T |
| STOXX Developed Europe | Pan-regional, broad-market | €9.9T |
| STOXX Europe 600 ESG-X | Pan-regional, broad market, sustainability focus | €9.7T |
| STOXX Europe 50 | Pan-regional, blue-chip | €5.1T |
| EURO STOXX 50 | Eurozone, blue-chip | €3.5T |
Data is as of February 29, 2024. Market cap is free float, which represents the shares that are readily available for public trading on stock exchanges.
The EURO STOXX 50 tracks the Eurozone’s biggest and most traded companies. It also underlies one of the world’s largest ranges of ETFs and mutual funds. As of November 2023, there were €27.3 billion in ETFs and €23.5B in mutual fund assets under management tracking the index.
“For the past 25 years, the EURO STOXX 50 has served as an accurate, reliable and tradable representation of the Eurozone equity market.”
— Axel Lomholt, General Manager at STOXX
Partnering with STOXX to Track the European Stock Market
Are you interested in European equities? STOXX can be a valuable partner:
- Comprehensive, liquid and investable ecosystem
- European heritage, global reach
- Highly sophisticated customization capabilities
- Open architecture approach to using data
- Close partnerships with clients
- Part of ISS STOXX and Deutsche Börse Group
With a full suite of indices, STOXX can help you benchmark against the European stock market.
Learn how STOXX’s European indices offer liquid and effective market access.

-

 Economy2 days ago
Economic Growth Forecasts for G7 and BRICS Countries in 2024
The IMF has released its economic growth forecasts for 2024. How do the G7 and BRICS countries compare?
-

 Markets1 week ago
U.S. Debt Interest Payments Reach $1 Trillion
U.S. debt interest payments have surged past the $1 trillion dollar mark, amid high interest rates and an ever-expanding debt burden.
-

 United States2 weeks ago
Ranked: The Largest U.S. Corporations by Number of Employees
We visualized the top U.S. companies by employees, revealing the massive scale of retailers like Walmart, Target, and Home Depot.
-

 Markets2 weeks ago
The Top 10 States by Real GDP Growth in 2023
This graphic shows the states with the highest real GDP growth rate in 2023, largely propelled by the oil and gas boom.
-

 Markets2 weeks ago
Ranked: The World’s Top Flight Routes, by Revenue
In this graphic, we show the highest earning flight routes globally as air travel continued to rebound in 2023.
-

 Markets3 weeks ago
Ranked: The Most Valuable Housing Markets in America
The U.S. residential real estate market is worth a staggering $47.5 trillion. Here are the most valuable housing markets in the country.

-

 Misc1 week ago
How Hard Is It to Get Into an Ivy League School?
-

 Technology2 weeks ago
Ranked: Semiconductor Companies by Industry Revenue Share
-
Markets2 weeks ago
Ranked: The World’s Top Flight Routes, by Revenue
-

 Countries2 weeks ago
Population Projections: The World’s 6 Largest Countries in 2075
-
Markets2 weeks ago
The Top 10 States by Real GDP Growth in 2023
-

 Demographics2 weeks ago
The Smallest Gender Wage Gaps in OECD Countries
-

 Economy2 weeks ago
Where U.S. Inflation Hit the Hardest in March 2024
-

 Green2 weeks ago
Top Countries By Forest Growth Since 2001