Markets
How the World’s Most Elite Growth Investors Pick Stocks
Investing can be extremely psychologically demanding.
Not only are you up against the world’s best investors, but you’re also up against yourself. It’s easy to get caught making irrational decisions based on your own personal blindspots or cognitive biases, and these mistakes can lead to buying when you should sell, and vice versa.
For the above reasons, the most successful investors are often those that have rational and proven systems in place.
Having a method to your madness allows you to have confidence in your decisions, while also taking advantage of the strategies and heuristics that have performed well for the world’s most elite investors.
How to Pick Growth Stocks
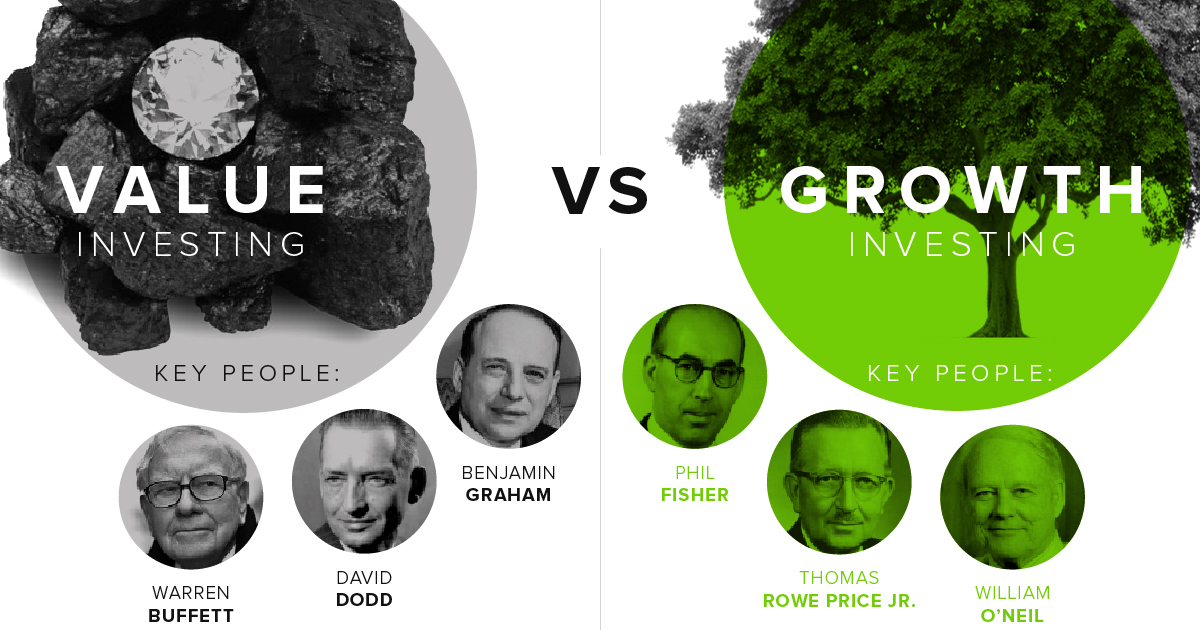
Today’s infographic comes to us from Investor’s Business Daily, and it details the basics around the discipline of growth investing, including the differences the school has with value investing.
More importantly, it also provides a framework for choosing growth stocks used by elite investors such as William J. O’Neil.

Growth investing is all about identifying the companies that are exhibiting behavior that suggests that they will be tomorrow’s leaders.
The benefits to this strategy, if successful, are easy to see. Think about buying Microsoft before it dominated the software industry, or Starbucks before it conquered the United States with its new approach to coffee culture.
The question is: how can these stocks be found reliably?
The CAN SLIM Approach
Fantastic growth stocks don’t just grow on trees – instead, you have to have a system to sift through them.
One easy place to start your search for the next growth leader is with an approach pioneered with investing legend William J. O’Neil. Developed in the 1950s, the CAN SLIM strategy identifies seven characteristics that top-performing stocks often share before making their biggest price gains.
Each characteristic is represented by a letter in the CAN SLIM acronym:
C – Current quarterly earnings
A – Annual earnings growth
N – New product, service, management, or price high
S – Supply and demand
L – Leader or laggard
I – Institutional sponsorship
M – Market direction
Importantly, each of these traits can be a catalyst to influence other traits. When they compound, it can lead to big price movements that beat the rest of the market.
Breaking Down the Factors
Let’s look at each characteristic of the CAN SLIM approach in more detail:
Current quarterly earnings
Look for companies with a minimum earnings-per share (EPS) growth of 25% in the most recent quarter, though 50% or higher is even better. These companies should also have 20% sales growth in the quarter, and a 17% ROE to ensure that growth is sustainable.
Annual earnings growth
Look for companies with annual EPS growth of at least 25% to 50% in each of the previous 3-5 years. This helps confirm that the company is showing long-term growth.
New product, service, management, or price high
What is the company doing that is new or game-changing? To be a market winner, a company must constantly reinvent itself to position itself for higher-than-average profits.
Examples: Consider Google’s monetization of search ads, or McDonald’s novel approach to food. These innovations set the companies up for massive profits and success.
Supply and demand
A stock price increases when more investors demand an increasingly limited supply of shares. Spikes in price, along with volume accumulation, mean that demand is increasing. If this is coming from institutional investors, who tend to buy and hold, it’s even better.
Leader or laggard
The leading companies in leading industries – the best of the best – will be the companies that have the most growth potential.
Institutional sponsorship
75% of all market activity comes from professional investors, such as mutual funds or pension funds. Not only does the smart money help validate a potential growth stock by being involved, but they can trigger big price increases.
Market direction
CAN SLIM investors believe you should invest with the market, as opposed to against it. That’s because an individual stock moves with the market 75% of the time.
Putting it Together
Understanding how the different CAN SLIM factors work together – and how they can help bring massive bouts of growth for the underlying stock – is key for the successful growth investor.
Using a rational system like this also helps you in overcoming cognitive biases or making other mistakes that may affect your investments, as well.


Markets
The European Stock Market: Attractive Valuations Offer Opportunities
On average, the European stock market has valuations that are nearly 50% lower than U.S. valuations. But how can you access the market?


European Stock Market: Attractive Valuations Offer Opportunities
Europe is known for some established brands, from L’Oréal to Louis Vuitton. However, the European stock market offers additional opportunities that may be lesser known.
The above infographic, sponsored by STOXX, outlines why investors may want to consider European stocks.
Attractive Valuations
Compared to most North American and Asian markets, European stocks offer lower or comparable valuations.
| Index | Price-to-Earnings Ratio | Price-to-Book Ratio |
|---|---|---|
| EURO STOXX 50 | 14.9 | 2.2 |
| STOXX Europe 600 | 14.4 | 2 |
| U.S. | 25.9 | 4.7 |
| Canada | 16.1 | 1.8 |
| Japan | 15.4 | 1.6 |
| Asia Pacific ex. China | 17.1 | 1.8 |
Data as of February 29, 2024. See graphic for full index names. Ratios based on trailing 12 month financials. The price to earnings ratio excludes companies with negative earnings.
On average, European valuations are nearly 50% lower than U.S. valuations, potentially offering an affordable entry point for investors.
Research also shows that lower price ratios have historically led to higher long-term returns.
Market Movements Not Closely Connected
Over the last decade, the European stock market had low-to-moderate correlation with North American and Asian equities.
The below chart shows correlations from February 2014 to February 2024. A value closer to zero indicates low correlation, while a value of one would indicate that two regions are moving in perfect unison.
| EURO STOXX 50 | STOXX EUROPE 600 | U.S. | Canada | Japan | Asia Pacific ex. China |
|
|---|---|---|---|---|---|---|
| EURO STOXX 50 | 1.00 | 0.97 | 0.55 | 0.67 | 0.24 | 0.43 |
| STOXX EUROPE 600 | 1.00 | 0.56 | 0.71 | 0.28 | 0.48 | |
| U.S. | 1.00 | 0.73 | 0.12 | 0.25 | ||
| Canada | 1.00 | 0.22 | 0.40 | |||
| Japan | 1.00 | 0.88 | ||||
| Asia Pacific ex. China | 1.00 |
Data is based on daily USD returns.
European equities had relatively independent market movements from North American and Asian markets. One contributing factor could be the differing sector weights in each market. For instance, technology makes up a quarter of the U.S. market, but health care and industrials dominate the broader European market.
Ultimately, European equities can enhance portfolio diversification and have the potential to mitigate risk for investors.
Tracking the Market
For investors interested in European equities, STOXX offers a variety of flagship indices:
| Index | Description | Market Cap |
|---|---|---|
| STOXX Europe 600 | Pan-regional, broad market | €10.5T |
| STOXX Developed Europe | Pan-regional, broad-market | €9.9T |
| STOXX Europe 600 ESG-X | Pan-regional, broad market, sustainability focus | €9.7T |
| STOXX Europe 50 | Pan-regional, blue-chip | €5.1T |
| EURO STOXX 50 | Eurozone, blue-chip | €3.5T |
Data is as of February 29, 2024. Market cap is free float, which represents the shares that are readily available for public trading on stock exchanges.
The EURO STOXX 50 tracks the Eurozone’s biggest and most traded companies. It also underlies one of the world’s largest ranges of ETFs and mutual funds. As of November 2023, there were €27.3 billion in ETFs and €23.5B in mutual fund assets under management tracking the index.
“For the past 25 years, the EURO STOXX 50 has served as an accurate, reliable and tradable representation of the Eurozone equity market.”
— Axel Lomholt, General Manager at STOXX
Partnering with STOXX to Track the European Stock Market
Are you interested in European equities? STOXX can be a valuable partner:
- Comprehensive, liquid and investable ecosystem
- European heritage, global reach
- Highly sophisticated customization capabilities
- Open architecture approach to using data
- Close partnerships with clients
- Part of ISS STOXX and Deutsche Börse Group
With a full suite of indices, STOXX can help you benchmark against the European stock market.
Learn how STOXX’s European indices offer liquid and effective market access.

-

 Economy1 day ago
Economic Growth Forecasts for G7 and BRICS Countries in 2024
The IMF has released its economic growth forecasts for 2024. How do the G7 and BRICS countries compare?
-

 Markets1 week ago
U.S. Debt Interest Payments Reach $1 Trillion
U.S. debt interest payments have surged past the $1 trillion dollar mark, amid high interest rates and an ever-expanding debt burden.
-

 United States2 weeks ago
Ranked: The Largest U.S. Corporations by Number of Employees
We visualized the top U.S. companies by employees, revealing the massive scale of retailers like Walmart, Target, and Home Depot.
-

 Markets2 weeks ago
The Top 10 States by Real GDP Growth in 2023
This graphic shows the states with the highest real GDP growth rate in 2023, largely propelled by the oil and gas boom.
-

 Markets2 weeks ago
Ranked: The World’s Top Flight Routes, by Revenue
In this graphic, we show the highest earning flight routes globally as air travel continued to rebound in 2023.
-

 Markets2 weeks ago
Ranked: The Most Valuable Housing Markets in America
The U.S. residential real estate market is worth a staggering $47.5 trillion. Here are the most valuable housing markets in the country.


-

 Mining1 week ago
Gold vs. S&P 500: Which Has Grown More Over Five Years?
-
Markets2 weeks ago
Ranked: The Most Valuable Housing Markets in America
-

 Money2 weeks ago
Which States Have the Highest Minimum Wage in America?
-

 AI2 weeks ago
Ranked: Semiconductor Companies by Industry Revenue Share
-
Markets2 weeks ago
Ranked: The World’s Top Flight Routes, by Revenue
-

 Demographics2 weeks ago
Population Projections: The World’s 6 Largest Countries in 2075
-
Markets2 weeks ago
The Top 10 States by Real GDP Growth in 2023
-

 Demographics2 weeks ago
The Smallest Gender Wage Gaps in OECD Countries