Markets
The Death of Soda: 11 Slides on Why the Industry Has Gone Flat
When you think of the iconic American brands of the 20th century, names like Coca-Cola and Pepsi have to rank pretty highly on any list.
Both fizzy beverages became household names nearly 100 years ago and even butted heads in one of the most infamous and long-lasting marketing battles of all-time. In the process, both brands have sold billions of bottles of product, creating powerful foundations for their sprawling beverage empires of today.
While the soda industry has seen incredible global growth over the years, it seems all good things must come to an end.
Today’s slides on The Death of Soda come to us from Dynamic Wealth Research, and they show how new consumer preferences have left the soda industry flat, forcing its titans to scramble to recapture market share. We also see what is replacing sugary beverages, and the market potential behind some of these new segments.
1. U.S. Soda Consumption is at a 30-year low
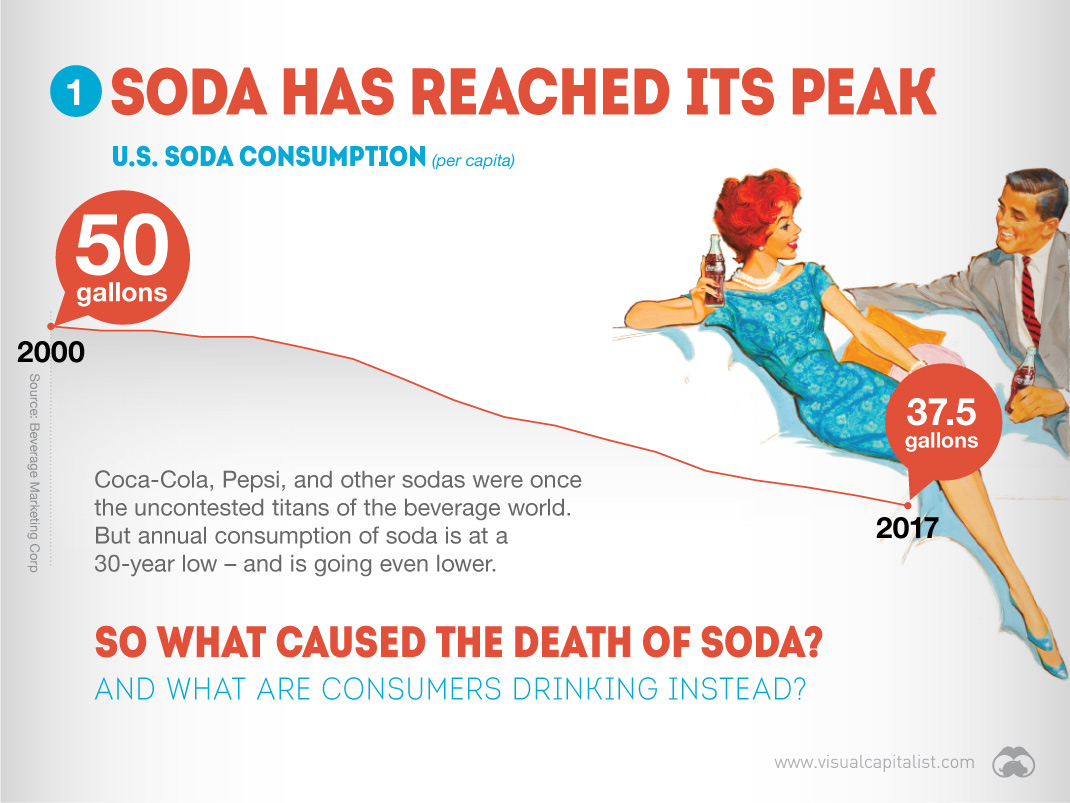
Soda consumption in the U.S. has dropped from 50 gallons to 37.5 gallons per capita between 2000 and 2017. It’s now at a 30-year low.
2. Bottled water is taking over
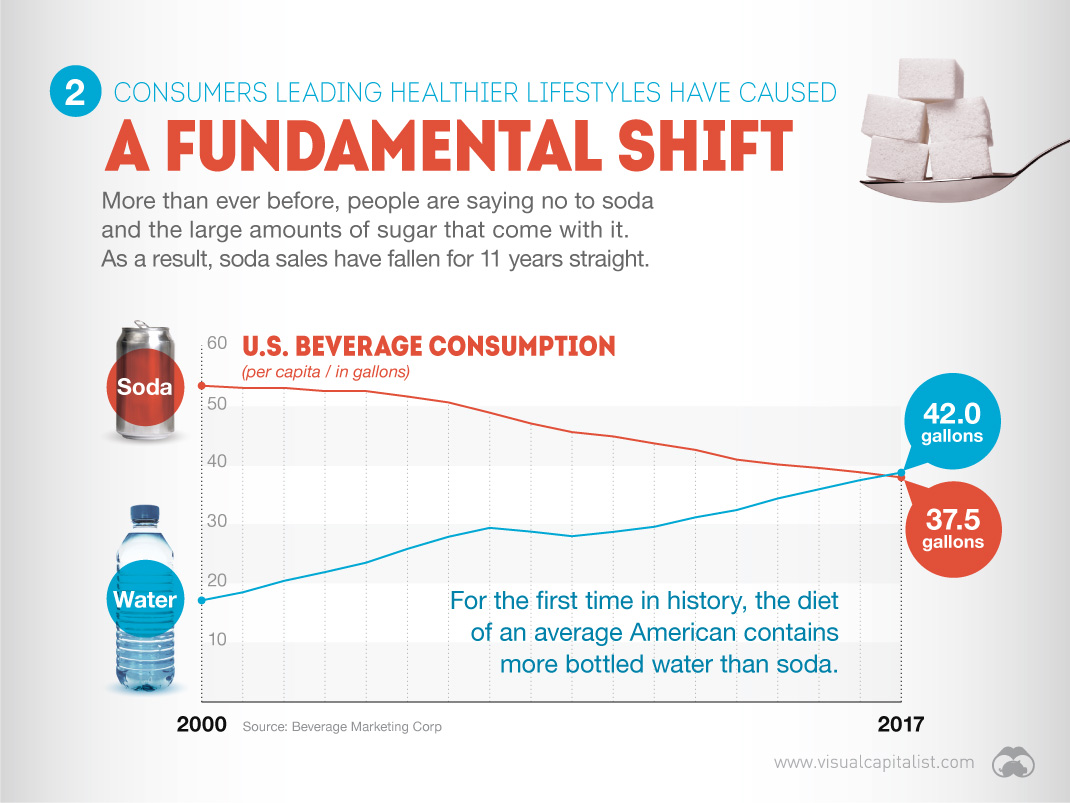
For the first time in U.S. history, more bottled water is being sold than soda per person. It’s a fundamental shift in consumer habits – if you look at the graph, you can see that as recent as the mid-2000s, people drank twice as much soda per capita.
3. Calorie consumption is changing
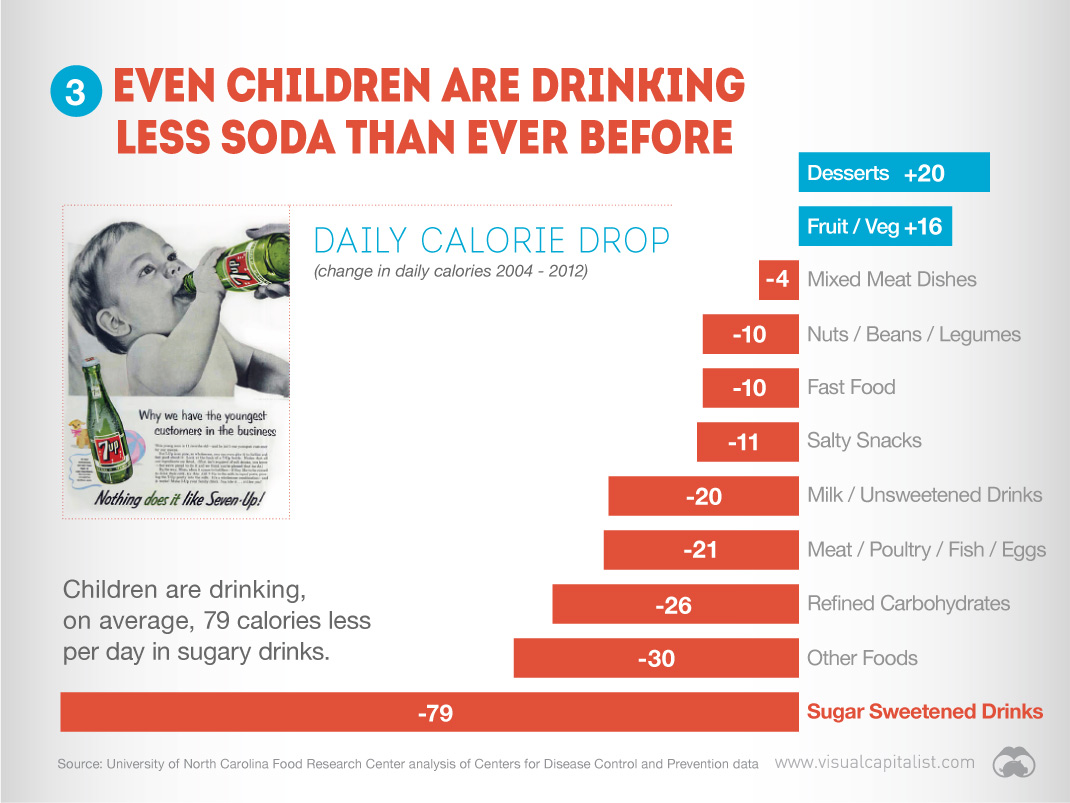
Most of us are eating differently these days, but these changes are extremely evident when looking at calorie consumption of children. As you can see, sugar sweetened drinks are falling off the map in a big way.
4. People are drinking water, instead
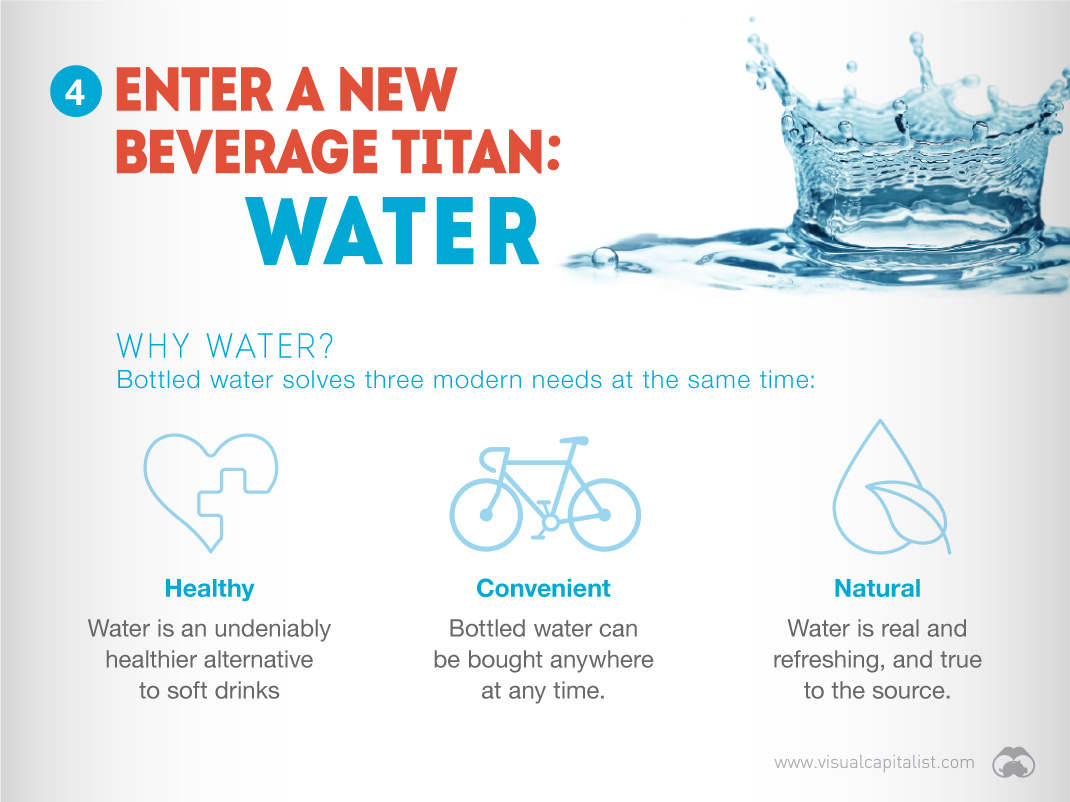
What’s getting substituted for sugar sweetened drinks?
Water is a big one: it’s healthy, convenient, and natural – all things that appeal to today’s health-conscious consumers.
5. The water market is maturing
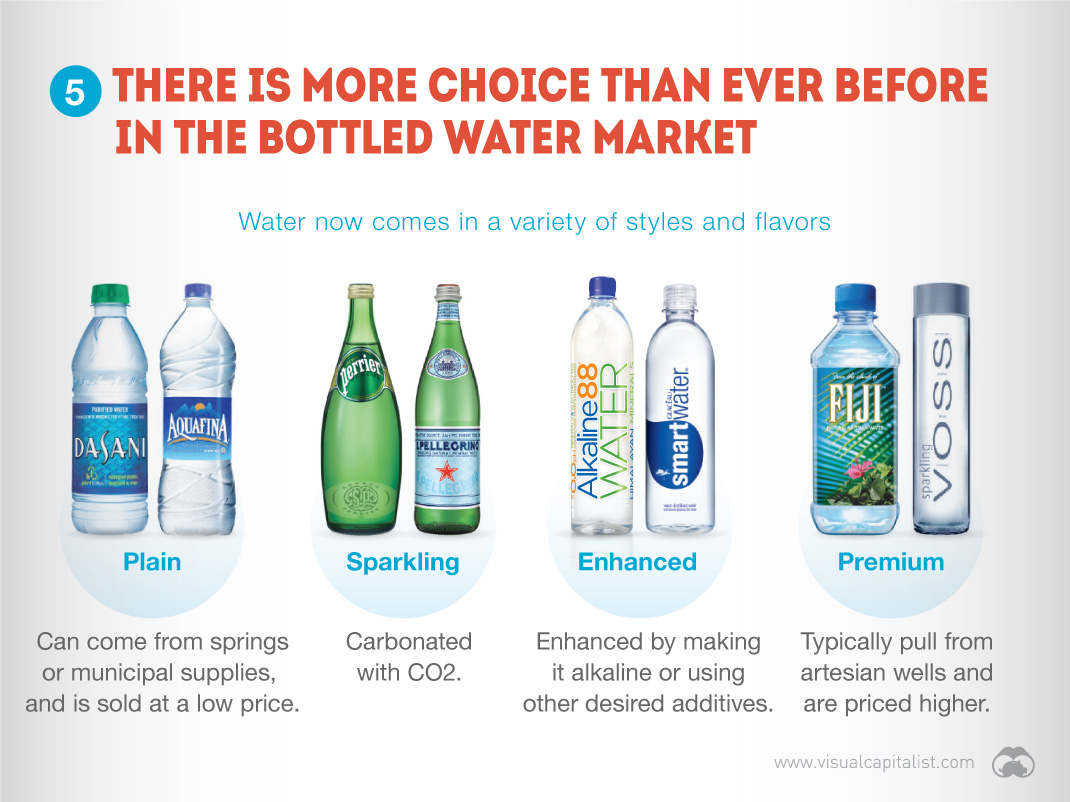
As the market matures, different segments an niches are being carved out. For example, water can be plain, sparkling, enhanced, or premium.
6. Consumers want more than plain water
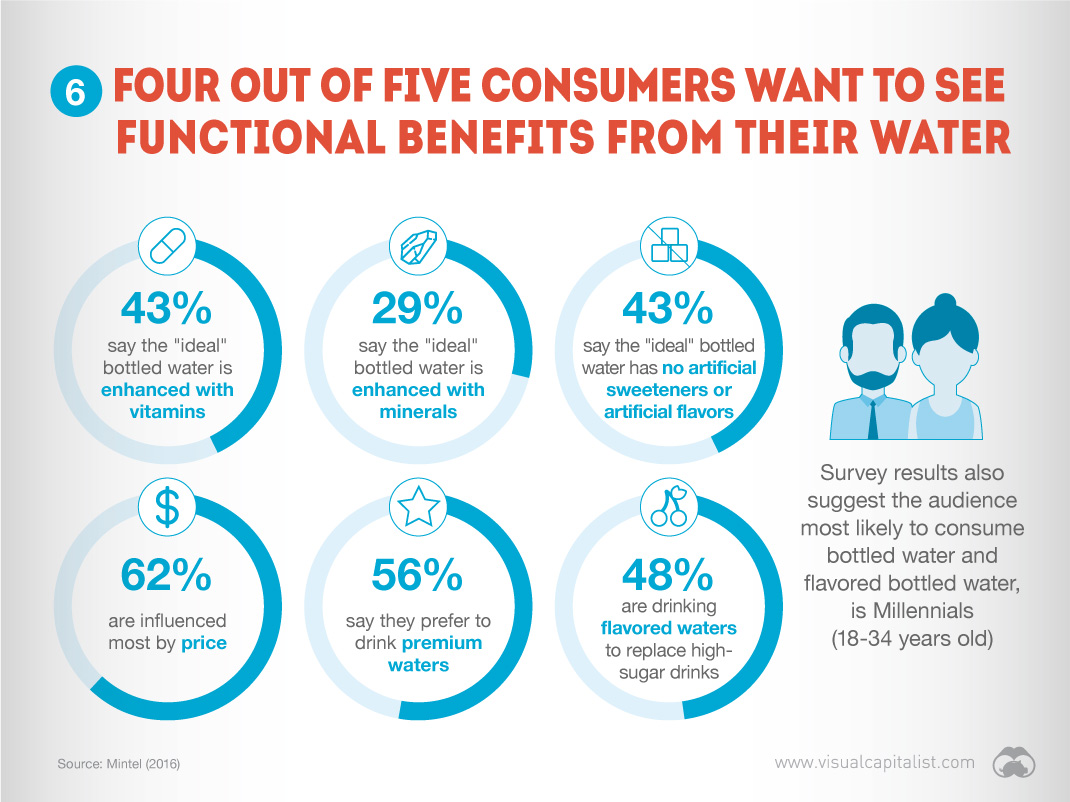
Plain water can also be poured from a tap, so it’s not surprising that consumers want to see their water enhanced in some way. Many are also sensitive to price.
7. The bottled water market is worth billions
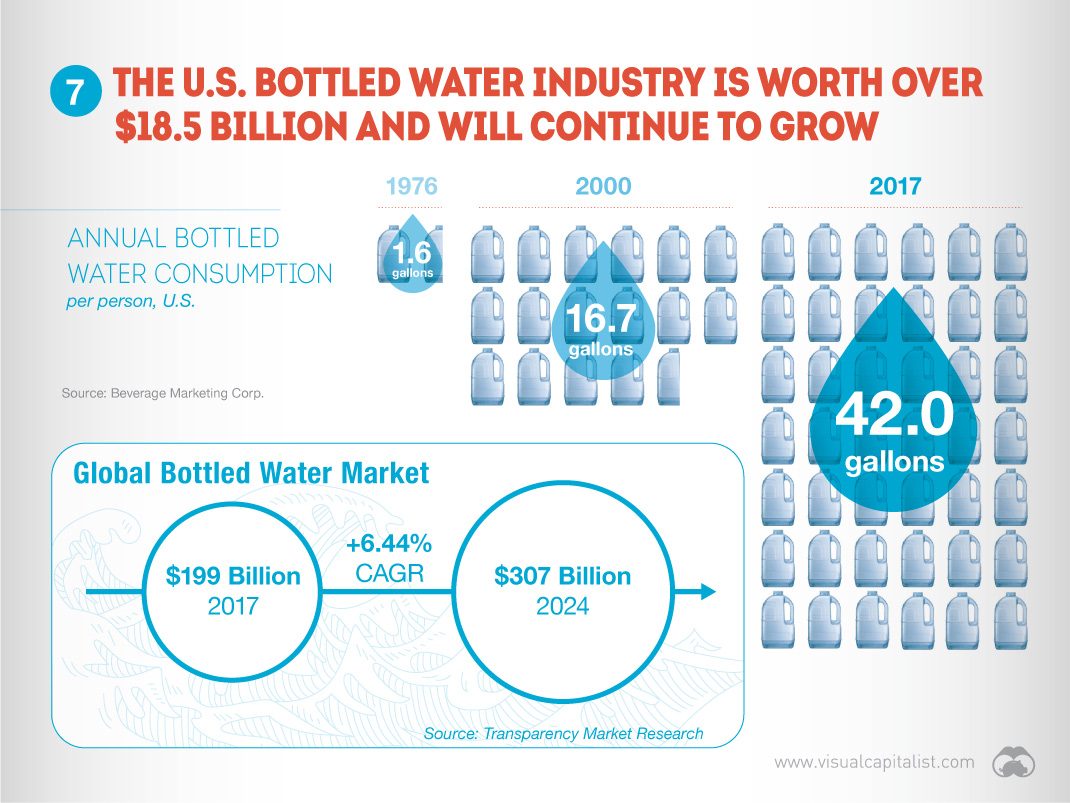
In 2017, the global bottled water market was worth $199 billion.
8. Soda brands are scrambling
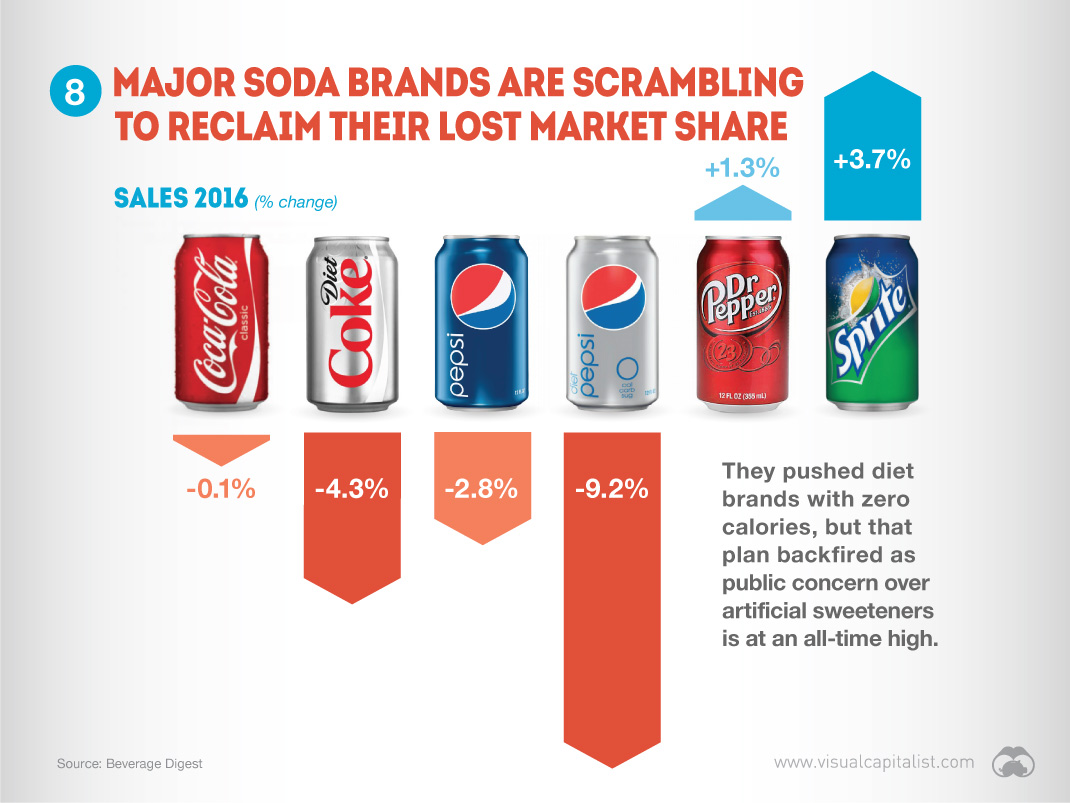
Soda brands pushed their diet products, but this backfired as consumers became concerned about the impact of artificial sweeteners on their diets.
9. Coca-Cola is diversifying its business
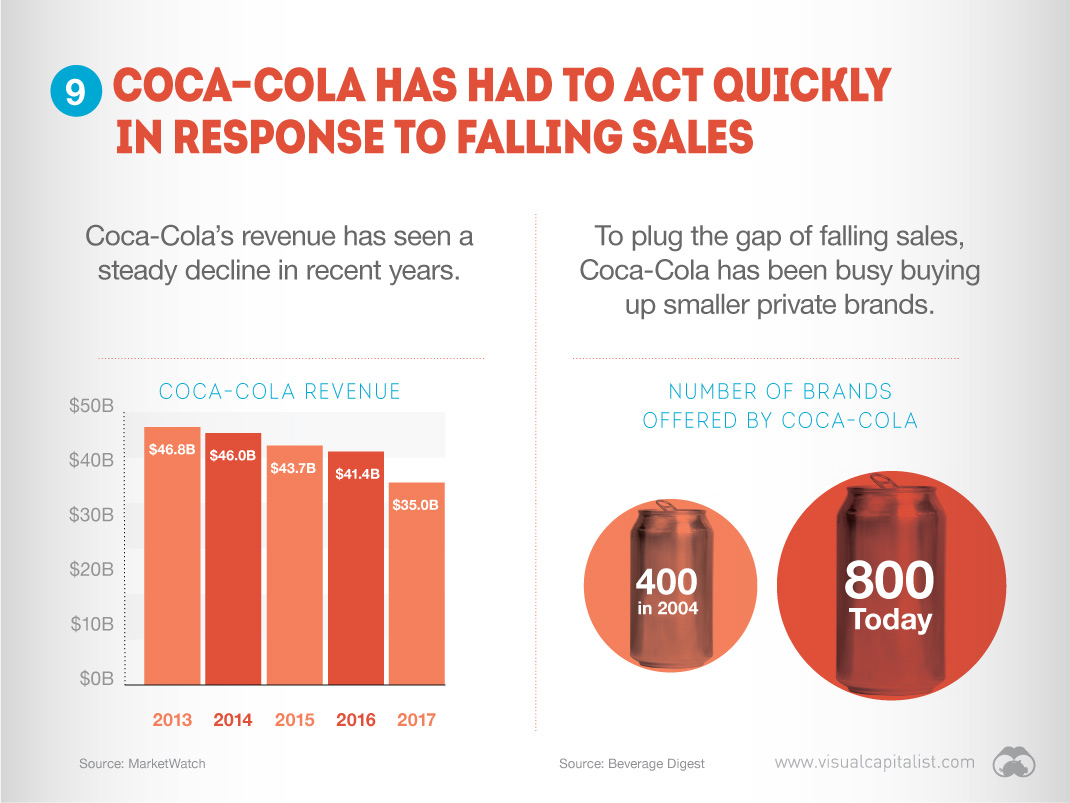
In response to the death of soda, companies like Coca-Cola are adding brands to their portfolio that can compete in less traditional segments. Examples of these brands include everything from energy drinks to coconut water.
10. Big brands are buying up smaller companies
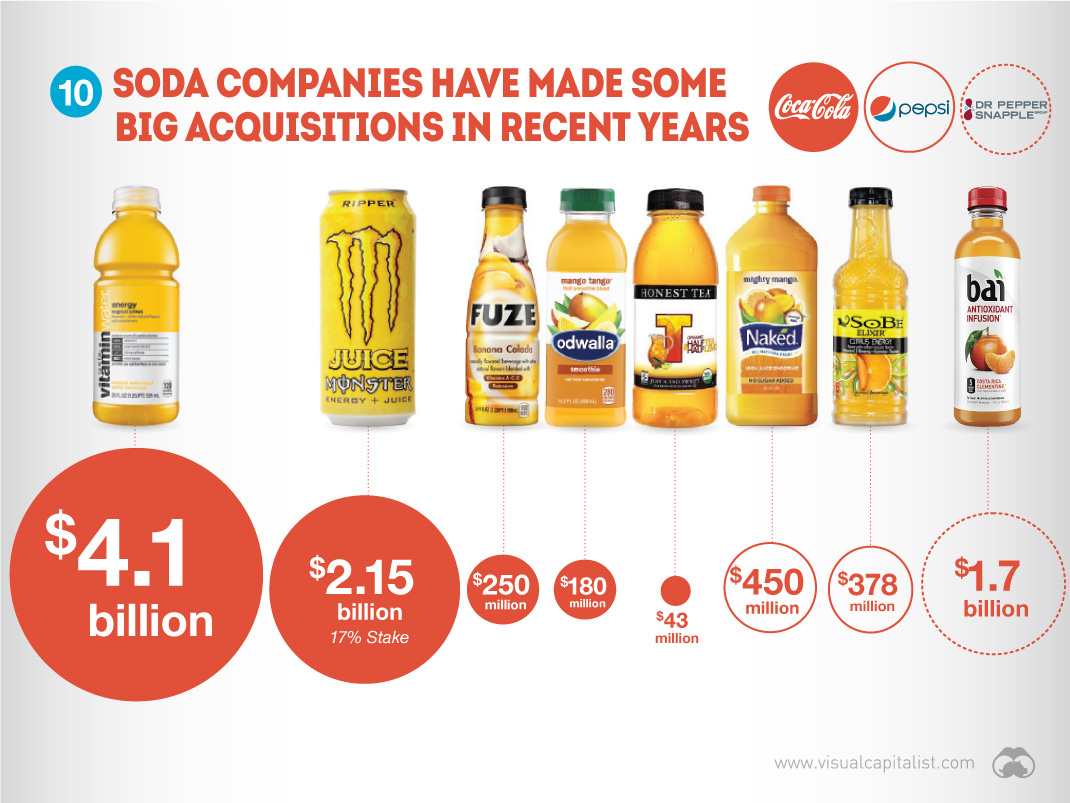
Big fish like Coca-Cola and PepsiCo are gobbling up innovative beverage startups in order to compete in these new and emerging segments.
11. The trend is your friend
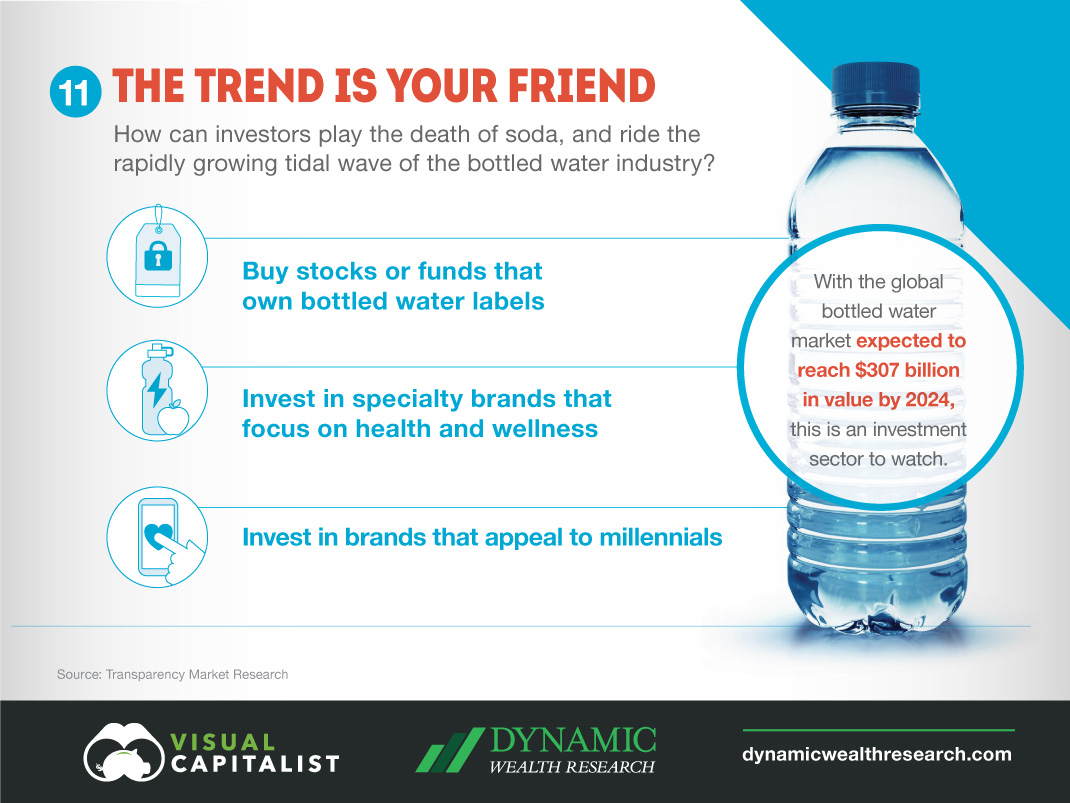
As the beverage industry continues to get turned upside down by the death of soda, it creates opportunities for savvy investors. The global bottled water market will reach an impressive $307 billion by 2021, and new segments will continue to emerge as consumers become even more health-conscious.


Markets
The European Stock Market: Attractive Valuations Offer Opportunities
On average, the European stock market has valuations that are nearly 50% lower than U.S. valuations. But how can you access the market?


European Stock Market: Attractive Valuations Offer Opportunities
Europe is known for some established brands, from L’Oréal to Louis Vuitton. However, the European stock market offers additional opportunities that may be lesser known.
The above infographic, sponsored by STOXX, outlines why investors may want to consider European stocks.
Attractive Valuations
Compared to most North American and Asian markets, European stocks offer lower or comparable valuations.
| Index | Price-to-Earnings Ratio | Price-to-Book Ratio |
|---|---|---|
| EURO STOXX 50 | 14.9 | 2.2 |
| STOXX Europe 600 | 14.4 | 2 |
| U.S. | 25.9 | 4.7 |
| Canada | 16.1 | 1.8 |
| Japan | 15.4 | 1.6 |
| Asia Pacific ex. China | 17.1 | 1.8 |
Data as of February 29, 2024. See graphic for full index names. Ratios based on trailing 12 month financials. The price to earnings ratio excludes companies with negative earnings.
On average, European valuations are nearly 50% lower than U.S. valuations, potentially offering an affordable entry point for investors.
Research also shows that lower price ratios have historically led to higher long-term returns.
Market Movements Not Closely Connected
Over the last decade, the European stock market had low-to-moderate correlation with North American and Asian equities.
The below chart shows correlations from February 2014 to February 2024. A value closer to zero indicates low correlation, while a value of one would indicate that two regions are moving in perfect unison.
| EURO STOXX 50 | STOXX EUROPE 600 | U.S. | Canada | Japan | Asia Pacific ex. China |
|
|---|---|---|---|---|---|---|
| EURO STOXX 50 | 1.00 | 0.97 | 0.55 | 0.67 | 0.24 | 0.43 |
| STOXX EUROPE 600 | 1.00 | 0.56 | 0.71 | 0.28 | 0.48 | |
| U.S. | 1.00 | 0.73 | 0.12 | 0.25 | ||
| Canada | 1.00 | 0.22 | 0.40 | |||
| Japan | 1.00 | 0.88 | ||||
| Asia Pacific ex. China | 1.00 |
Data is based on daily USD returns.
European equities had relatively independent market movements from North American and Asian markets. One contributing factor could be the differing sector weights in each market. For instance, technology makes up a quarter of the U.S. market, but health care and industrials dominate the broader European market.
Ultimately, European equities can enhance portfolio diversification and have the potential to mitigate risk for investors.
Tracking the Market
For investors interested in European equities, STOXX offers a variety of flagship indices:
| Index | Description | Market Cap |
|---|---|---|
| STOXX Europe 600 | Pan-regional, broad market | €10.5T |
| STOXX Developed Europe | Pan-regional, broad-market | €9.9T |
| STOXX Europe 600 ESG-X | Pan-regional, broad market, sustainability focus | €9.7T |
| STOXX Europe 50 | Pan-regional, blue-chip | €5.1T |
| EURO STOXX 50 | Eurozone, blue-chip | €3.5T |
Data is as of February 29, 2024. Market cap is free float, which represents the shares that are readily available for public trading on stock exchanges.
The EURO STOXX 50 tracks the Eurozone’s biggest and most traded companies. It also underlies one of the world’s largest ranges of ETFs and mutual funds. As of November 2023, there were €27.3 billion in ETFs and €23.5B in mutual fund assets under management tracking the index.
“For the past 25 years, the EURO STOXX 50 has served as an accurate, reliable and tradable representation of the Eurozone equity market.”
— Axel Lomholt, General Manager at STOXX
Partnering with STOXX to Track the European Stock Market
Are you interested in European equities? STOXX can be a valuable partner:
- Comprehensive, liquid and investable ecosystem
- European heritage, global reach
- Highly sophisticated customization capabilities
- Open architecture approach to using data
- Close partnerships with clients
- Part of ISS STOXX and Deutsche Börse Group
With a full suite of indices, STOXX can help you benchmark against the European stock market.
Learn how STOXX’s European indices offer liquid and effective market access.

-

 Economy1 day ago
Economic Growth Forecasts for G7 and BRICS Countries in 2024
The IMF has released its economic growth forecasts for 2024. How do the G7 and BRICS countries compare?
-

 Markets1 week ago
U.S. Debt Interest Payments Reach $1 Trillion
U.S. debt interest payments have surged past the $1 trillion dollar mark, amid high interest rates and an ever-expanding debt burden.
-

 United States2 weeks ago
Ranked: The Largest U.S. Corporations by Number of Employees
We visualized the top U.S. companies by employees, revealing the massive scale of retailers like Walmart, Target, and Home Depot.
-

 Markets2 weeks ago
The Top 10 States by Real GDP Growth in 2023
This graphic shows the states with the highest real GDP growth rate in 2023, largely propelled by the oil and gas boom.
-

 Markets2 weeks ago
Ranked: The World’s Top Flight Routes, by Revenue
In this graphic, we show the highest earning flight routes globally as air travel continued to rebound in 2023.
-

 Markets2 weeks ago
Ranked: The Most Valuable Housing Markets in America
The U.S. residential real estate market is worth a staggering $47.5 trillion. Here are the most valuable housing markets in the country.


-

 Mining1 week ago
Gold vs. S&P 500: Which Has Grown More Over Five Years?
-
Markets2 weeks ago
Ranked: The Most Valuable Housing Markets in America
-

 Money2 weeks ago
Which States Have the Highest Minimum Wage in America?
-

 AI2 weeks ago
Ranked: Semiconductor Companies by Industry Revenue Share
-
Markets2 weeks ago
Ranked: The World’s Top Flight Routes, by Revenue
-

 Demographics2 weeks ago
Population Projections: The World’s 6 Largest Countries in 2075
-
Markets2 weeks ago
The Top 10 States by Real GDP Growth in 2023
-

 Demographics2 weeks ago
The Smallest Gender Wage Gaps in OECD Countries