Green
Which Countries Pollute the Most Ocean Plastic Waste?
Article/Editing:
Visualized: Ocean Plastic Waste Pollution By Country
Millions of metric tons of plastic are produced worldwide every year. While half of this plastic waste is recycled, incinerated, or discarded into landfills, a significant portion of what remains eventually ends up in our oceans.
In fact, many pieces of ocean plastic waste have come together to create a vortex of plastic waste thrice the size of France in the Pacific Ocean between California and Hawaii.
Where does all of this plastic come from? In this graphic, Louis Lugas Wicaksono used data from a research paper by Lourens J.J. Meijer and team to highlight the top 10 countries emitting plastic pollutants in the waters surrounding them.
Plastic’s Ocean Voyage
First, let’s talk about how this plastic waste reaches the oceans in the first place.
Most of the plastic waste found in the deep blue waters comes from the litter in parks, beaches, or along the storm drains lining our streets. These bits of plastic waste are carried into our drains, streams, and rivers by wind and rainwater runoff.
The rivers then turn into plastic superhighways, transporting the plastic to the oceans.
A large additional chunk of ocean plastic comes from damaged fishing nets or ghost nets that are directly discarded into the high seas.
Countries Feeding the Plastic Problem
Some might think that the countries producing or consuming the most plastic are the ones that pollute the oceans the most. But that’s not true.
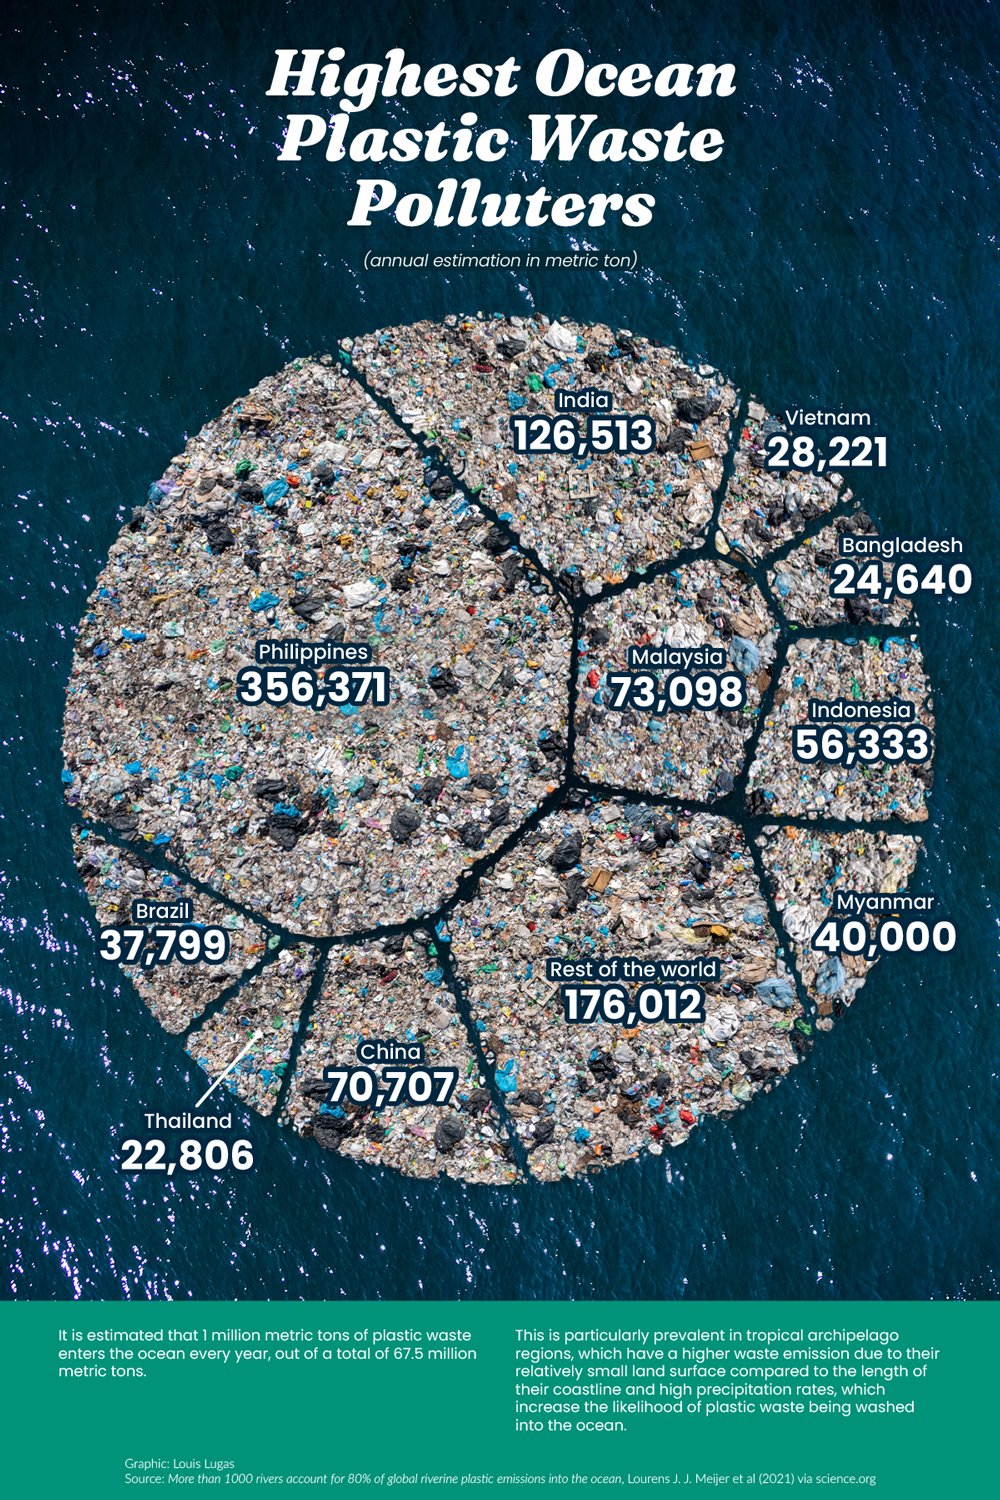
According to the study, countries with a smaller geographical area, longer coastlines, high rainfall, and poor waste management systems are more likely to wash plastics into the sea.
For example, China generates 10 times the plastic waste that Malaysia does. However, 9% of Malaysia’s total plastic waste is estimated to reach the ocean, in comparison to China’s 0.6%.
| Rank | Country | Annual Ocean Plastic Waste (Metric tons) |
|---|---|---|
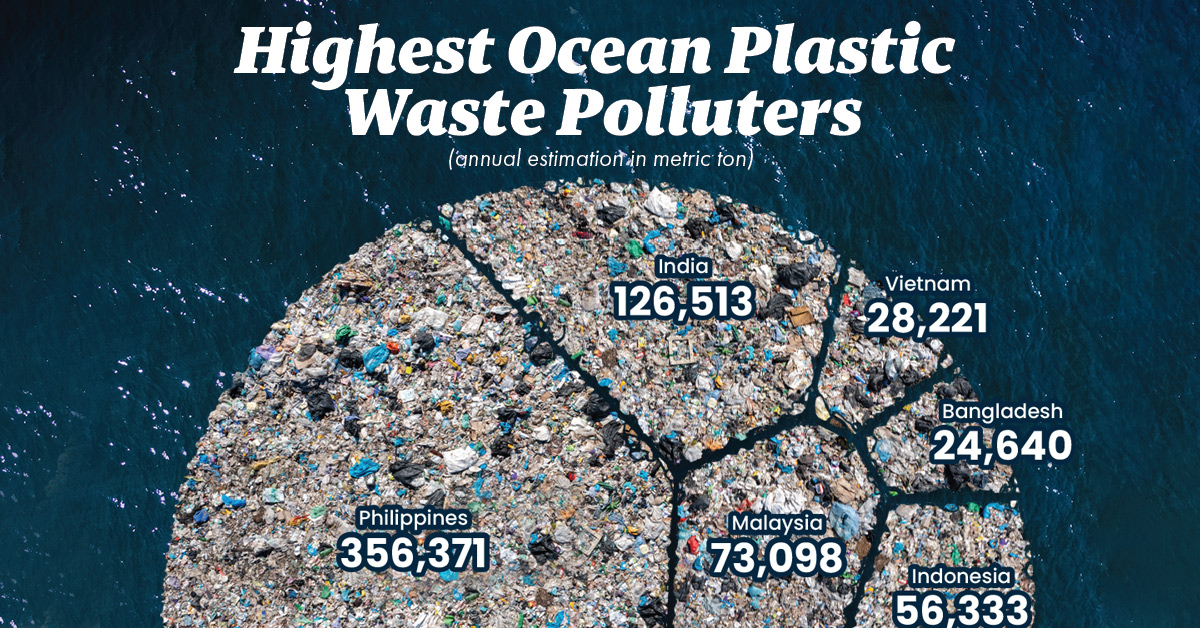
| #1 | 🇵🇭 Philippines | 356,371 |
| #2 | 🇮🇳 India | 126,513 |
| #3 | 🇲🇾 Malaysia | 73,098 |
| #4 | 🇨🇳 China | 70,707 |
| #5 | 🇮🇩 Indonesia | 56,333 |
| #6 | 🇲🇲 Myanmar | 40,000 |
| #7 | 🇧🇷 Brazil | 37,799 |
| #8 | 🇻🇳 Vietnam | 28,221 |
| #9 | 🇧🇩 Bangladesh | 24,640 |
| #10 | 🇹🇭 Thailand | 22,806 |
| 🌐 Rest of the World | 176,012 | |
| Total | 1,012,500 |
The Philippines—an archipelago of over 7,000 islands, with a 36,289 kilometer coastline and 4,820 plastic emitting rivers—is estimated to emit 35% of the ocean’s plastic.
In addition to the Philippines, over 75% of the accumulated plastic in the ocean is reported to come from the mismanaged waste in Asian countries including India, Malaysia, China, Indonesia, Myanmar, Vietnam, Bangladesh, and Thailand.
The only non-Asian country to make it to this top 10 list, with 1,240 rivers including the Amazon, is Brazil.
The Path to a Plastic-free Ocean
The first, and most obvious, way to reduce plastic accumulation is to reduce the use of plastic. Lesser production equals lesser waste.
The second step is managing the plastic waste generated, and this is where the challenge lies.
Many high-income countries generate high amounts of plastic waste, but are either better at processing it or exporting it to other countries. Meanwhile, many of the middle-income and low-income countries that both demand plastics and receive bulk exports have yet to develop the infrastructure needed to process it.

This article was published as a part of Visual Capitalist's Creator Program, which features data-driven visuals from some of our favorite Creators around the world.


Automotive
How People Get Around in America, Europe, and Asia
Examining how people get around using cars, public transit, and walking or biking, and the regional differences in usage.


How People Get Around in America, Europe, and Asia
This was originally posted on our Voronoi app. Download the app for free on iOS or Android and discover incredible data-driven charts from a variety of trusted sources.
This chart highlights the popularity of different transportation types in the Americas, Europe, and Asia, calculated by modal share.
Data for this article and visualization is sourced from ‘The ABC of Mobility’, a research paper by Rafael Prieto-Curiel (Complexity Science Hub) and Juan P. Ospina (EAFIT University), accessed through ScienceDirect.
The authors gathered their modal share data through travel surveys, which focused on the primary mode of transportation a person employs for each weekday trip. Information from 800 cities across 61 countries was collected for this study.
North American Car Culture Contrasts with the Rest of the World
In the U.S. and Canada, people heavily rely on cars to get around, no matter the size of the city. There are a few exceptions of course, such as New York, Toronto, and smaller college towns across the United States.
| Region | 🚗 Cars | 🚌 Public Transport | 🚶 Walking/Biking |
|---|---|---|---|
| North America* | 92% | 5% | 4% |
| Central America | 23% | 42% | 35% |
| South America | 29% | 40% | 31% |
| Northern Europe | 48% | 29% | 24% |
| Western Europe | 43% | 24% | 34% |
| Southern Europe | 50% | 24% | 25% |
| Eastern Europe | 35% | 40% | 25% |
| Southeastern Asia | 44% | 43% | 13% |
| Western Asia | 43% | 28% | 29% |
| Southern Asia | 22% | 39% | 39% |
| Eastern Asia | 19% | 46% | 35% |
| World | 51% | 26% | 22% |
Note: *Excluding Mexico. Percentages are rounded.
As a result, North America’s share of public transport and active mobility (walking and biking) is the lowest amongst all surveyed regions by a significant amount.
On the other hand, public transport reigns supreme in South and Central America as well as Southern and Eastern Asia. It ties with cars in Southeastern Asia, and is eclipsed by cars in Western Asia.
As outlined in the paper, Europe sees more city-level differences in transport popularity.
For example, Utrecht, Netherlands prefers walking and biking. People in Paris and London like using their extensive transit systems. And in Manchester and Rome, roughly two out of three journeys are by car.

-

 Brands5 days ago
The Evolution of U.S. Beer Logos
-

 Culture2 weeks ago
The World’s Top Media Franchises by All-Time Revenue
-

 voronoi2 weeks ago
Best Visualizations of April on the Voronoi App
-

 Wealth2 weeks ago
Charted: Which Country Has the Most Billionaires in 2024?
-

 Business1 week ago
The Top Private Equity Firms by Country
-

 Markets1 week ago
The Best U.S. Companies to Work for According to LinkedIn
-

 Economy1 week ago
Ranked: The Top 20 Countries in Debt to China
-

 Politics1 week ago
Charted: Trust in Government Institutions by G7 Countries