Markets
Mapped: The Countries With the Most Foreign Currency Reserves
The Countries With the Most Foreign Currency Reserves
In the high stakes game of international trade, holding onto a stockpile of foreign cash gives you options.
Forex reserves can help buoy the local currency or even provide much-needed insurance in the case of a national economic emergency. And when reserves are plentiful, a country can even use them to wield influence on international affairs – after all, most financial assets are simultaneously someone else’s liability.
Forex Reserves by Country
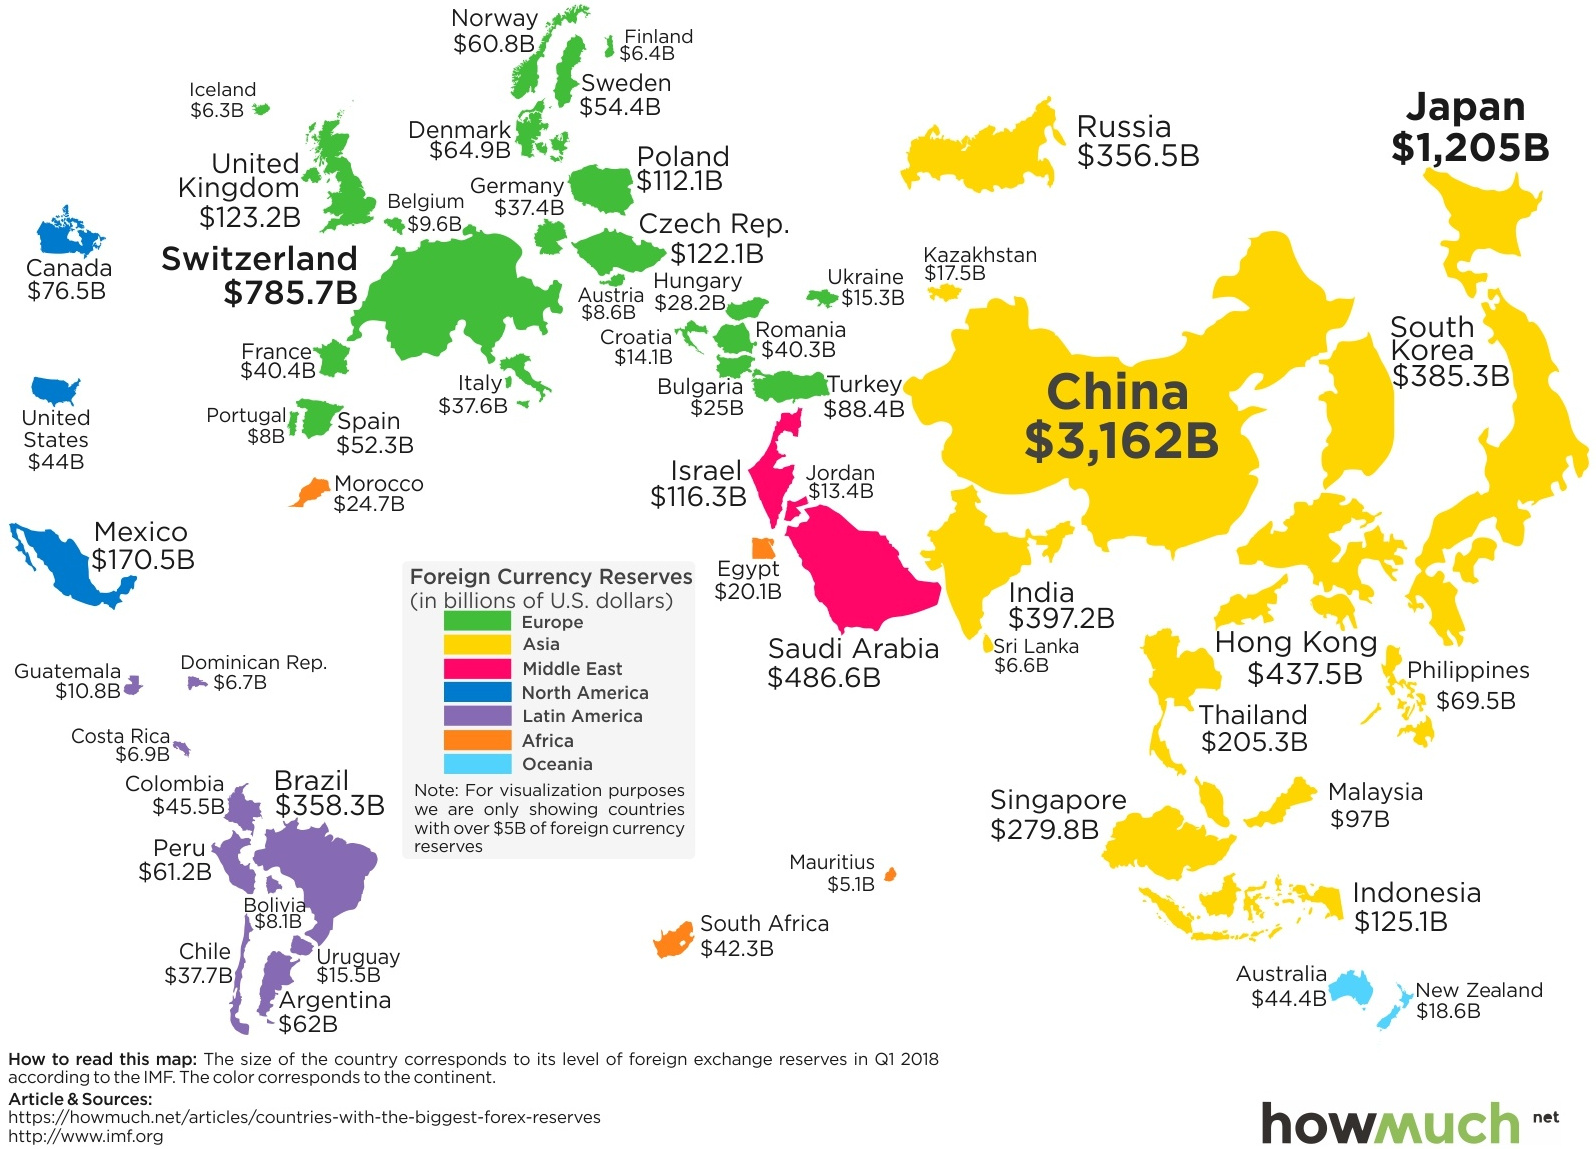
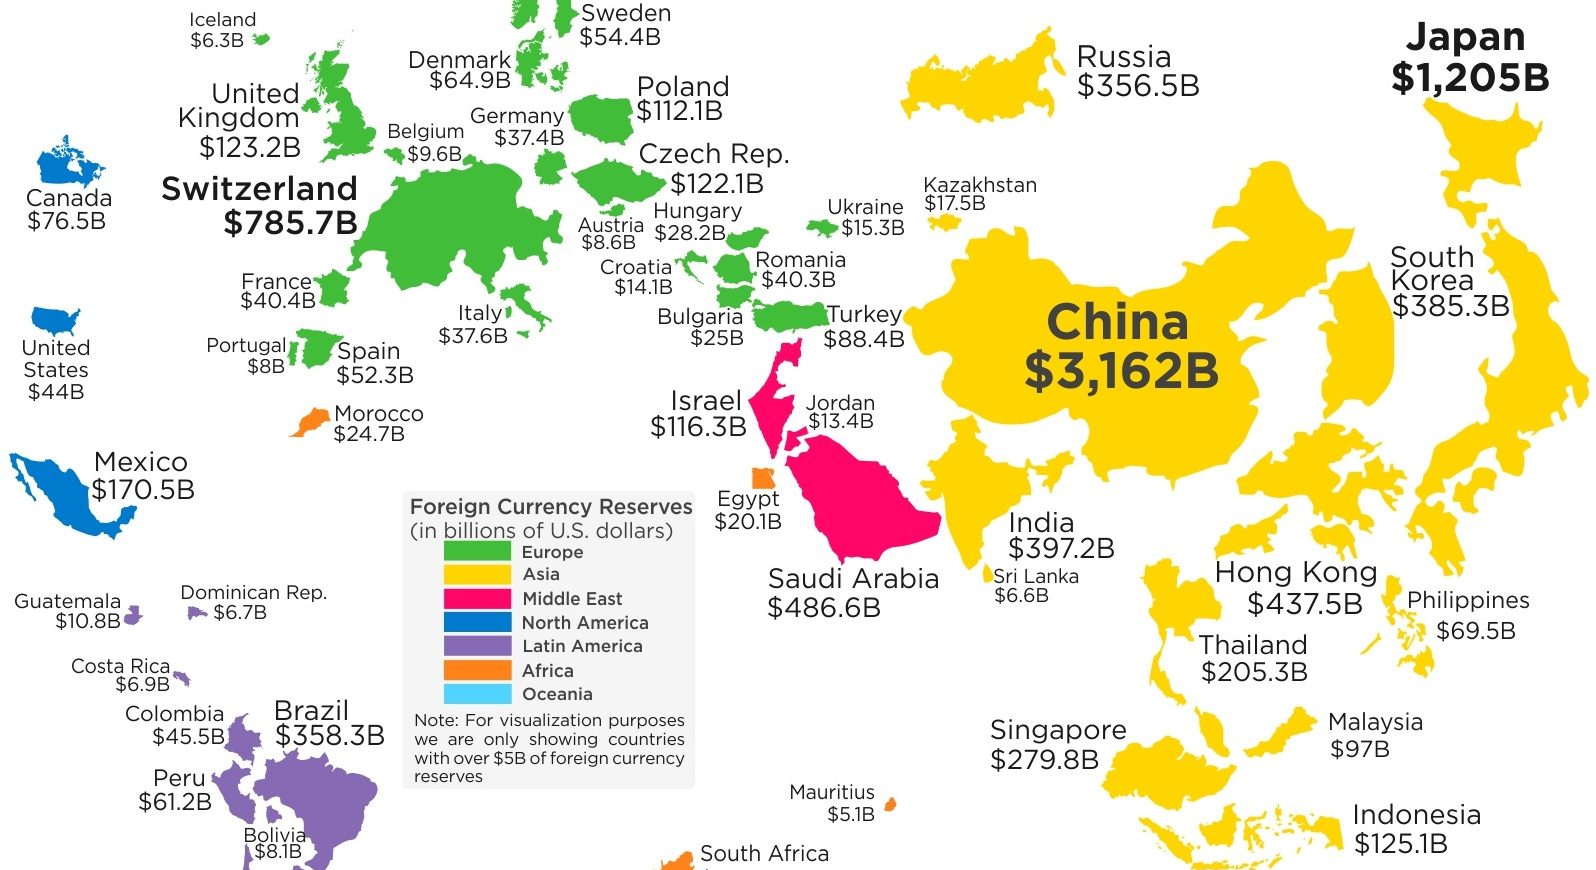
Today’s infographic comes to us from HowMuch.net, and it resizes countries on a world map based on their foreign currency reserves, according to the most recent IMF data.
Here is a list of the top 10 countries – China tops the list with a solid $3.2 trillion in reserves held:
| Rank | Country | Forex Reserves ($B) |
|---|---|---|
| #1 | China | $3,161.5 |
| #2 | Japan | $1,204.7 |
| #3 | Switzerland | $785.7 |
| #4 | Saudi Arabia | $486.6 |
| #5 | Hong Kong (China) | $437.5 |
| #6 | India | $397.2 |
| #7 | South Korea | $385.3 |
| #8 | Brazil | $358.3 |
| #9 | Russia | $356.5 |
| #10 | Singapore | $279.8 |
The first thing you may gather from this list is that major economies like the U.S. and Europe are noticeably absent, but that is because the U.S. dollar and the euro are the most common reserve currencies used in international transactions. As a result, countries such as the United States do not need to hold as many reserves.
To put this all into context, here is what central banks reported in 2017 Q3 for their foreign currency holdings:
| Rank | Reserve Currency | Global Holdings |
|---|---|---|
| #1 | U.S. Dollar | 63.5% |
| #2 | Euro | 20.0% |
| #3 | Japanese Yen | 4.5% |
| #4 | British Pound | 4.5% |
| #5 | Canadian Dollar | 2.0% |
| #6 | Aussie Dollar | 1.8% |
| #7 | Chinese Yuan | 1.1% |
| n/a | Other | 2.6% |
Interestingly, the Japanese yen has decent acceptance as a reserve currency, but the country still holds the second highest amount of foreign currency reserves ($1.2 trillion) anyways. This is partially because Japan is an export powerhouse, sending $605 billion of exports abroad every year.
Why Hold Foreign Currency Reserves?
And now, a practical question: why do these countries hold foreign currency reserves in the first place?
Here are seven reasons, as originally noted by The Balance:
- Forex reserves allow a country to maintain the value of their domestic currency at a fixed rate
- Countries with floating exchange rates can buy up foreign currencies or financial instruments to reduce the value of their domestic currency
- Forex reserves can help maintain liquidity during an economic crisis
- Reserves can provide confidence to foreign investors, showing that the central bank has the ability to take action to protect their investments
- Foreign currency reserves give a country extra insurance in meeting external payment obligations
- Forex reserves can be used to fund certain sectors, like building infrastructure
- They also provide a means of diversification, which allows central banks to reduce the risk of their overall portfolios
For a related animation, see the history of how the U.S. dollar spread across the world.


Markets
The European Stock Market: Attractive Valuations Offer Opportunities
On average, the European stock market has valuations that are nearly 50% lower than U.S. valuations. But how can you access the market?


European Stock Market: Attractive Valuations Offer Opportunities
Europe is known for some established brands, from L’Oréal to Louis Vuitton. However, the European stock market offers additional opportunities that may be lesser known.
The above infographic, sponsored by STOXX, outlines why investors may want to consider European stocks.
Attractive Valuations
Compared to most North American and Asian markets, European stocks offer lower or comparable valuations.
| Index | Price-to-Earnings Ratio | Price-to-Book Ratio |
|---|---|---|
| EURO STOXX 50 | 14.9 | 2.2 |
| STOXX Europe 600 | 14.4 | 2 |
| U.S. | 25.9 | 4.7 |
| Canada | 16.1 | 1.8 |
| Japan | 15.4 | 1.6 |
| Asia Pacific ex. China | 17.1 | 1.8 |
Data as of February 29, 2024. See graphic for full index names. Ratios based on trailing 12 month financials. The price to earnings ratio excludes companies with negative earnings.
On average, European valuations are nearly 50% lower than U.S. valuations, potentially offering an affordable entry point for investors.
Research also shows that lower price ratios have historically led to higher long-term returns.
Market Movements Not Closely Connected
Over the last decade, the European stock market had low-to-moderate correlation with North American and Asian equities.
The below chart shows correlations from February 2014 to February 2024. A value closer to zero indicates low correlation, while a value of one would indicate that two regions are moving in perfect unison.
| EURO STOXX 50 | STOXX EUROPE 600 | U.S. | Canada | Japan | Asia Pacific ex. China |
|
|---|---|---|---|---|---|---|
| EURO STOXX 50 | 1.00 | 0.97 | 0.55 | 0.67 | 0.24 | 0.43 |
| STOXX EUROPE 600 | 1.00 | 0.56 | 0.71 | 0.28 | 0.48 | |
| U.S. | 1.00 | 0.73 | 0.12 | 0.25 | ||
| Canada | 1.00 | 0.22 | 0.40 | |||
| Japan | 1.00 | 0.88 | ||||
| Asia Pacific ex. China | 1.00 |
Data is based on daily USD returns.
European equities had relatively independent market movements from North American and Asian markets. One contributing factor could be the differing sector weights in each market. For instance, technology makes up a quarter of the U.S. market, but health care and industrials dominate the broader European market.
Ultimately, European equities can enhance portfolio diversification and have the potential to mitigate risk for investors.
Tracking the Market
For investors interested in European equities, STOXX offers a variety of flagship indices:
| Index | Description | Market Cap |
|---|---|---|
| STOXX Europe 600 | Pan-regional, broad market | €10.5T |
| STOXX Developed Europe | Pan-regional, broad-market | €9.9T |
| STOXX Europe 600 ESG-X | Pan-regional, broad market, sustainability focus | €9.7T |
| STOXX Europe 50 | Pan-regional, blue-chip | €5.1T |
| EURO STOXX 50 | Eurozone, blue-chip | €3.5T |
Data is as of February 29, 2024. Market cap is free float, which represents the shares that are readily available for public trading on stock exchanges.
The EURO STOXX 50 tracks the Eurozone’s biggest and most traded companies. It also underlies one of the world’s largest ranges of ETFs and mutual funds. As of November 2023, there were €27.3 billion in ETFs and €23.5B in mutual fund assets under management tracking the index.
“For the past 25 years, the EURO STOXX 50 has served as an accurate, reliable and tradable representation of the Eurozone equity market.”
— Axel Lomholt, General Manager at STOXX
Partnering with STOXX to Track the European Stock Market
Are you interested in European equities? STOXX can be a valuable partner:
- Comprehensive, liquid and investable ecosystem
- European heritage, global reach
- Highly sophisticated customization capabilities
- Open architecture approach to using data
- Close partnerships with clients
- Part of ISS STOXX and Deutsche Börse Group
With a full suite of indices, STOXX can help you benchmark against the European stock market.
Learn how STOXX’s European indices offer liquid and effective market access.

-

 Economy2 days ago
Economic Growth Forecasts for G7 and BRICS Countries in 2024
The IMF has released its economic growth forecasts for 2024. How do the G7 and BRICS countries compare?
-

 Markets1 week ago
U.S. Debt Interest Payments Reach $1 Trillion
U.S. debt interest payments have surged past the $1 trillion dollar mark, amid high interest rates and an ever-expanding debt burden.
-

 United States2 weeks ago
Ranked: The Largest U.S. Corporations by Number of Employees
We visualized the top U.S. companies by employees, revealing the massive scale of retailers like Walmart, Target, and Home Depot.
-

 Markets2 weeks ago
The Top 10 States by Real GDP Growth in 2023
This graphic shows the states with the highest real GDP growth rate in 2023, largely propelled by the oil and gas boom.
-

 Markets2 weeks ago
Ranked: The World’s Top Flight Routes, by Revenue
In this graphic, we show the highest earning flight routes globally as air travel continued to rebound in 2023.
-

 Markets3 weeks ago
Ranked: The Most Valuable Housing Markets in America
The U.S. residential real estate market is worth a staggering $47.5 trillion. Here are the most valuable housing markets in the country.


-

 Misc1 week ago
How Hard Is It to Get Into an Ivy League School?
-

 Technology2 weeks ago
Ranked: Semiconductor Companies by Industry Revenue Share
-
Markets2 weeks ago
Ranked: The World’s Top Flight Routes, by Revenue
-

 Countries2 weeks ago
Population Projections: The World’s 6 Largest Countries in 2075
-
Markets2 weeks ago
The Top 10 States by Real GDP Growth in 2023
-

 Demographics2 weeks ago
The Smallest Gender Wage Gaps in OECD Countries
-

 United States2 weeks ago
Where U.S. Inflation Hit the Hardest in March 2024
-

 Green2 weeks ago
Top Countries By Forest Growth Since 2001