Green
The Emissions Impact of Coronavirus Lockdowns, As Shown by Satellites
The Emissions Impact of Coronavirus Lockdowns
There’s a high chance you’re reading this while practicing social distancing, or while your corner of the world is under some type of advised or enforced lockdown.
While these are necessary measures to contain the spread of the COVID-19 pandemic, such economic interruption is unprecedented in many ways—resulting in some surprising side effects.
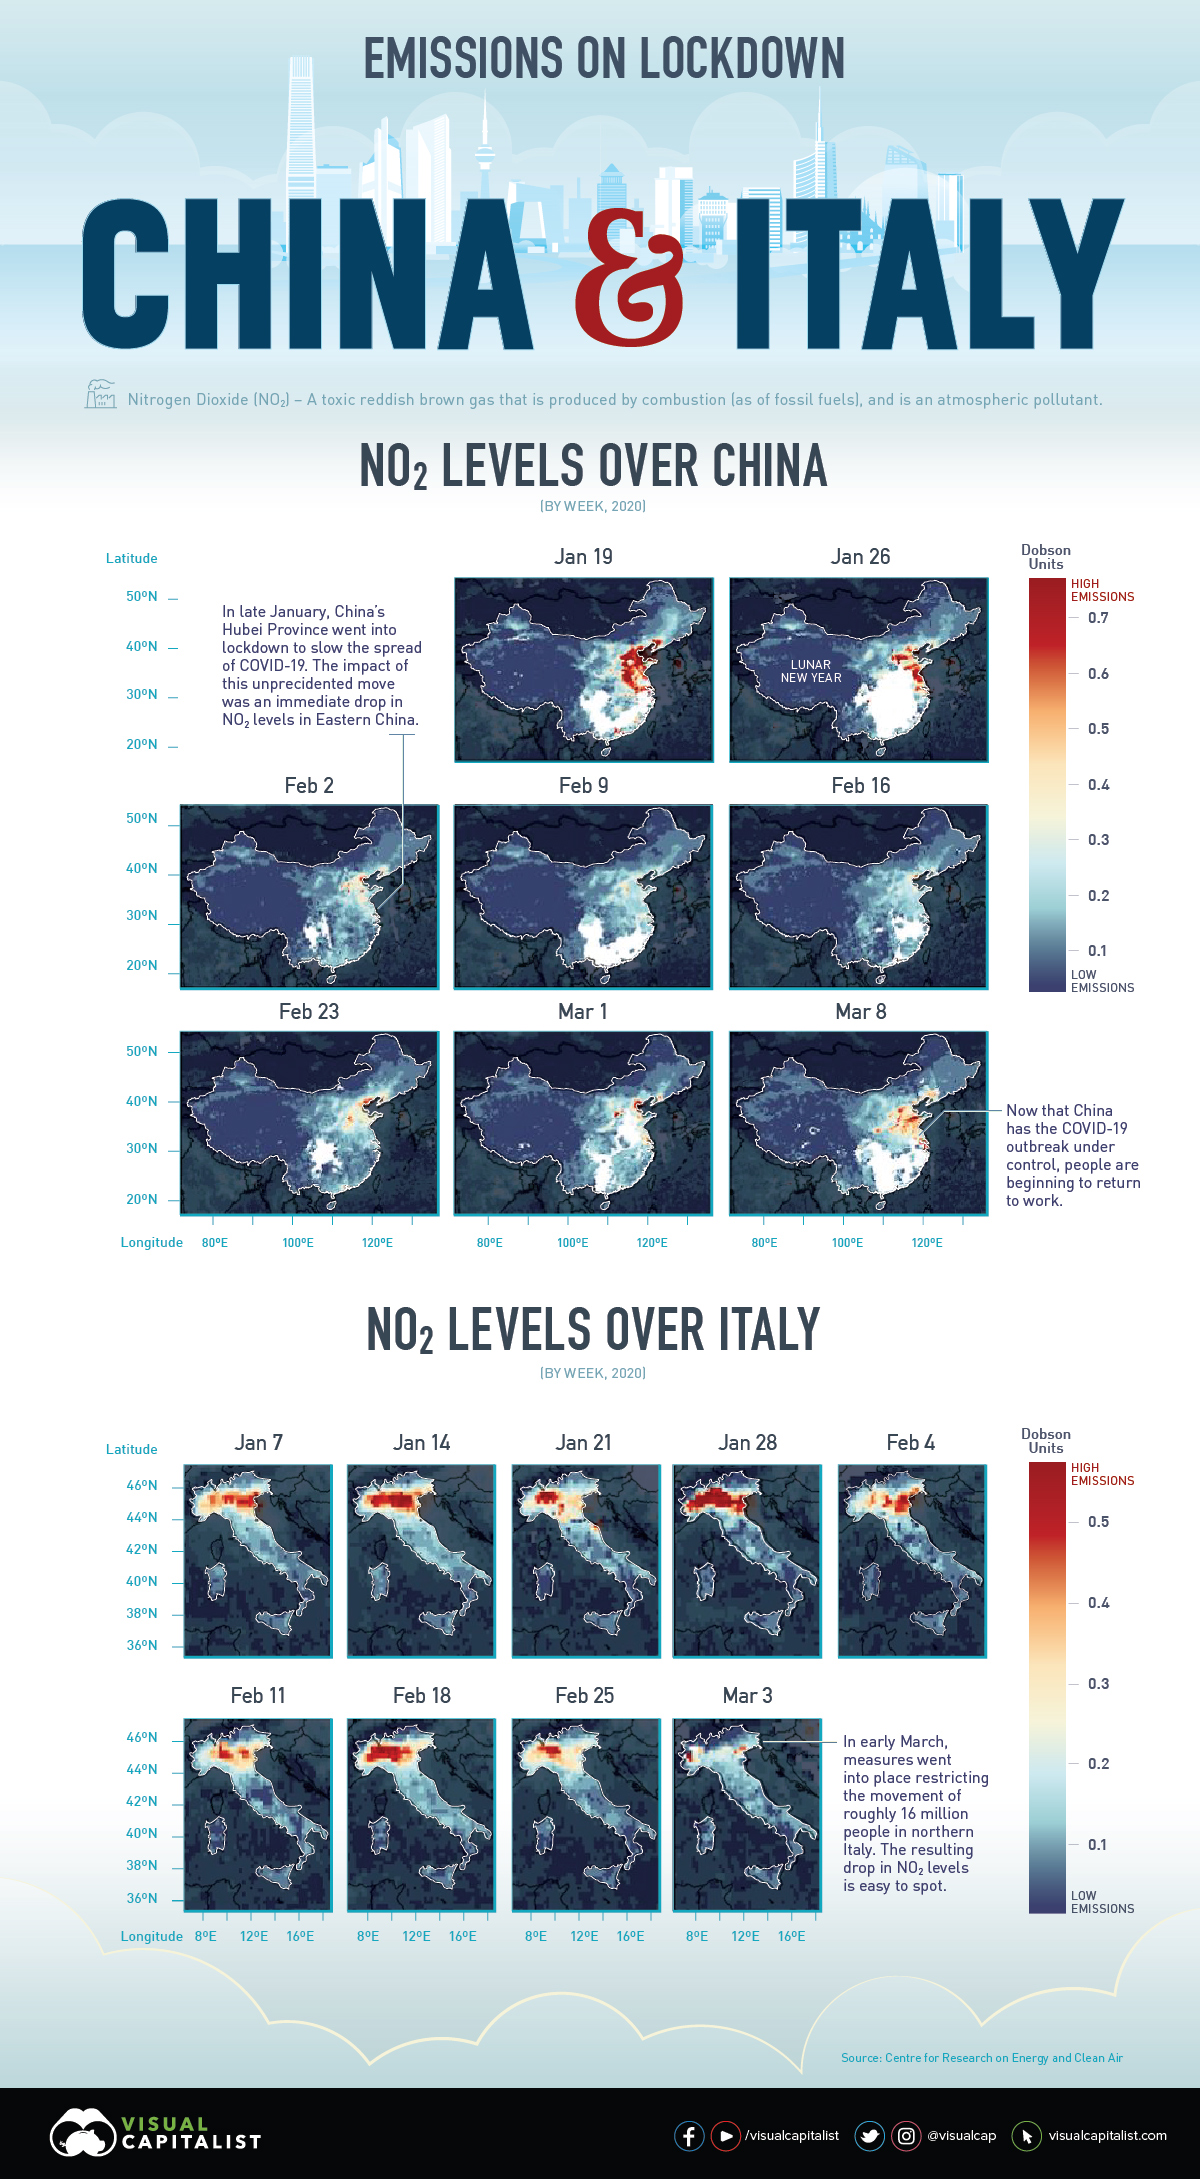
The Evidence is in NO₂ Emissions
Nitrogen dioxide (NO₂) emissions, a major air pollutant, are closely linked to factory output and vehicles operating on the road.
As both industry and transport come to a halt during this pandemic, NO₂ emissions can be a good indicator of global economic activity—and the changes are visible from space.
These images from the Centre for Research on Energy and Clean Air (CREA), as well as satellite footage from NASA and the European Space Agency (ESA), show a drastic decline in NO₂ emissions over recent months, particularly across Italy and China.
NO₂ Emissions Across Italy
In Italy, the number of active COVID-19 cases has surpassed China (including the death toll). Amid emergency actions to lock down the entire nation, everything from schools and shops, to restaurants and even some churches, are closed.
Italy is also an industrial hub, with the sector accounting for nearly 24% of GDP. With many Italians urged to work from home if possible, visible economic activity has dropped considerably.
This 10-day moving average animation (from January 1st—March 11th, 2020) of nitrogen dioxide emissions across Europe clearly demonstrates how the drop in Italy’s economic activity has impacted the environment.
Source: European Space Agency (ESA)
That’s not all: a drop in boat traffic also means that Venice’s canals are clear for the time being, as small fish have begun inhabiting the waterways again. Experts are cautious to note that this does not necessarily mean the water quality is better.
NO₂ Emissions Across China
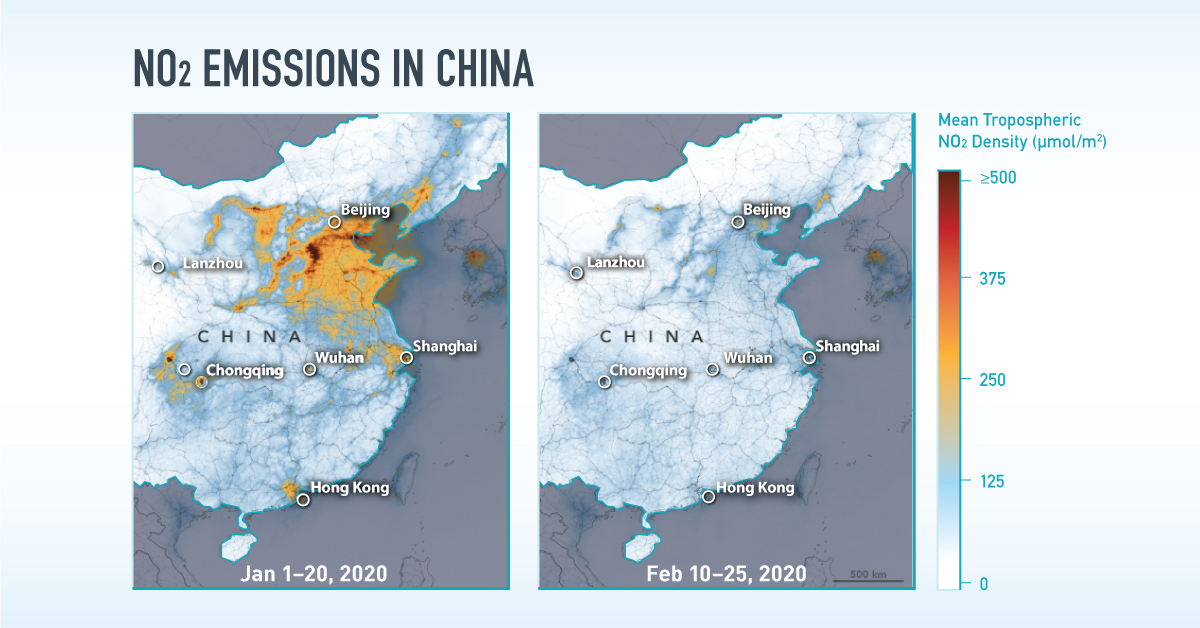
The emissions changes above China are possibly even more obvious to the eye. China is the world’s most important manufacturing hub and a significant contributor to greenhouse gases globally. But in the month following Lunar New Year (a week-long festival in early February), satellite imagery painted a different picture.
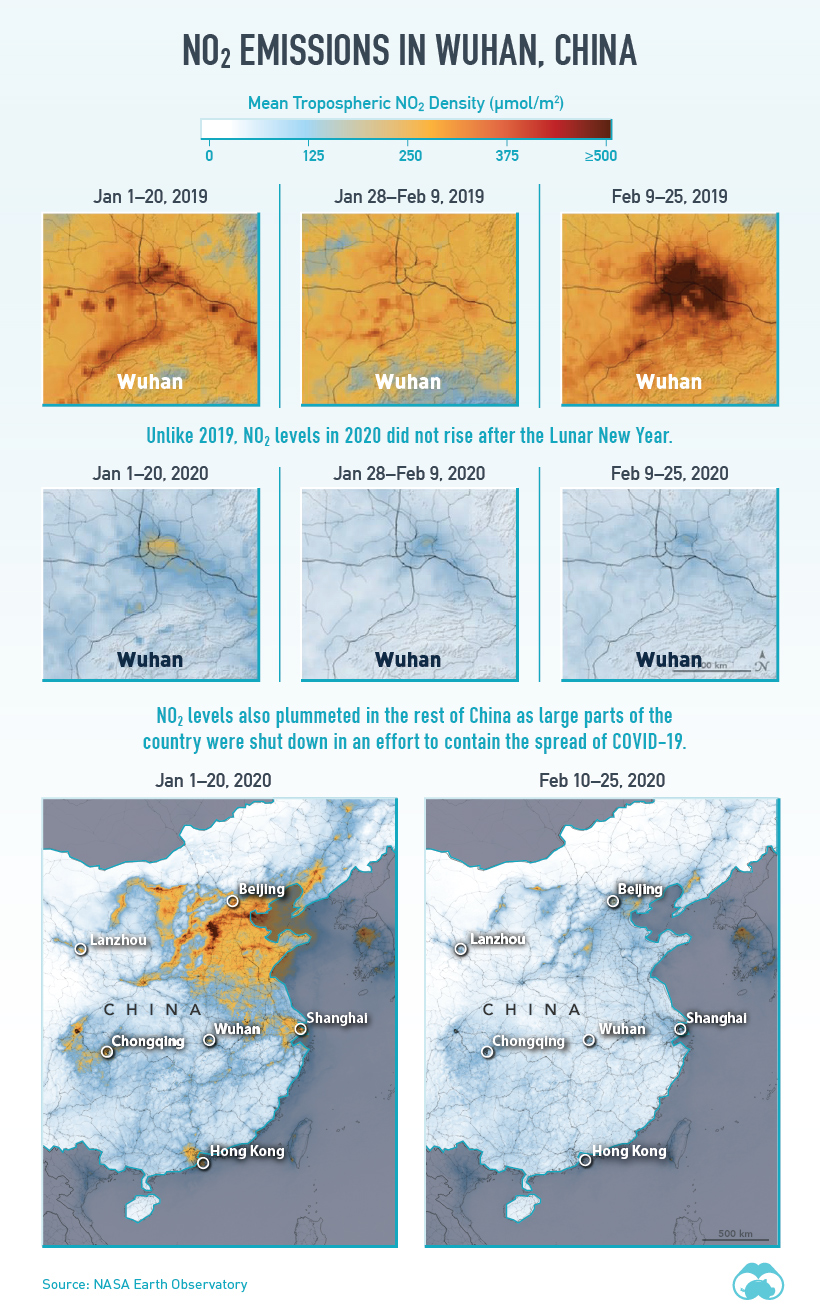
Source: NASA Earth Observatory
NO₂ emissions around the Hubei province, the original epicenter of the virus, steeply dropped as factories were forced to shutter their doors for the time being.
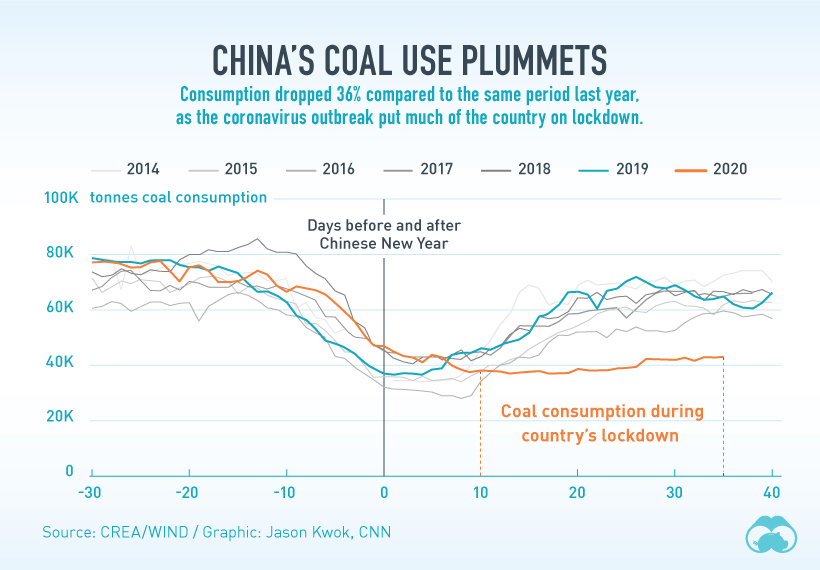
What’s more, there were measurable effects in the decline of other emission types from the drop in coal use during the same time, compared to years prior.
Back to the Status Quo?
In recent weeks, China has been able to flatten the curve of its total COVID-19 cases. As a result, the government is beginning to ease its restrictions—and it’s clear that social and economic activities are starting to pick back up in March.
Source: European Space Agency (ESA)
With the regular chain of events beginning to resume, it remains to be seen whether NO₂ emissions will rebound right back to their pre-pandemic levels.
This bounce-back effect—which can sometimes reverse any overall drop in emissions—is [called] “revenge pollution”. And in China, it has precedent.
—Li Shuo, Senior climate policy advisor, Greenpeace East Asia


Green
The Carbon Footprint of Major Travel Methods
Going on a cruise ship and flying domestically are the most carbon-intensive travel methods.


The Carbon Footprint of Major Travel Methods
This was originally posted on our Voronoi app. Download the app for free on iOS or Android and discover incredible data-driven charts from a variety of trusted sources.
Did you know that transport accounts for nearly one-quarter of global energy-related carbon dioxide (CO₂) emissions?
This graphic illustrates the carbon footprints of major travel methods measured in grams of carbon dioxide equivalent (CO₂e) emitted per person to travel one kilometer. This includes both CO₂ and other greenhouse gases.
Data is sourced from Our World in Data, the UK Government’s Department for Energy Security and Net Zero, and The International Council on Clean Transportation, as of December 2022.
These figures should be interpreted as approximations, rather than exact numbers. There are many variables at play that determine the actual carbon footprint in any individual case, including vehicle type or model, occupancy, energy mix, and even weather.
Cruise Ships are the Most Carbon-Intensive Travel Method
According to these estimates, taking a cruise ship, flying domestically, and driving alone are some of the most carbon-intensive travel methods.
Cruise ships typically use heavy fuel oil, which is high in carbon content. The average cruise ship weighs between 70,000 to 180,000 metric tons, meaning they require large engines to get moving.
These massive vessels must also generate power for onboard amenities such as lighting, air conditioning, and entertainment systems.
Short-haul flights are also considered carbon-intensive due to the significant amount of fuel consumed during initial takeoff and climbing altitude, relative to a lower amount of cruising.
| Transportation method | CO₂ equivalent emissions per passenger km |
|---|---|
| Cruise Ship | 250 |
| Short-haul flight (i.e. within a U.S. state or European country) | 246 |
| Diesel car | 171 |
| Gas car | 170 |
| Medium-haul flight (i.e. international travel within Europe, or between U.S. states) | 151 |
| Long-haul flight (over 3,700 km, about the distance from LA to NY) | 147 |
| Motorbike | 113 |
| Bus (average) | 96 |
| Plug-in hybrid | 68 |
| Electric car | 47 |
| National rail | 35 |
| Tram | 28 |
| London Underground | 27 |
| Ferry (foot passenger) | 19 |
| Eurostar (International rail) | 4.5 |
Are EVs Greener?
Many experts agree that EVs produce a lower carbon footprint over time versus traditional internal combustion engine (ICE) vehicles.
However, the batteries in electric vehicles charge on the power that comes straight off the electrical grid—which in many places may be powered by fossil fuels. For that reason, the carbon footprint of an EV will depend largely on the blend of electricity sources used for charging.
There are also questions about how energy-intensive it is to build EVs compared to a comparable ICE vehicle.

-

 Economy6 days ago
The Most Valuable Companies in Major EU Economies
-

 Wealth2 weeks ago
Charted: Which City Has the Most Billionaires in 2024?
-

 Technology2 weeks ago
All of the Grants Given by the U.S. CHIPS Act
-

 Green2 weeks ago
The Carbon Footprint of Major Travel Methods
-

 United States1 week ago
Visualizing the Most Common Pets in the U.S.
-

 Culture1 week ago
The World’s Top Media Franchises by All-Time Revenue
-

 Best of1 week ago
Best Visualizations of April on the Voronoi App
-

 Wealth1 week ago
Charted: Which Country Has the Most Billionaires in 2024?