Markets
The 10 Companies That Dominate the Global Arms Trade
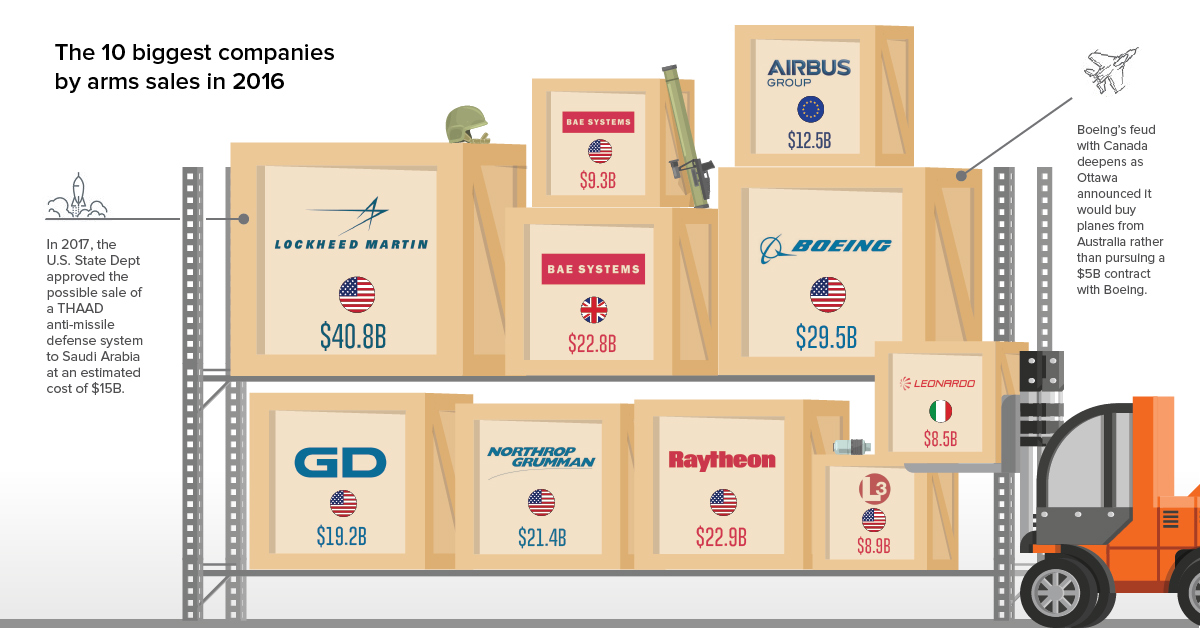
The 10 Companies That Dominate the Global Arms Trade
The Chart of the Week is a weekly Visual Capitalist feature on Fridays.
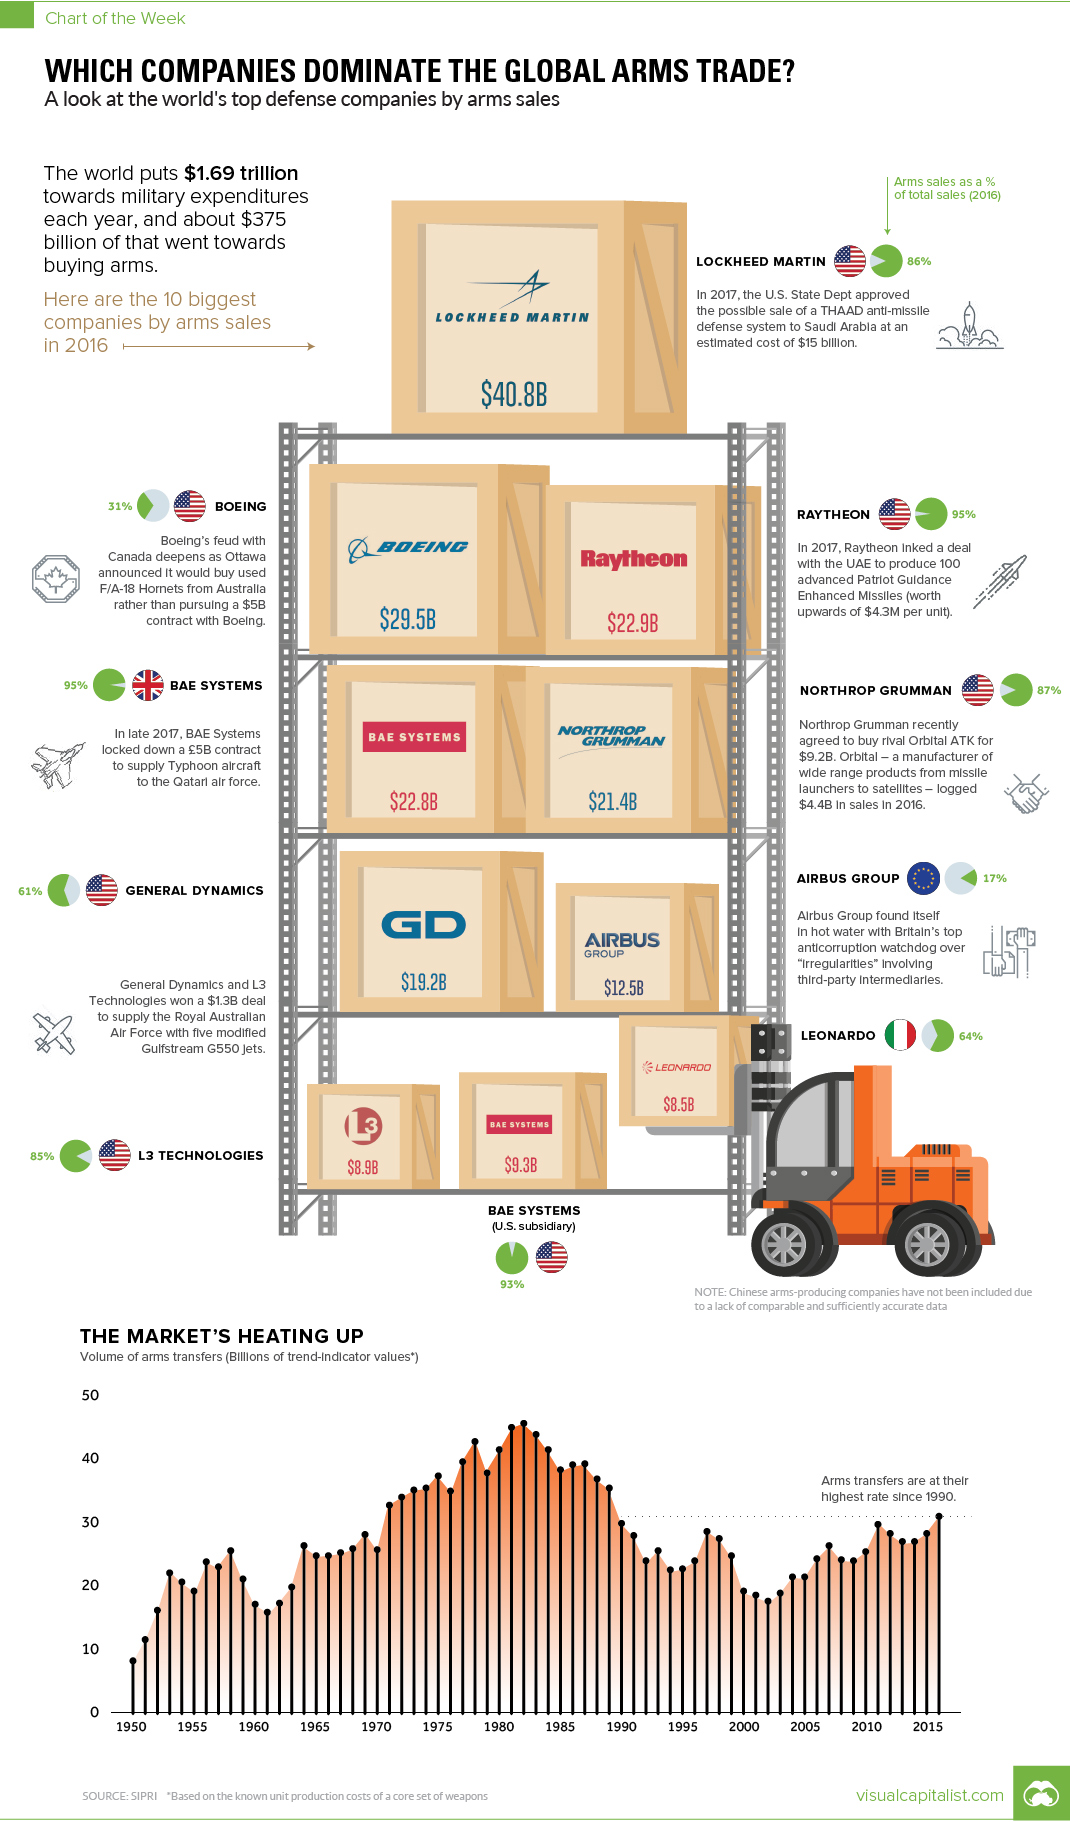
The world puts $1.69 trillion towards military expenditures per year, and about $375 billion of that goes towards buying arms specifically.
Whether it is guns, tanks, jets, missiles, or ships that are on your shopping list, in the international arms community, there is a supplier for any weapon your country desires.
Arms dealers, by sales
Today’s chart organizes the world’s top arms companies by sales, location, and arms as a percentage of sales:
| Rank | Company | Country | Arms sales (2016) | Arms as % of sales |
|---|---|---|---|---|
| #1 | Lockheed Martin | USA | $40.8B | 86% |
| #2 | Boeing | USA | $29.5B | 31% |
| #3 | Raytheon | USA | $22.9B | 95% |
| #4 | BAE Systems | UK | $22.8B | 95% |
| #5 | Northrop Grumman | USA | $21.4B | 87% |
| #6 | General Dynamics | USA | $19.2B | 61% |
| #7 | Airbus Group | EU | $12.5B | 17% |
| #8 | BAE Systems (U.S.) | USA | $9.3B | 93% |
| #9 | L3 Technologies | USA | $8.9B | 85% |
| #10 | Leonardo | Italy | $8.5B | 64% |
Note: Airbus considers itself a European company. It’s registered in the Netherlands, and its main HQ is in France.
The above data comes courtesy of the Stockholm International Peace Research Institute (SIPRI), which tracks arms deals and companies extensively.
USA, USA!
While it is common knowledge that the United States plays a big role in the global arms trade, the numbers are still quite astounding.
Of the top ten companies by sales, firms based in the U.S. make up seven of them. That includes the clear #1, Lockheed Martin, which had $40.8 billion in arms-related sales in 2016, as well as the remaining constituents of the top three: Boeing and Raytheon.
Further, on SIPRI’s wider top 100 list, a good proxy for total arms sales globally, U.S. defense companies accounted for a whopping 58% of total global arms sales. That adds up to $217.2 billion in 2016, a 4.0% rise over the previous year.
Rounding Out the Top 10
Only three companies make the top 10 leaderboard from outside of the United States.
That group includes Airbus, the massive European commercial airline manufacturer that gets 17% of its sales from arms-related deals, as well as BAE Systems (U.K.) and Leonardo (Italy).
As a final caveat, it’s worth mentioning that SIPRI notes that some Chinese companies would likely make its Top 100 list as well – but for now, the list excludes Chinese companies as the available data is not comparable or accurate.


Markets
The European Stock Market: Attractive Valuations Offer Opportunities
On average, the European stock market has valuations that are nearly 50% lower than U.S. valuations. But how can you access the market?


European Stock Market: Attractive Valuations Offer Opportunities
Europe is known for some established brands, from L’Oréal to Louis Vuitton. However, the European stock market offers additional opportunities that may be lesser known.
The above infographic, sponsored by STOXX, outlines why investors may want to consider European stocks.
Attractive Valuations
Compared to most North American and Asian markets, European stocks offer lower or comparable valuations.
| Index | Price-to-Earnings Ratio | Price-to-Book Ratio |
|---|---|---|
| EURO STOXX 50 | 14.9 | 2.2 |
| STOXX Europe 600 | 14.4 | 2 |
| U.S. | 25.9 | 4.7 |
| Canada | 16.1 | 1.8 |
| Japan | 15.4 | 1.6 |
| Asia Pacific ex. China | 17.1 | 1.8 |
Data as of February 29, 2024. See graphic for full index names. Ratios based on trailing 12 month financials. The price to earnings ratio excludes companies with negative earnings.
On average, European valuations are nearly 50% lower than U.S. valuations, potentially offering an affordable entry point for investors.
Research also shows that lower price ratios have historically led to higher long-term returns.
Market Movements Not Closely Connected
Over the last decade, the European stock market had low-to-moderate correlation with North American and Asian equities.
The below chart shows correlations from February 2014 to February 2024. A value closer to zero indicates low correlation, while a value of one would indicate that two regions are moving in perfect unison.
| EURO STOXX 50 | STOXX EUROPE 600 | U.S. | Canada | Japan | Asia Pacific ex. China |
|
|---|---|---|---|---|---|---|
| EURO STOXX 50 | 1.00 | 0.97 | 0.55 | 0.67 | 0.24 | 0.43 |
| STOXX EUROPE 600 | 1.00 | 0.56 | 0.71 | 0.28 | 0.48 | |
| U.S. | 1.00 | 0.73 | 0.12 | 0.25 | ||
| Canada | 1.00 | 0.22 | 0.40 | |||
| Japan | 1.00 | 0.88 | ||||
| Asia Pacific ex. China | 1.00 |
Data is based on daily USD returns.
European equities had relatively independent market movements from North American and Asian markets. One contributing factor could be the differing sector weights in each market. For instance, technology makes up a quarter of the U.S. market, but health care and industrials dominate the broader European market.
Ultimately, European equities can enhance portfolio diversification and have the potential to mitigate risk for investors.
Tracking the Market
For investors interested in European equities, STOXX offers a variety of flagship indices:
| Index | Description | Market Cap |
|---|---|---|
| STOXX Europe 600 | Pan-regional, broad market | €10.5T |
| STOXX Developed Europe | Pan-regional, broad-market | €9.9T |
| STOXX Europe 600 ESG-X | Pan-regional, broad market, sustainability focus | €9.7T |
| STOXX Europe 50 | Pan-regional, blue-chip | €5.1T |
| EURO STOXX 50 | Eurozone, blue-chip | €3.5T |
Data is as of February 29, 2024. Market cap is free float, which represents the shares that are readily available for public trading on stock exchanges.
The EURO STOXX 50 tracks the Eurozone’s biggest and most traded companies. It also underlies one of the world’s largest ranges of ETFs and mutual funds. As of November 2023, there were €27.3 billion in ETFs and €23.5B in mutual fund assets under management tracking the index.
“For the past 25 years, the EURO STOXX 50 has served as an accurate, reliable and tradable representation of the Eurozone equity market.”
— Axel Lomholt, General Manager at STOXX
Partnering with STOXX to Track the European Stock Market
Are you interested in European equities? STOXX can be a valuable partner:
- Comprehensive, liquid and investable ecosystem
- European heritage, global reach
- Highly sophisticated customization capabilities
- Open architecture approach to using data
- Close partnerships with clients
- Part of ISS STOXX and Deutsche Börse Group
With a full suite of indices, STOXX can help you benchmark against the European stock market.
Learn how STOXX’s European indices offer liquid and effective market access.

-

 Economy2 days ago
Economic Growth Forecasts for G7 and BRICS Countries in 2024
The IMF has released its economic growth forecasts for 2024. How do the G7 and BRICS countries compare?
-

 Markets2 weeks ago
U.S. Debt Interest Payments Reach $1 Trillion
U.S. debt interest payments have surged past the $1 trillion dollar mark, amid high interest rates and an ever-expanding debt burden.
-

 United States2 weeks ago
Ranked: The Largest U.S. Corporations by Number of Employees
We visualized the top U.S. companies by employees, revealing the massive scale of retailers like Walmart, Target, and Home Depot.
-

 Markets2 weeks ago
The Top 10 States by Real GDP Growth in 2023
This graphic shows the states with the highest real GDP growth rate in 2023, largely propelled by the oil and gas boom.
-

 Markets2 weeks ago
Ranked: The World’s Top Flight Routes, by Revenue
In this graphic, we show the highest earning flight routes globally as air travel continued to rebound in 2023.
-

 Markets3 weeks ago
Ranked: The Most Valuable Housing Markets in America
The U.S. residential real estate market is worth a staggering $47.5 trillion. Here are the most valuable housing markets in the country.

-

 Debt1 week ago
How Debt-to-GDP Ratios Have Changed Since 2000
-
Markets2 weeks ago
Ranked: The World’s Top Flight Routes, by Revenue
-

 Demographics2 weeks ago
Population Projections: The World’s 6 Largest Countries in 2075
-
Markets2 weeks ago
The Top 10 States by Real GDP Growth in 2023
-

 Demographics2 weeks ago
The Smallest Gender Wage Gaps in OECD Countries
-

 Economy2 weeks ago
Where U.S. Inflation Hit the Hardest in March 2024
-

 Green2 weeks ago
Top Countries By Forest Growth Since 2001
-
United States2 weeks ago
Ranked: The Largest U.S. Corporations by Number of Employees