Markets
The Numbers Behind the World’s Closest Trade Relationship

Numbers Behind the World’s Closest Trade Relationship
Whether we’re discussing the ancient merchants that traversed the legendary Silk Road, or the transfer of goods across modern border lines, trade has always been about building close relationships.
There are many examples of strong and mutually-beneficial trade relationships all throughout history, but one doesn’t have to look far back to find what could be considered the closest bilateral relationship ever known: the one between the United States and Canada.
These two countries are each other’s best customers, and they share the world’s longest international border (5,525 miles long). They are both Western democracies with shared cultural heritage and similar standards of living – and each day, the two countries exchange a whopping US$1.7 billion in goods and services.
Our infographic today highlights numbers and tangible examples behind this lengthy relationship between the U.S. and Canada.
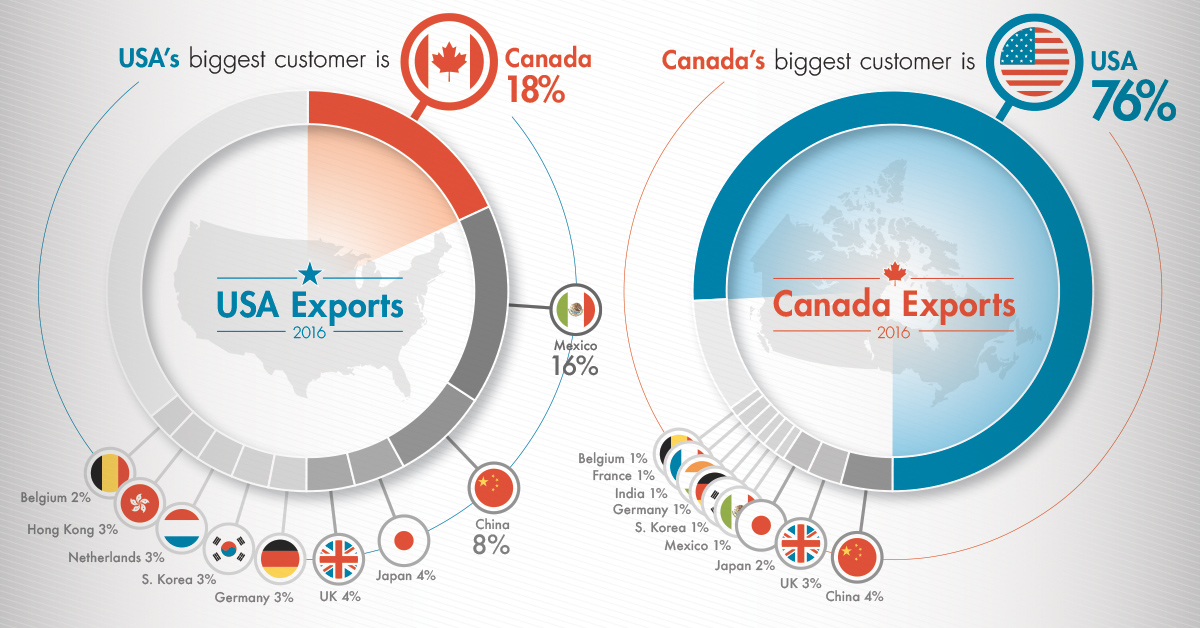
America’s Best Customer
Despite China surpassing Canada in 2015 to become America’s largest trading partner in aggregate, the majority of Chinese trade comes in the form of imports ($462B imports vs. $115B exports). That means China is actually only the third-largest customer of American-made goods, buying about 8% of total U.S. exports in 2016.
The largest buyer of American goods is still north of the border – in fact, Canadians buy about 18% of total U.S. exports, which is more than twice that of China.
Here’s what Canada buys from the U.S.:
| Rank | Goods | Value ($US) |
|---|---|---|
| #1 | Vehicles & Auto Parts | $48.1 billion |
| #2 | Machinery | $40.0 billion |
| #3 | Electronic equipment | $23.9 billion |
| #4 | Mineral fuels including oil | $15.5 billion |
| #5 | Plastics | $12.3 billion |
| #6 | Live trees and plants | $9.0 billion |
| #7 | Medical, technical equipment | $8.1 billion |
| #8 | Aircraft, spacecraft | $7.4 billion |
| #9 | Iron or steel products | $5.5 billion |
| #10 | Furniture, lighting, signs | $4.9 billion |
Canada is the most important international customer for 36 states – and every day the equivalent trade of all U.S./Japan happens over just one bridge (Ambassador Bridge) between Detroit, MI and Windsor, ON.
Canada’s Best Customer
Americans return the favor in a big way: an incredible 76% of Canadian exports are bought by Americans.
Here’s what the U.S. buys from Canada:
| Rank | Goods | Value ($US) |
|---|---|---|
| #1 | Vehicles & Auto Parts | $60.1 billion |
| #2 | Mineral fuels including oil | $57.6 billion |
| #3 | Machinery | $22.3 billion |
| #4 | Live trees and plants | $18.9 billion |
| #5 | Plastics | $10.9 billion |
| #6 | Wood | $10.1 billion |
| #7 | Electronic equipment | $9.4 billion |
| #8 | Gems, precious metals | $7.3 billion |
| #9 | Aluminum | $7.0 billion |
| #10 | Paper | $6.1 billion |
It’s estimated that 78% of Canadian exports to the U.S. are raw materials, parts and components, and services used to create other goods in the United States.
Close Ties
Through many years of trade, the supply chains between the two countries have become highly integrated.
Much of the time, the U.S. is buying raw materials and intermediate goods, which get used in final products destined for domestic and global markets. Many of those even get sold directly back to Canada.
This could be buying Canadian crude to reduce reliance on OPEC, importing low cost hydro electricity during times of heavy rainfall, or using Canada’s steady supply of aluminum to make more environmentally sound vehicles.
Few countries in the world have this kind of economic interdependence – and the history, integration, and value of goods traded makes this arguably the world’s closest bilateral trade relationship.


Markets
The European Stock Market: Attractive Valuations Offer Opportunities
On average, the European stock market has valuations that are nearly 50% lower than U.S. valuations. But how can you access the market?


European Stock Market: Attractive Valuations Offer Opportunities
Europe is known for some established brands, from L’Oréal to Louis Vuitton. However, the European stock market offers additional opportunities that may be lesser known.
The above infographic, sponsored by STOXX, outlines why investors may want to consider European stocks.
Attractive Valuations
Compared to most North American and Asian markets, European stocks offer lower or comparable valuations.
| Index | Price-to-Earnings Ratio | Price-to-Book Ratio |
|---|---|---|
| EURO STOXX 50 | 14.9 | 2.2 |
| STOXX Europe 600 | 14.4 | 2 |
| U.S. | 25.9 | 4.7 |
| Canada | 16.1 | 1.8 |
| Japan | 15.4 | 1.6 |
| Asia Pacific ex. China | 17.1 | 1.8 |
Data as of February 29, 2024. See graphic for full index names. Ratios based on trailing 12 month financials. The price to earnings ratio excludes companies with negative earnings.
On average, European valuations are nearly 50% lower than U.S. valuations, potentially offering an affordable entry point for investors.
Research also shows that lower price ratios have historically led to higher long-term returns.
Market Movements Not Closely Connected
Over the last decade, the European stock market had low-to-moderate correlation with North American and Asian equities.
The below chart shows correlations from February 2014 to February 2024. A value closer to zero indicates low correlation, while a value of one would indicate that two regions are moving in perfect unison.
| EURO STOXX 50 | STOXX EUROPE 600 | U.S. | Canada | Japan | Asia Pacific ex. China |
|
|---|---|---|---|---|---|---|
| EURO STOXX 50 | 1.00 | 0.97 | 0.55 | 0.67 | 0.24 | 0.43 |
| STOXX EUROPE 600 | 1.00 | 0.56 | 0.71 | 0.28 | 0.48 | |
| U.S. | 1.00 | 0.73 | 0.12 | 0.25 | ||
| Canada | 1.00 | 0.22 | 0.40 | |||
| Japan | 1.00 | 0.88 | ||||
| Asia Pacific ex. China | 1.00 |
Data is based on daily USD returns.
European equities had relatively independent market movements from North American and Asian markets. One contributing factor could be the differing sector weights in each market. For instance, technology makes up a quarter of the U.S. market, but health care and industrials dominate the broader European market.
Ultimately, European equities can enhance portfolio diversification and have the potential to mitigate risk for investors.
Tracking the Market
For investors interested in European equities, STOXX offers a variety of flagship indices:
| Index | Description | Market Cap |
|---|---|---|
| STOXX Europe 600 | Pan-regional, broad market | €10.5T |
| STOXX Developed Europe | Pan-regional, broad-market | €9.9T |
| STOXX Europe 600 ESG-X | Pan-regional, broad market, sustainability focus | €9.7T |
| STOXX Europe 50 | Pan-regional, blue-chip | €5.1T |
| EURO STOXX 50 | Eurozone, blue-chip | €3.5T |
Data is as of February 29, 2024. Market cap is free float, which represents the shares that are readily available for public trading on stock exchanges.
The EURO STOXX 50 tracks the Eurozone’s biggest and most traded companies. It also underlies one of the world’s largest ranges of ETFs and mutual funds. As of November 2023, there were €27.3 billion in ETFs and €23.5B in mutual fund assets under management tracking the index.
“For the past 25 years, the EURO STOXX 50 has served as an accurate, reliable and tradable representation of the Eurozone equity market.”
— Axel Lomholt, General Manager at STOXX
Partnering with STOXX to Track the European Stock Market
Are you interested in European equities? STOXX can be a valuable partner:
- Comprehensive, liquid and investable ecosystem
- European heritage, global reach
- Highly sophisticated customization capabilities
- Open architecture approach to using data
- Close partnerships with clients
- Part of ISS STOXX and Deutsche Börse Group
With a full suite of indices, STOXX can help you benchmark against the European stock market.
Learn how STOXX’s European indices offer liquid and effective market access.

-

 Economy1 day ago
Economic Growth Forecasts for G7 and BRICS Countries in 2024
The IMF has released its economic growth forecasts for 2024. How do the G7 and BRICS countries compare?
-

 Markets1 week ago
U.S. Debt Interest Payments Reach $1 Trillion
U.S. debt interest payments have surged past the $1 trillion dollar mark, amid high interest rates and an ever-expanding debt burden.
-

 United States2 weeks ago
Ranked: The Largest U.S. Corporations by Number of Employees
We visualized the top U.S. companies by employees, revealing the massive scale of retailers like Walmart, Target, and Home Depot.
-

 Markets2 weeks ago
The Top 10 States by Real GDP Growth in 2023
This graphic shows the states with the highest real GDP growth rate in 2023, largely propelled by the oil and gas boom.
-

 Markets2 weeks ago
Ranked: The World’s Top Flight Routes, by Revenue
In this graphic, we show the highest earning flight routes globally as air travel continued to rebound in 2023.
-

 Markets2 weeks ago
Ranked: The Most Valuable Housing Markets in America
The U.S. residential real estate market is worth a staggering $47.5 trillion. Here are the most valuable housing markets in the country.


-

 Mining1 week ago
Gold vs. S&P 500: Which Has Grown More Over Five Years?
-
Markets2 weeks ago
Ranked: The Most Valuable Housing Markets in America
-

 Money2 weeks ago
Which States Have the Highest Minimum Wage in America?
-

 AI2 weeks ago
Ranked: Semiconductor Companies by Industry Revenue Share
-
Markets2 weeks ago
Ranked: The World’s Top Flight Routes, by Revenue
-

 Countries2 weeks ago
Population Projections: The World’s 6 Largest Countries in 2075
-
Markets2 weeks ago
The Top 10 States by Real GDP Growth in 2023
-

 Demographics2 weeks ago
The Smallest Gender Wage Gaps in OECD Countries