Markets
China’s Debt Bomb: No One Really Knows the Payload [Chart]
![China's Debt Bomb [Chart]](https://www.visualcapitalist.com/wp-content/uploads/2016/05/china-debt-bomb.png)
China’s Debt Bomb [Chart]
No One Knows if its a Hand Grenade or a Nuclear Explosion
The Chart of the Week is a weekly Visual Capitalist feature on Fridays.
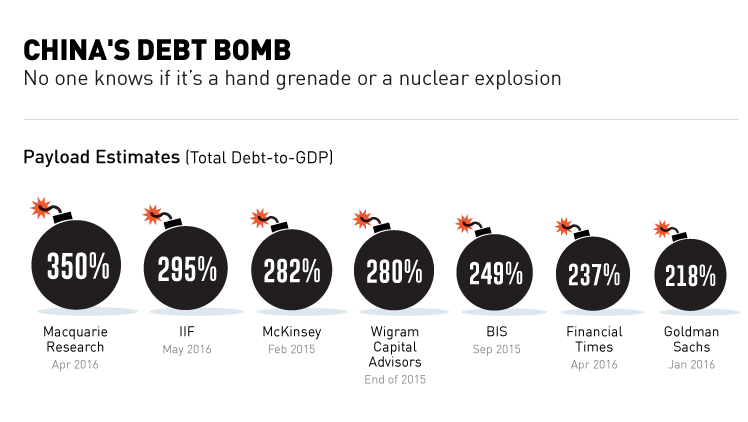
The ramp up in Chinese debt accumulation has been a leading concern of investors for years. The average total debt of emerging market economies is 175% of GDP, and skyrocketing corporate non-financial debt has launched China far beyond that number.
The real question is: by how far?
The answer is disconcerting, because nobody really knows.
If the Chinese debt bomb is detonated, the impact on markets is anybody’s guess. Kyle Bass says the losses would be 5x that of the subprime mortgage crisis, while Moody’s says the bomb will be safely disarmed by authorities far before it goes off.
In today’s chart, we look at various estimates to the size of China’s debt bomb, its payload, and what might spark the fuse.
China’s Debt Bomb: The Payload
Mckinsey came out with a widely-publicized estimate of China’s debt at the beginning of 2015. Using figures up to Q2 2014, they estimated that total Chinese debt was 282% of GDP, an increase from 158% in 2007.
Since then, various trusted organizations have come up with follow-up estimates.
On the low end, Goldman Sachs came out with an estimate in January 2016 of 216% total debt-to-GDP for 2015. (A few months later, they put out a separate report saying that total debt-to-GDP was estimated to be closer to 270% for 2016.)
On the high end, Macquarie analyst Viktor Shvets said that China’s debt was $35 trillion, or “nearly 350%” of GDP.
The truth is that it’s anybody’s guess. China’s official estimates are fairly useless, and the country has a massive and quickly evolving shadow banking sector that complicates these projections significantly.
Explosive Materials
Total debt is made up of various components, including government, corporate, banking, and household debts.
In the case of China, it is corporate debt that is particularly explosive. According to Mckinsey, the country’s corporate sector already has a higher debt-to-GDP than the United States, Canada, South Korea, or Germany, even while still being considered an “emerging market”.
S&P Global Ratings now figures that Chinese corporate debt is in the 160% range, up from 98% in 2008. The current number in the United States is a less ominous 70%.
China’s central bank is just as concerned as anyone else. Here’s what the Governor of the People’s Bank of China, Zhou Xiaochuan, had to say about a month ago:
Lending as a share of GDP, especially corporate lending as a share of GDP, is too high.
Xiaochuan also noted that a high leverage ratio is more prone to macroeconomic risk.
Defusing the Bomb
If there’s something that can ignite the fuse of China’s debt bomb, it’s non-performing loans (NPLs).
An NPL is a sum of money borrowed upon which the debtor has not made scheduled payments. They are essentially loans that are either close to defaulting, or already in default territory.
China has an official estimate for this number, and it is a benign 1.7% of debt. Unfortunately, independent researchers peg it much higher.
Bullish analysts have the number pegged in the high single-digits, while bearish analysts put the range anywhere between 15% and 21%. Even the IMF says that loans “potentially at risk” would be equal to 15.5% of total commercial lending.
If there’s a place to start defusing the bomb, this is it.


Markets
The European Stock Market: Attractive Valuations Offer Opportunities
On average, the European stock market has valuations that are nearly 50% lower than U.S. valuations. But how can you access the market?


European Stock Market: Attractive Valuations Offer Opportunities
Europe is known for some established brands, from L’Oréal to Louis Vuitton. However, the European stock market offers additional opportunities that may be lesser known.
The above infographic, sponsored by STOXX, outlines why investors may want to consider European stocks.
Attractive Valuations
Compared to most North American and Asian markets, European stocks offer lower or comparable valuations.
| Index | Price-to-Earnings Ratio | Price-to-Book Ratio |
|---|---|---|
| EURO STOXX 50 | 14.9 | 2.2 |
| STOXX Europe 600 | 14.4 | 2 |
| U.S. | 25.9 | 4.7 |
| Canada | 16.1 | 1.8 |
| Japan | 15.4 | 1.6 |
| Asia Pacific ex. China | 17.1 | 1.8 |
Data as of February 29, 2024. See graphic for full index names. Ratios based on trailing 12 month financials. The price to earnings ratio excludes companies with negative earnings.
On average, European valuations are nearly 50% lower than U.S. valuations, potentially offering an affordable entry point for investors.
Research also shows that lower price ratios have historically led to higher long-term returns.
Market Movements Not Closely Connected
Over the last decade, the European stock market had low-to-moderate correlation with North American and Asian equities.
The below chart shows correlations from February 2014 to February 2024. A value closer to zero indicates low correlation, while a value of one would indicate that two regions are moving in perfect unison.
| EURO STOXX 50 | STOXX EUROPE 600 | U.S. | Canada | Japan | Asia Pacific ex. China |
|
|---|---|---|---|---|---|---|
| EURO STOXX 50 | 1.00 | 0.97 | 0.55 | 0.67 | 0.24 | 0.43 |
| STOXX EUROPE 600 | 1.00 | 0.56 | 0.71 | 0.28 | 0.48 | |
| U.S. | 1.00 | 0.73 | 0.12 | 0.25 | ||
| Canada | 1.00 | 0.22 | 0.40 | |||
| Japan | 1.00 | 0.88 | ||||
| Asia Pacific ex. China | 1.00 |
Data is based on daily USD returns.
European equities had relatively independent market movements from North American and Asian markets. One contributing factor could be the differing sector weights in each market. For instance, technology makes up a quarter of the U.S. market, but health care and industrials dominate the broader European market.
Ultimately, European equities can enhance portfolio diversification and have the potential to mitigate risk for investors.
Tracking the Market
For investors interested in European equities, STOXX offers a variety of flagship indices:
| Index | Description | Market Cap |
|---|---|---|
| STOXX Europe 600 | Pan-regional, broad market | €10.5T |
| STOXX Developed Europe | Pan-regional, broad-market | €9.9T |
| STOXX Europe 600 ESG-X | Pan-regional, broad market, sustainability focus | €9.7T |
| STOXX Europe 50 | Pan-regional, blue-chip | €5.1T |
| EURO STOXX 50 | Eurozone, blue-chip | €3.5T |
Data is as of February 29, 2024. Market cap is free float, which represents the shares that are readily available for public trading on stock exchanges.
The EURO STOXX 50 tracks the Eurozone’s biggest and most traded companies. It also underlies one of the world’s largest ranges of ETFs and mutual funds. As of November 2023, there were €27.3 billion in ETFs and €23.5B in mutual fund assets under management tracking the index.
“For the past 25 years, the EURO STOXX 50 has served as an accurate, reliable and tradable representation of the Eurozone equity market.”
— Axel Lomholt, General Manager at STOXX
Partnering with STOXX to Track the European Stock Market
Are you interested in European equities? STOXX can be a valuable partner:
- Comprehensive, liquid and investable ecosystem
- European heritage, global reach
- Highly sophisticated customization capabilities
- Open architecture approach to using data
- Close partnerships with clients
- Part of ISS STOXX and Deutsche Börse Group
With a full suite of indices, STOXX can help you benchmark against the European stock market.
Learn how STOXX’s European indices offer liquid and effective market access.

-

 Economy2 days ago
Economic Growth Forecasts for G7 and BRICS Countries in 2024
The IMF has released its economic growth forecasts for 2024. How do the G7 and BRICS countries compare?
-

 Markets1 week ago
U.S. Debt Interest Payments Reach $1 Trillion
U.S. debt interest payments have surged past the $1 trillion dollar mark, amid high interest rates and an ever-expanding debt burden.
-

 United States2 weeks ago
Ranked: The Largest U.S. Corporations by Number of Employees
We visualized the top U.S. companies by employees, revealing the massive scale of retailers like Walmart, Target, and Home Depot.
-

 Markets2 weeks ago
The Top 10 States by Real GDP Growth in 2023
This graphic shows the states with the highest real GDP growth rate in 2023, largely propelled by the oil and gas boom.
-

 Markets2 weeks ago
Ranked: The World’s Top Flight Routes, by Revenue
In this graphic, we show the highest earning flight routes globally as air travel continued to rebound in 2023.
-

 Markets2 weeks ago
Ranked: The Most Valuable Housing Markets in America
The U.S. residential real estate market is worth a staggering $47.5 trillion. Here are the most valuable housing markets in the country.


-

 Energy1 week ago
The World’s Biggest Nuclear Energy Producers
-

 Money2 weeks ago
Which States Have the Highest Minimum Wage in America?
-

 Technology2 weeks ago
Ranked: Semiconductor Companies by Industry Revenue Share
-
Markets2 weeks ago
Ranked: The World’s Top Flight Routes, by Revenue
-

 Countries2 weeks ago
Population Projections: The World’s 6 Largest Countries in 2075
-
Markets2 weeks ago
The Top 10 States by Real GDP Growth in 2023
-

 Demographics2 weeks ago
The Smallest Gender Wage Gaps in OECD Countries
-

 United States2 weeks ago
Where U.S. Inflation Hit the Hardest in March 2024