Energy
Chart: The Evolution of Standard Oil
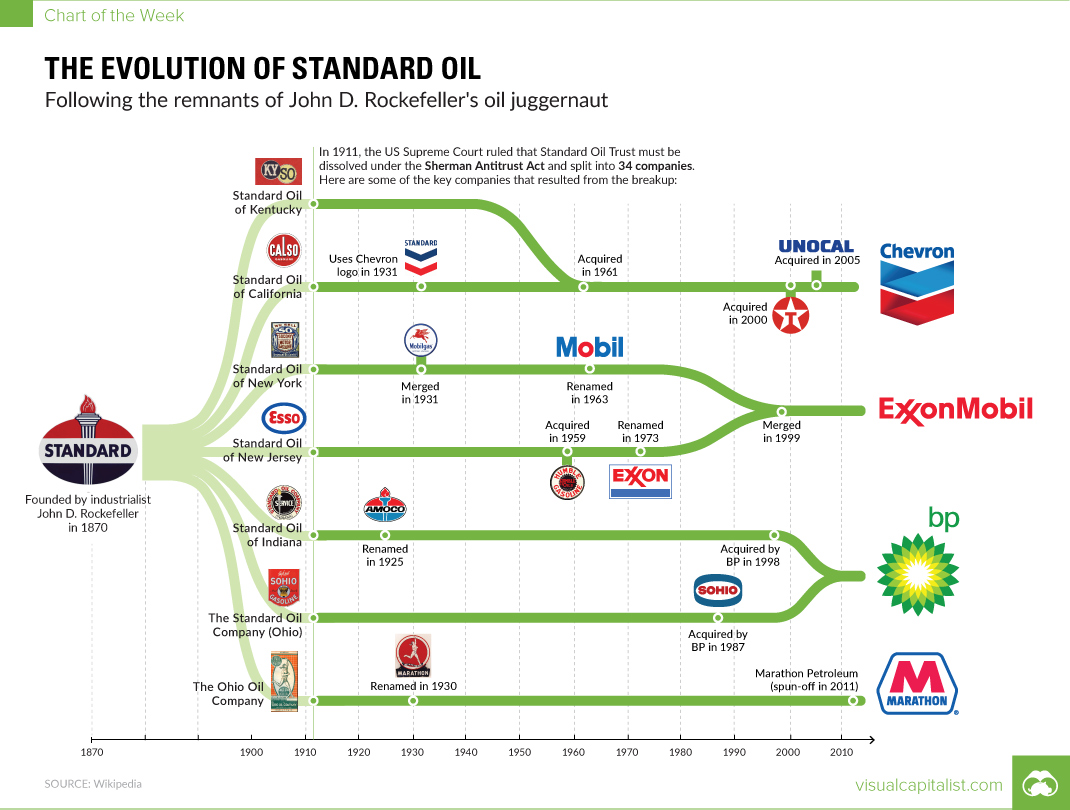
The Evolution of Standard Oil
Rockefeller’s juggernaut was split into 34 companies
The Chart of the Week is a weekly Visual Capitalist feature on Fridays.
A couple of weeks ago, we published an infographic showing how the list of the most valuable companies in the U.S. has changed drastically over the last 100 years.
Near the top of that list in 1917 is The Standard Oil Company of New Jersey, which is just one of the 34 forced spin-offs from the original Standard Oil juggernaut that was split up in 1911.
In today’s chart, we look at the “fragments” of Standard Oil, and who owns these assets today.
Monopoly Decision
At the turn of the 20th century, John D. Rockefeller’s Standard Oil was a force to be reckoned with. In the year 1904, it controlled 91% of oil production and 85% of final sales in the United States.
As a result, an antitrust case was filed against the company in 1906 under the Sherman Antitrust Act, arguing that the company used tactics such as raising prices in areas where it had a monopoly, while price gouging in areas where it still faced competition.
By the time the Standard Oil was broken up in 1911, its market share had eroded to 64%, and there were at least 147 refining companies competing with it in the United States. Meanwhile, John D. Rockefeller had left the company, yet the value of his stock doubled as a result of the split. This made him the world’s richest person at the time.
Resulting Companies
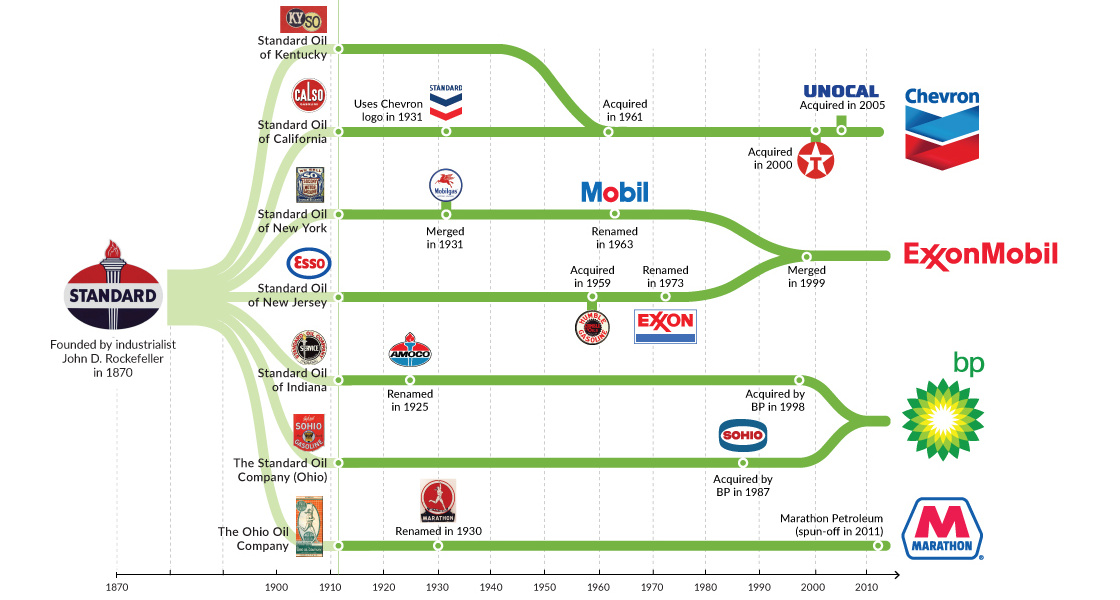
The company was split into 34 separate entities, mainly based on geographical area.
Today, the biggest of these companies form the core of the U.S. oil industry:
- Standard Oil of New Jersey: Merged with Humble Oil and eventually became Exxon
- Standard Oil of New York: Merged with Vacuum Oil, and eventually became Mobil
- Standard Oil of California: Acquired Standard Oil of Kentucky, Texaco, and Unocal, and is now Chevron
- Standard Oil of Indiana: Renamed Amoco, and was acquired by BP
- Standard Oil of Ohio: Acquired by BP
- The Ohio Oil Company: Became Marathon Oil, which eventually also spun-off Marathon Petroleum
But that’s not all – the Standard Oil asset portfolio also carried some other interesting brands that you’d recognize today:
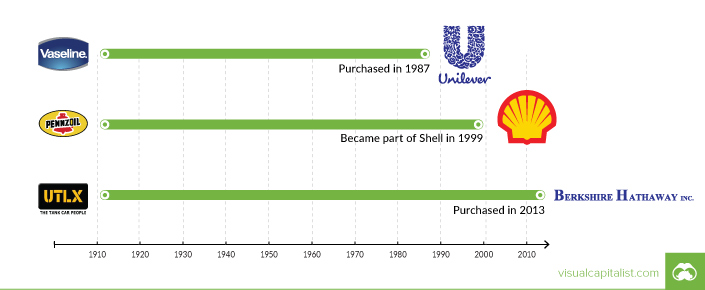
Yes, even Vaseline was originally a part of Standard Oil. Inventor Robert Chesebrough derived the product from petroleum residue, and the spun-off company (Chesebrough Manufacturing Company) was purchased by Unilever in 1987.
Meanwhile, the Union Tank Car Company is a part of Berkshire Hathaway today – and Pennzoil is owned by Royal Dutch Shell.


Energy
Mapped: The Age of Energy Projects in Interconnection Queues, by State
This map shows how many energy projects are in interconnection queues by state and how long these projects have been queued up, on average.


Age of Energy Projects in Interconnection Queues, by State
This was originally posted on our Voronoi app. Download the app for free on iOS or Android and discover incredible data-driven charts from a variety of trusted sources.
By the end of 2023, more than 11,000 energy projects were in interconnection queues in the United States, waiting for a green-light from regional grid operators to proceed with construction.
This map, created in partnership with the National Public Utilities Council, maps out the average age of active energy projects in interconnection queues by state, using data from Berkeley Lab.
Interconnection Queues, Explained
Interconnection queues are lists of energy projects that have made interconnection requests to their regional grid operators. Once submitted, these requests formally initiate the impact study process that each project goes through before grid connection, forming waiting lists for approval known as interconnection queues.
In recent years, both the number and generation capacity of queued projects have surged in the United States, along with the length of time spent in queue.
According to Berkeley Lab, the amount of generation capacity entering queues each year has risen by more than 550% from 2015 to 2023, with average queue duration rising from 3 years to 5 years the same period.
As a result of the growing backlog, a large proportion of projects ultimately withdraw from queues, leading to only 19% of applications reaching commercial operations.
The Backlog: Number of Projects and Average Wait Times
Of the 11,000 active projects in U.S. queues at the end of 2023, Texas, California, and Virginia had the most in queue; 1,208, 947, and 743, respectively.
When looking at the average ages of these projects, all three states hovered around the national average of 34 months (2.83 years), with Texas sporting 28 months, California 33, and Virginia 34.
Vermont, Minnesota, Wisconsin, and Florida, on the other hand, had the highest average queue durations; 54, 49, 47, and 46 months, respectively.
Average Queue Duration by Project Type
At the end of 2023, more than 95% of the generation capacity in active interconnection queues was for emission-free resources. The table below provides a breakdown.
| Project Type | Average Queue Duration (As of 12/31/2023) | Number of Projects in Queue |
|---|---|---|
| Wind | 40 months | 841 |
| Solar | 34 months | 4,506 |
| Wind+Battery | 34 months | 76 |
| Solar+Battery | 27 months | 2,377 |
| Battery | 24 months | 2,818 |
Wind projects had the highest wait times at the end of 2023 with an average age of 40 months (3.33 years). Solar projects, on the other hand, made up more than 40% of projects in queue.
Overall, reducing the time that these renewable energy projects spend in queues can accelerate the transition to a low-carbon energy future.
According to the U.S. Department of Energy, enhancing data transparency, streamlining approval processes, promoting economic efficiency, and maintaining a reliable grid are some of the ways this growing backlog can be mitigated.

-

 Technology6 days ago
Visualizing AI Patents by Country
-

 Green2 weeks ago
Ranking the Top 15 Countries by Carbon Tax Revenue
-

 Markets2 weeks ago
U.S. Debt Interest Payments Reach $1 Trillion
-

 Mining2 weeks ago
Gold vs. S&P 500: Which Has Grown More Over Five Years?
-

 Uranium2 weeks ago
The World’s Biggest Nuclear Energy Producers
-

 Misc2 weeks ago
How Hard Is It to Get Into an Ivy League School?
-

 Debt2 weeks ago
How Debt-to-GDP Ratios Have Changed Since 2000
-

 Culture2 weeks ago
The Highest Earning Athletes in Seven Professional Sports