Markets
Visualizing China’s Most Ambitious Megaproject
View a high resolution version of this graphic
Visualizing China’s Most Ambitious Megaproject
View the high resolution version of today’s graphic by clicking here.
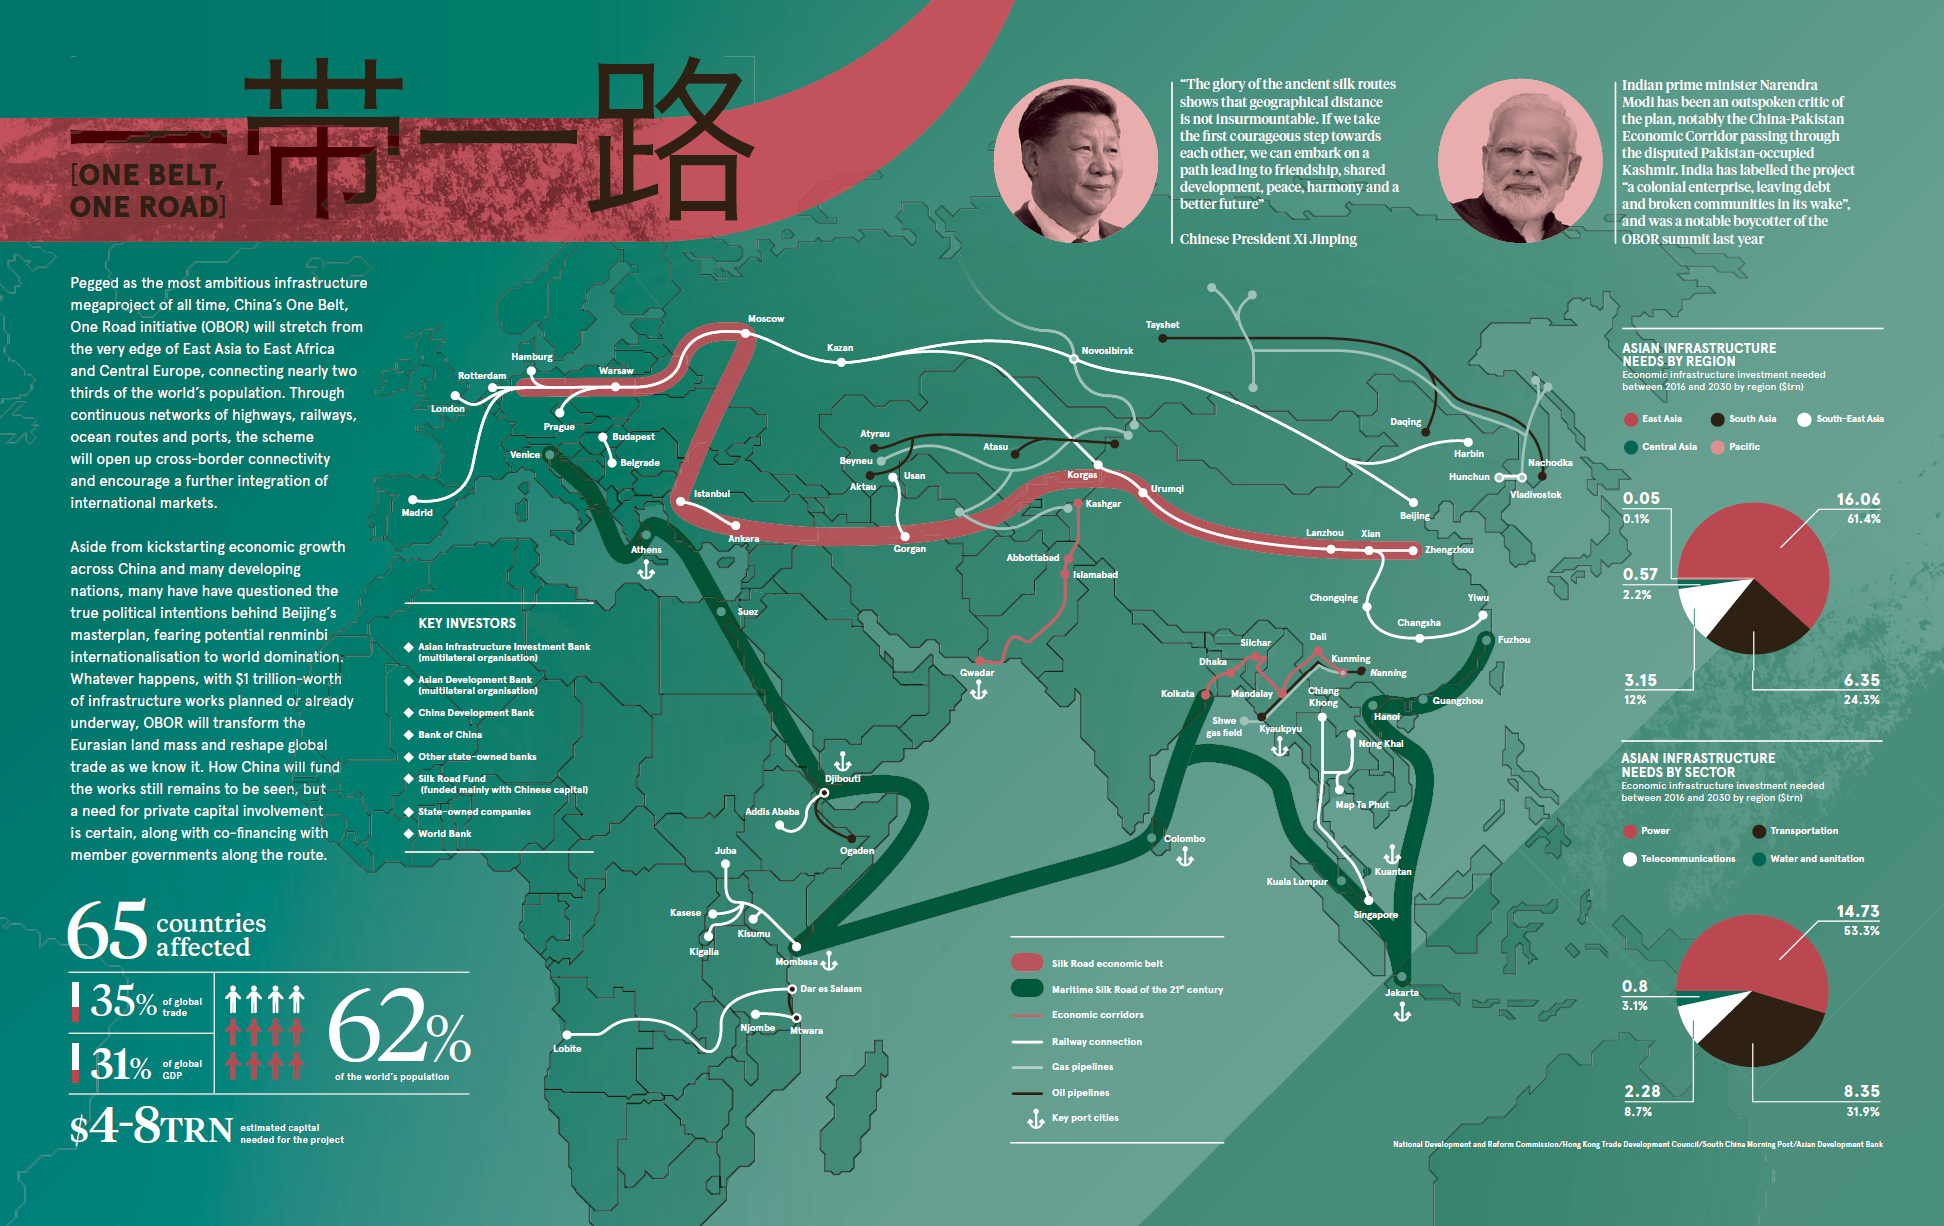
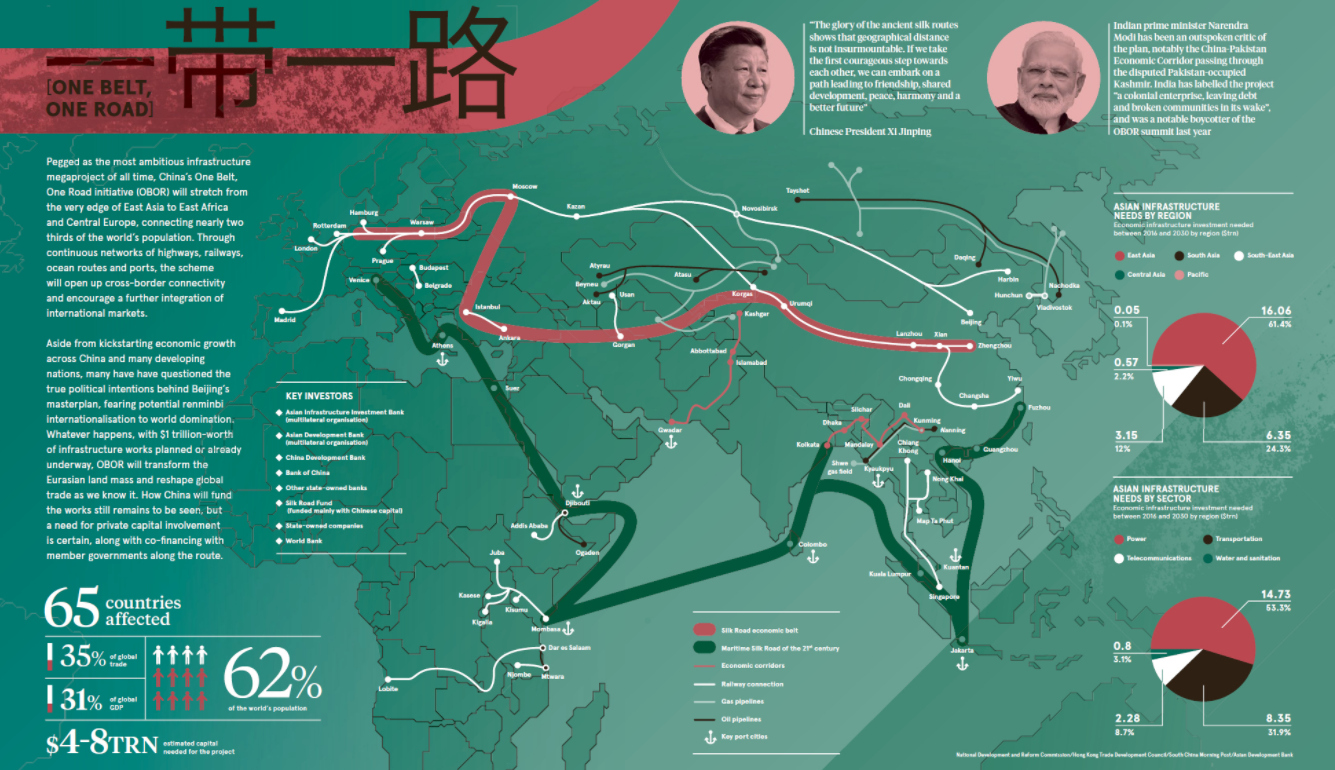
Costing between $4-8 trillion and affecting 65 countries, China’s ambitious One Belt, One Road (OBOR) initiative is the granddaddy of all megaprojects.
By the time of it’s estimated completion in 2049, OBOR will stretch from the edge of East Asia all the way to East Africa and Central Europe, and it will impact a lengthy list of countries that account for 62% of the world’s population and 40% of its economic output.
Today’s infographic from Raconteur helps visualize the initiative’s tremendous size, scale, and potential impact on Asian infrastructure.
Silk Road 2.0
The tangible concept behind OBOR is to build an extensive network of infrastructure – including railways, roads, pipelines, and utility grids – that help link China to the rest of Asia, as well as Africa and Europe.
This multi-trillion dollar project will fill the infrastructure gap that currently inhibits economic growth potential on the world’s largest continent, but it has other important objectives as well. By connecting all of these economies together, China is hoping to become the gatekeeper for a new platform international trade cooperation and integration.
But that’s not all: if China’s economic corridor does what it’s supposed to, the countries in it will see more social and cultural links, financial cooperation, and a merger of policy goals and objectives to accomplish.
Naturally, this will expand the clout and influence of China, and it may even create the eventual scaffolding for the renminbi to flourish as a trade currency, and eventually a reserve currency.
One Road or Roadblock?
When billions of dollars are at play, the stakes become higher. Although some countries agree with the OBOR initiative in principle – how it plays out in reality is a different story.
Most of the funding for massive deep-water ports, lengthy railroads, and power plants will be coming from the purse strings of Chinese companies. Some will be grants, but many are taking the form of loans, and when countries default there can be consequences.
In Pakistan, for example, a deep-water port in Gwadar is being funded by loans from Chinese banks to the tune of $16 billion. The only problem? The interest rate is over 13%, and if Pakistan defaults, China could end up taking all sorts of collateral as compensation – from coal mines to oil pipelines.
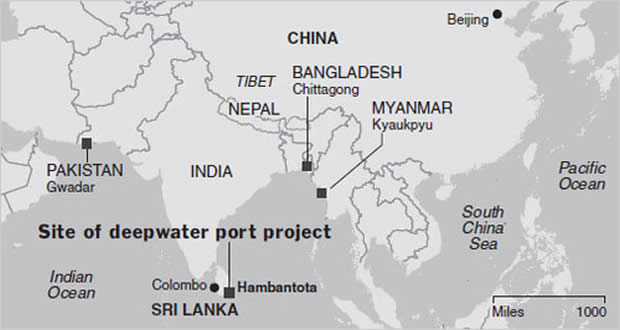
Meanwhile, Sri Lanka was unable to pay its $8 billion loan for the Hambantota Port. In the middle of 2017, the country gave up the controlling interest in the port to a state-owned company in China in exchange for writing off the debt. China now has a 99-year lease on the asset – quite useful, since it happens to be right in the middle of one of China’s most important shipping lanes to Africa, the Middle East, and Europe.
Natural Opposition
While most economies in Asia are willing to accept some level of risk to develop OBOR, there is one country that is simply not a fan of the megaproject.
India, a very natural rival to China, has a few major qualms:
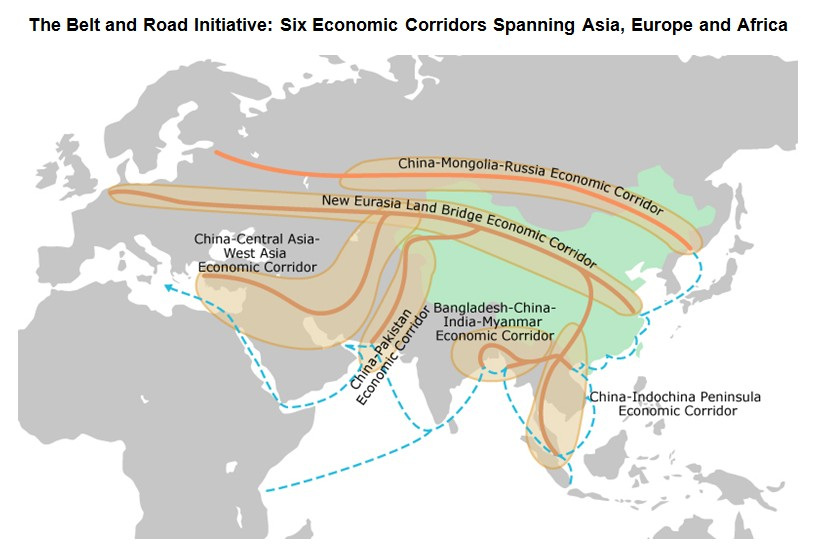
- The China-Pakistan Economic Corridor (CPEC) goes right through Kashmir, a disputed territory
- Chinese investment in maritime trade routes through the Indian Ocean could displace India’s traditional regional dominance
- India sees the OBOR megaproject as lacking transparency
Meanwhile, with neighboring states such as Sri Lanka and Pakistan getting billions of dollars of investment from Chinese state-run companies, it likely creates one more issue that Indian Prime Minister Modi is not necessarily happy about, either.


Markets
The European Stock Market: Attractive Valuations Offer Opportunities
On average, the European stock market has valuations that are nearly 50% lower than U.S. valuations. But how can you access the market?


European Stock Market: Attractive Valuations Offer Opportunities
Europe is known for some established brands, from L’Oréal to Louis Vuitton. However, the European stock market offers additional opportunities that may be lesser known.
The above infographic, sponsored by STOXX, outlines why investors may want to consider European stocks.
Attractive Valuations
Compared to most North American and Asian markets, European stocks offer lower or comparable valuations.
| Index | Price-to-Earnings Ratio | Price-to-Book Ratio |
|---|---|---|
| EURO STOXX 50 | 14.9 | 2.2 |
| STOXX Europe 600 | 14.4 | 2 |
| U.S. | 25.9 | 4.7 |
| Canada | 16.1 | 1.8 |
| Japan | 15.4 | 1.6 |
| Asia Pacific ex. China | 17.1 | 1.8 |
Data as of February 29, 2024. See graphic for full index names. Ratios based on trailing 12 month financials. The price to earnings ratio excludes companies with negative earnings.
On average, European valuations are nearly 50% lower than U.S. valuations, potentially offering an affordable entry point for investors.
Research also shows that lower price ratios have historically led to higher long-term returns.
Market Movements Not Closely Connected
Over the last decade, the European stock market had low-to-moderate correlation with North American and Asian equities.
The below chart shows correlations from February 2014 to February 2024. A value closer to zero indicates low correlation, while a value of one would indicate that two regions are moving in perfect unison.
| EURO STOXX 50 | STOXX EUROPE 600 | U.S. | Canada | Japan | Asia Pacific ex. China |
|
|---|---|---|---|---|---|---|
| EURO STOXX 50 | 1.00 | 0.97 | 0.55 | 0.67 | 0.24 | 0.43 |
| STOXX EUROPE 600 | 1.00 | 0.56 | 0.71 | 0.28 | 0.48 | |
| U.S. | 1.00 | 0.73 | 0.12 | 0.25 | ||
| Canada | 1.00 | 0.22 | 0.40 | |||
| Japan | 1.00 | 0.88 | ||||
| Asia Pacific ex. China | 1.00 |
Data is based on daily USD returns.
European equities had relatively independent market movements from North American and Asian markets. One contributing factor could be the differing sector weights in each market. For instance, technology makes up a quarter of the U.S. market, but health care and industrials dominate the broader European market.
Ultimately, European equities can enhance portfolio diversification and have the potential to mitigate risk for investors.
Tracking the Market
For investors interested in European equities, STOXX offers a variety of flagship indices:
| Index | Description | Market Cap |
|---|---|---|
| STOXX Europe 600 | Pan-regional, broad market | €10.5T |
| STOXX Developed Europe | Pan-regional, broad-market | €9.9T |
| STOXX Europe 600 ESG-X | Pan-regional, broad market, sustainability focus | €9.7T |
| STOXX Europe 50 | Pan-regional, blue-chip | €5.1T |
| EURO STOXX 50 | Eurozone, blue-chip | €3.5T |
Data is as of February 29, 2024. Market cap is free float, which represents the shares that are readily available for public trading on stock exchanges.
The EURO STOXX 50 tracks the Eurozone’s biggest and most traded companies. It also underlies one of the world’s largest ranges of ETFs and mutual funds. As of November 2023, there were €27.3 billion in ETFs and €23.5B in mutual fund assets under management tracking the index.
“For the past 25 years, the EURO STOXX 50 has served as an accurate, reliable and tradable representation of the Eurozone equity market.”
— Axel Lomholt, General Manager at STOXX
Partnering with STOXX to Track the European Stock Market
Are you interested in European equities? STOXX can be a valuable partner:
- Comprehensive, liquid and investable ecosystem
- European heritage, global reach
- Highly sophisticated customization capabilities
- Open architecture approach to using data
- Close partnerships with clients
- Part of ISS STOXX and Deutsche Börse Group
With a full suite of indices, STOXX can help you benchmark against the European stock market.
Learn how STOXX’s European indices offer liquid and effective market access.

-

 Economy3 days ago
Economic Growth Forecasts for G7 and BRICS Countries in 2024
The IMF has released its economic growth forecasts for 2024. How do the G7 and BRICS countries compare?
-

 Markets2 weeks ago
U.S. Debt Interest Payments Reach $1 Trillion
U.S. debt interest payments have surged past the $1 trillion dollar mark, amid high interest rates and an ever-expanding debt burden.
-

 United States2 weeks ago
Ranked: The Largest U.S. Corporations by Number of Employees
We visualized the top U.S. companies by employees, revealing the massive scale of retailers like Walmart, Target, and Home Depot.
-

 Markets2 weeks ago
The Top 10 States by Real GDP Growth in 2023
This graphic shows the states with the highest real GDP growth rate in 2023, largely propelled by the oil and gas boom.
-

 Markets3 weeks ago
Ranked: The World’s Top Flight Routes, by Revenue
In this graphic, we show the highest earning flight routes globally as air travel continued to rebound in 2023.
-

 Markets3 weeks ago
Ranked: The Most Valuable Housing Markets in America
The U.S. residential real estate market is worth a staggering $47.5 trillion. Here are the most valuable housing markets in the country.


-

 Science7 days ago
Visualizing the Average Lifespans of Mammals
-
Markets2 weeks ago
The Top 10 States by Real GDP Growth in 2023
-

 Demographics2 weeks ago
The Smallest Gender Wage Gaps in OECD Countries
-

 United States2 weeks ago
Where U.S. Inflation Hit the Hardest in March 2024
-

 Green2 weeks ago
Top Countries By Forest Growth Since 2001
-
United States2 weeks ago
Ranked: The Largest U.S. Corporations by Number of Employees
-

 Maps2 weeks ago
The Largest Earthquakes in the New York Area (1970-2024)
-

 Green2 weeks ago
Ranked: The Countries With the Most Air Pollution in 2023