Energy
Craft Oil: The Lesser Known Side of America’s Energy Industry
Craft Oil: The Lesser Known Side of America’s Energy Industry
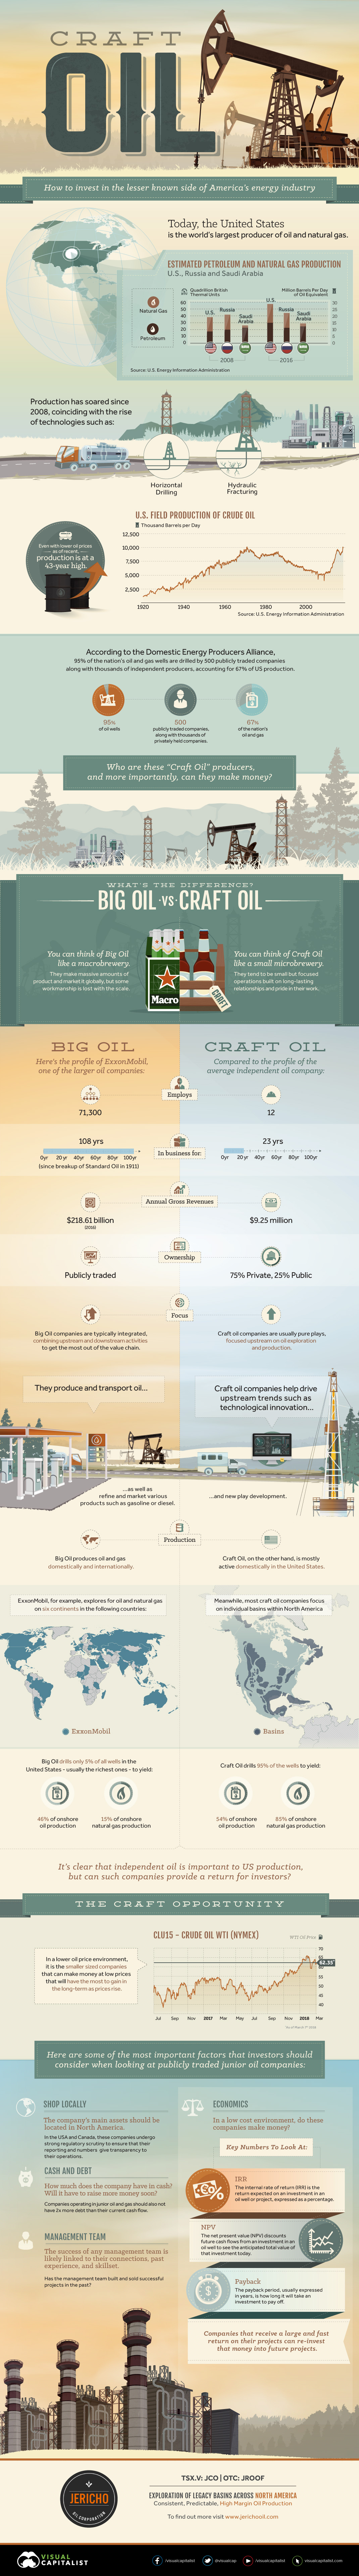
Go back a decade, and America’s energy industry was quite the hot button issue.
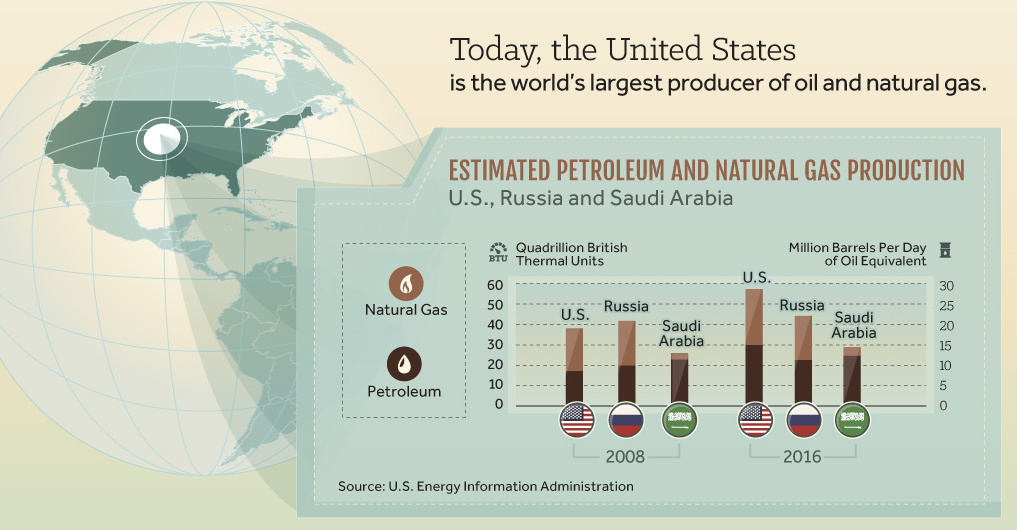
Oil prices were soaring past $100/bbl, the country was still reliant on OPEC for imports, and a lack of energy independence was becoming a costly issue. Meanwhile, the United States was being outclassed on the energy production front by both Saudi Arabia and Russia.
However, in the short span of eight years – and thanks to the use of technologies like horizontal drilling and hydraulic fracturing – the United States quickly went from having a questionable energy future to being in a clear position of strength. Today, even with lower prices, U.S. field production of crude is at a 43-year high.
America’s Independent Oil Producers
Since 2016, the U.S. has produced close to the equivalent of 30 million bpd in oil and natural gas, making the United States a champion of global energy production.
Today’s infographic from Jericho Oil focuses on a key part of the turnaround in the U.S. energy sector that often gets overshadowed by Big Oil players like ExxonMobil or Royal Dutch Shell. It covers the role of “Craft Oil” in the industry, an umbrella that includes many small, independent, and focused companies across America that produce oil and gas on a domestic basis.
The thousands of companies in this group, many which are community-driven or family-owned, actually drill 95% of the country’s oil wells to yield 54% of onshore oil and 85% of onshore gas production.
Comparing Big Oil to Craft Oil
Below is a comparison of ExxonMobil to the profile of an average Craft Oil company:
| Employees | ||
| Years in Business | ||
| Annual Gross Revenues | ||
| Ownership | ||
| Level of Integration | ||
| Focus | ||
| Production |
Most Craft Oil companies are very small in comparison – but together, they contribute to a very significant portion of U.S. production, as well as the economy.
Investing in Craft Oil
Do these independent producers provide a strategic opportunity for investors?
Yes, but here are a few areas investors should consider evaluating before taking any action:
Location of Assets:
In the U.S. and Canada, independent oil companies undergo strong regulatory scrutiny to make sure their reporting and numbers give transparency to their operations.
Cash and Debt:
How much does the company have in cash? Will they have to raise more money soon?
Companies operating in junior oil and gas should not have more than 2x more debt than their current cash flow.
Management Team:
The strength of any management team is linked to their connections, past experience, and skill set. If the management team has built and sold successful projects in the past, that is a good sign of strength.
Economics:
Investors need to be aware of key metrics to gauge if junior oil and gas companies can make money in the current or projected cost environment. These include IRR (Internal Rate of Return), NPV (Net present value), and payback period. Companies that make their money back fast and with a good return can re-invest that capital into additional projects.


Energy
Charted: 4 Reasons Why Lithium Could Be the Next Gold Rush
Visual Capitalist has partnered with EnergyX to show why drops in prices and growing demand may make now the right time to invest in lithium.


4 Reasons Why You Should Invest in Lithium
Lithium’s importance in powering EVs makes it a linchpin of the clean energy transition and one of the world’s most precious minerals.
In this graphic, Visual Capitalist partnered with EnergyX to explore why now may be the time to invest in lithium.
1. Lithium Prices Have Dropped
One of the most critical aspects of evaluating an investment is ensuring that the asset’s value is higher than its price would indicate. Lithium is integral to powering EVs, and, prices have fallen fast over the last year:
| Date | LiOH·H₂O* | Li₂CO₃** |
|---|---|---|
| Feb 2023 | $76 | $71 |
| March 2023 | $71 | $61 |
| Apr 2023 | $43 | $33 |
| May 2023 | $43 | $33 |
| June 2023 | $47 | $45 |
| July 2023 | $44 | $40 |
| Aug 2023 | $35 | $35 |
| Sept 2023 | $28 | $27 |
| Oct 2023 | $24 | $23 |
| Nov 2023 | $21 | $21 |
| Dec 2023 | $17 | $16 |
| Jan 2024 | $14 | $15 |
| Feb 2024 | $13 | $14 |
Note: Monthly spot prices were taken as close to the 14th of each month as possible.
*Lithium hydroxide monohydrate MB-LI-0033
**Lithium carbonate MB-LI-0029
2. Lithium-Ion Battery Prices Are Also Falling
The drop in lithium prices is just one reason to invest in the metal. Increasing economies of scale, coupled with low commodity prices, have caused the cost of lithium-ion batteries to drop significantly as well.
In fact, BNEF reports that between 2013 and 2023, the price of a Li-ion battery dropped by 82%.
| Year | Price per KWh |
|---|---|
| 2023 | $139 |
| 2022 | $161 |
| 2021 | $150 |
| 2020 | $160 |
| 2019 | $183 |
| 2018 | $211 |
| 2017 | $258 |
| 2016 | $345 |
| 2015 | $448 |
| 2014 | $692 |
| 2013 | $780 |

3. EV Adoption is Sustainable
One of the best reasons to invest in lithium is that EVs, one of the main drivers behind the demand for lithium, have reached a price point similar to that of traditional vehicle.
According to the Kelly Blue Book, Tesla’s average transaction price dropped by 25% between 2022 and 2023, bringing it in line with many other major manufacturers and showing that EVs are a realistic transport option from a consumer price perspective.
| Manufacturer | September 2022 | September 2023 |
|---|---|---|
| BMW | $69,000 | $72,000 |
| Ford | $54,000 | $56,000 |
| Volkswagon | $54,000 | $56,000 |
| General Motors | $52,000 | $53,000 |
| Tesla | $68,000 | $51,000 |
4. Electricity Demand in Transport is Growing
As EVs become an accessible transport option, there’s an investment opportunity in lithium. But possibly the best reason to invest in lithium is that the IEA reports global demand for the electricity in transport could grow dramatically by 2030:
| Transport Type | 2022 | 2025 | 2030 |
|---|---|---|---|
| Buses 🚌 | 23,000 GWh | 50,000 GWh | 130,000 GWh |
| Cars 🚙 | 65,000 GWh | 200,000 GWh | 570,000 GWh |
| Trucks 🛻 | 4,000 GWh | 15,000 GWh | 94,000 GWh |
| Vans 🚐 | 6,000 GWh | 16,000 GWh | 72,000 GWh |
The Lithium Investment Opportunity
Lithium presents a potentially classic investment opportunity. Lithium and battery prices have dropped significantly, and recently, EVs have reached a price point similar to other vehicles. By 2030, the demand for clean energy, especially in transport, will grow dramatically.
With prices dropping and demand skyrocketing, now is the time to invest in lithium.
EnergyX is poised to exploit lithium demand with cutting-edge lithium extraction technology capable of extracting 300% more lithium than current processes.

-

 Lithium3 days ago
Ranked: The Top 10 EV Battery Manufacturers in 2023
Asia dominates this ranking of the world’s largest EV battery manufacturers in 2023.
-

 Energy1 week ago
The World’s Biggest Nuclear Energy Producers
China has grown its nuclear capacity over the last decade, now ranking second on the list of top nuclear energy producers.
-

 Energy4 weeks ago
The World’s Biggest Oil Producers in 2023
Just three countries accounted for 40% of global oil production last year.
-

 Energy1 month ago
How Much Does the U.S. Depend on Russian Uranium?
Currently, Russia is the largest foreign supplier of nuclear power fuel to the U.S.
-

 Uranium2 months ago
Charted: Global Uranium Reserves, by Country
We visualize the distribution of the world’s uranium reserves by country, with 3 countries accounting for more than half of total reserves.
-

 Energy3 months ago
Visualizing the Rise of the U.S. as Top Crude Oil Producer
Over the last decade, the United States has established itself as the world’s top producer of crude oil, surpassing Saudi Arabia and Russia.


-

 Markets1 week ago
U.S. Debt Interest Payments Reach $1 Trillion
-

 Markets2 weeks ago
Ranked: The Most Valuable Housing Markets in America
-

 Money2 weeks ago
Which States Have the Highest Minimum Wage in America?
-

 AI2 weeks ago
Ranked: Semiconductor Companies by Industry Revenue Share
-

 Markets2 weeks ago
Ranked: The World’s Top Flight Routes, by Revenue
-

 Countries2 weeks ago
Population Projections: The World’s 6 Largest Countries in 2075
-

 Markets2 weeks ago
The Top 10 States by Real GDP Growth in 2023
-

 Money2 weeks ago
The Smallest Gender Wage Gaps in OECD Countries