Markets
Chart: The Trillion Dollar Club of Asset Managers
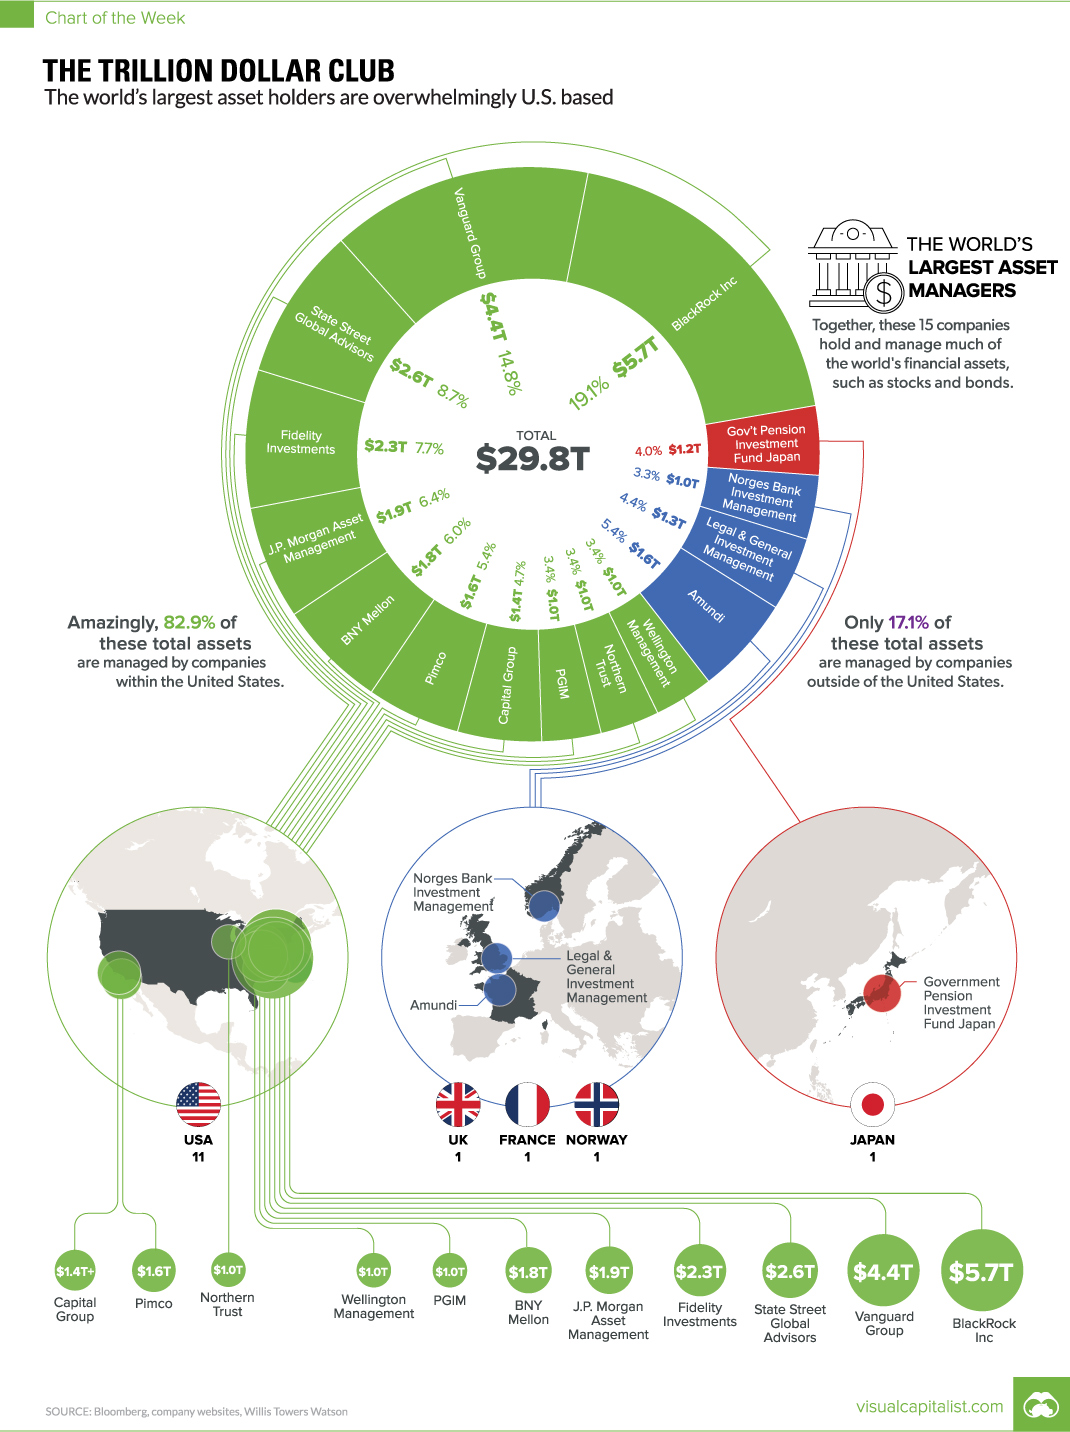
Chart: The Trillion Dollar Club
$1T+ club is dominated by U.S. based asset managers
The Chart of the Week is a weekly Visual Capitalist feature on Fridays.
In the late 1700s, it was the start of the battle of stock exchanges: in 1773, the London Stock Exchange was formed, and the New York Stock Exchange was formed just 19 years later.
And while London was a preferred destination for international finance at the time, England also had laws that restricted the formation of new joint-stock companies. The law was repealed in 1825, but by then it was already too late.
In the U.S., exchanges in New York City and Philadelphia took full advantage by dealing in stocks early on. Eventually, for this and a variety of other reasons, the NYSE emerged as the most dominant exchange in the world – helping propel New York and Wall Street to the center of finance.
The Center of Finance
Wall Street, and the U.S. in general, is now synonymous with finance – and most of the world’s largest banks, funds, and investors maintain a presence nearby. The biggest asset management companies, which pool investments into securities such as stocks and bonds on behalf of investors, are no exception to this.
Today’s chart shows all global companies with over $1 trillion in assets under management (AUM).
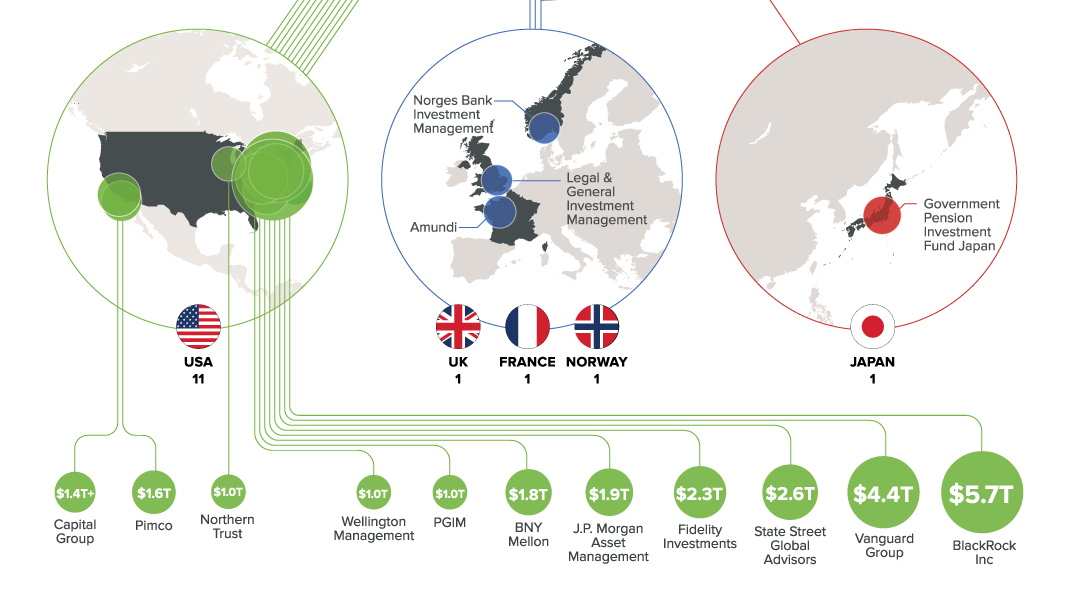
Not surprisingly, all but 17.1% of assets managed by this $1 Trillion Club are overseen by companies based in the United States.
| Rank | Company | Country | AUM |
|---|---|---|---|
| #1 | BlackRock Inc. | USA | $5.7 trillion |
| #2 | Vanguard Group | USA | $4.4 trillion |
| #3 | State Street Global Advisors | USA | $2.6 trillion |
| #4 | Fidelity Investments | USA | $2.3 trillion |
| #5 | J.P. Morgan Asset Management | USA | $1.9 trillion |
| #6 | BNY Mellon | USA | $1.8 trillion |
| #7 | Pimco | USA | $1.6 trillion |
| #8 | Amundi | France | $1.6 trillion |
| #9 | Capital Group | USA | $1.4+ trillion |
| #10 | Legal & General Investment Management | UK | $1.3 trillion |
| #11 | Government Pension Investment Fund | Japan | $1.2 trillion |
| #12 | PGIM | USA | $1.0+ trillion |
| #13 | Northern Trust | USA | $1.0 trillion |
| #14 | Wellington Management | USA | $1.0 trillion |
| #15 | Norges Bank Investment Management | Norway | $1.0 trillion |
Even further, outside of Northern Trust (Chicago), Pimco (Newport Beach), and Capital Group (Los Angeles), the remaining U.S. companies are based in the Northeast specifically – either on Wall Street, or just a short drive away.
The Newest Entrant
The newest entrant to the $1 trillion club is Norway’s sovereign wealth fund, which is managed by Norges Bank Investment Management. It’s the world’s largest sovereign wealth fund, and it was “never forecast” to get so big.
The Norwegian fund recently joined France’s Amundi ($1.6 trillion), the UK’s Legal & General ($1.3 trillion), and Japan’s Goverment Pension Investment Fund ($1.2 trillion) as non-U.S. members of this exclusive club.


Markets
Mapped: Europe’s GDP Per Capita, by Country
Which European economies are richest on a GDP per capita basis? This map shows the results for 44 countries across the continent.


Mapped: Europe’s GDP Per Capita, by Country (2024)
This was originally posted on our Voronoi app. Download the app for free on iOS or Android and discover incredible data-driven charts from a variety of trusted sources.
Europe is home to some of the largest and most sophisticated economies in the world. But how do countries in the region compare with each other on a per capita productivity basis?
In this map, we show Europe’s GDP per capita levels across 44 nations in current U.S. dollars. Data for this visualization and article is sourced from the International Monetary Fund (IMF) via their DataMapper tool, updated April 2024.
Europe’s Richest and Poorest Nations, By GDP Per Capita
Luxembourg, Ireland, and Switzerland, lead the list of Europe’s richest nations by GDP per capita, all above $100,000.
| Rank | Country | GDP Per Capita (2024) |
|---|---|---|
| 1 | 🇱🇺 Luxembourg | $131,380 |
| 2 | 🇮🇪 Ireland | $106,060 |
| 3 | 🇨🇭 Switzerland | $105,670 |
| 4 | 🇳🇴 Norway | $94,660 |
| 5 | 🇮🇸 Iceland | $84,590 |
| 6 | 🇩🇰 Denmark | $68,900 |
| 7 | 🇳🇱 Netherlands | $63,750 |
| 8 | 🇸🇲 San Marino | $59,410 |
| 9 | 🇦🇹 Austria | $59,230 |
| 10 | 🇸🇪 Sweden | $58,530 |
| 11 | 🇧🇪 Belgium | $55,540 |
| 12 | 🇫🇮 Finland | $55,130 |
| 13 | 🇩🇪 Germany | $54,290 |
| 14 | 🇬🇧 UK | $51,070 |
| 15 | 🇫🇷 France | $47,360 |
| 16 | 🇦🇩 Andorra | $44,900 |
| 17 | 🇲🇹 Malta | $41,740 |
| 18 | 🇮🇹 Italy | $39,580 |
| 19 | 🇨🇾 Cyprus | $37,150 |
| 20 | 🇪🇸 Spain | $34,050 |
| 21 | 🇸🇮 Slovenia | $34,030 |
| 22 | 🇪🇪 Estonia | $31,850 |
| 23 | 🇨🇿 Czech Republic | $29,800 |
| 24 | 🇵🇹 Portugal | $28,970 |
| 25 | 🇱🇹 Lithuania | $28,410 |
| 26 | 🇸🇰 Slovakia | $25,930 |
| 27 | 🇱🇻 Latvia | $24,190 |
| 28 | 🇬🇷 Greece | $23,970 |
| 29 | 🇭🇺 Hungary | $23,320 |
| 30 | 🇵🇱 Poland | $23,010 |
| 31 | 🇭🇷 Croatia | $22,970 |
| 32 | 🇷🇴 Romania | $19,530 |
| 33 | 🇧🇬 Bulgaria | $16,940 |
| 34 | 🇷🇺 Russia | $14,390 |
| 35 | 🇹🇷 Türkiye | $12,760 |
| 36 | 🇲🇪 Montenegro | $12,650 |
| 37 | 🇷🇸 Serbia | $12,380 |
| 38 | 🇦🇱 Albania | $8,920 |
| 39 | 🇧🇦 Bosnia & Herzegovina | $8,420 |
| 40 | 🇲🇰 North Macedonia | $7,690 |
| 41 | 🇧🇾 Belarus | $7,560 |
| 42 | 🇲🇩 Moldova | $7,490 |
| 43 | 🇽🇰 Kosovo | $6,390 |
| 44 | 🇺🇦 Ukraine | $5,660 |
| N/A | 🇪🇺 EU Average | $44,200 |
Note: Figures are rounded.
Three Nordic countries (Norway, Iceland, Denmark) also place highly, between $70,000-90,000. Other Nordic peers, Sweden and Finland rank just outside the top 10, between $55,000-60,000.
Meanwhile, Europe’s biggest economies in absolute terms, Germany, UK, and France, rank closer to the middle of the top 20, with GDP per capitas around $50,000.
Finally, at the end of the scale, Eastern Europe as a whole tends to have much lower per capita GDPs. In that group, Ukraine ranks last, at $5,660.
A Closer Look at Ukraine
For a broader comparison, Ukraine’s per capita GDP is similar to Iran ($5,310), El Salvador ($5,540), and Guatemala ($5,680).
According to experts, Ukraine’s economy has historically underperformed to expectations. After the fall of the Berlin Wall, the economy contracted for five straight years. Its transition to a Western, liberalized economic structure was overshadowed by widespread corruption, a limited taxpool, and few revenue sources.
Politically, its transformation from authoritarian regime to civil democracy has proved difficult, especially when it comes to institution building.
Finally, after the 2022 invasion of the country, Ukraine’s GDP contracted by 30% in a single year—the largest loss since independence. Large scale emigration—to the tune of six million refugees—is also playing a role.
Despite these challenges, the country’s economic growth has somewhat stabilized while fighting continues.

-

 Markets5 days ago
Visualizing Global Inflation Forecasts (2024-2026)
-

 Green2 weeks ago
The Carbon Footprint of Major Travel Methods
-

 Misc2 weeks ago
Visualizing the Most Common Pets in the U.S.
-

 Culture2 weeks ago
The World’s Top Media Franchises by All-Time Revenue
-

 voronoi1 week ago
Best Visualizations of April on the Voronoi App
-

 Wealth1 week ago
Charted: Which Country Has the Most Billionaires in 2024?
-

 Business1 week ago
The Top Private Equity Firms by Country
-

 Jobs1 week ago
The Best U.S. Companies to Work for According to LinkedIn