Energy
Ranked: The World’s Largest Energy Sources
The World’s Largest and Most Notable Energy Sources
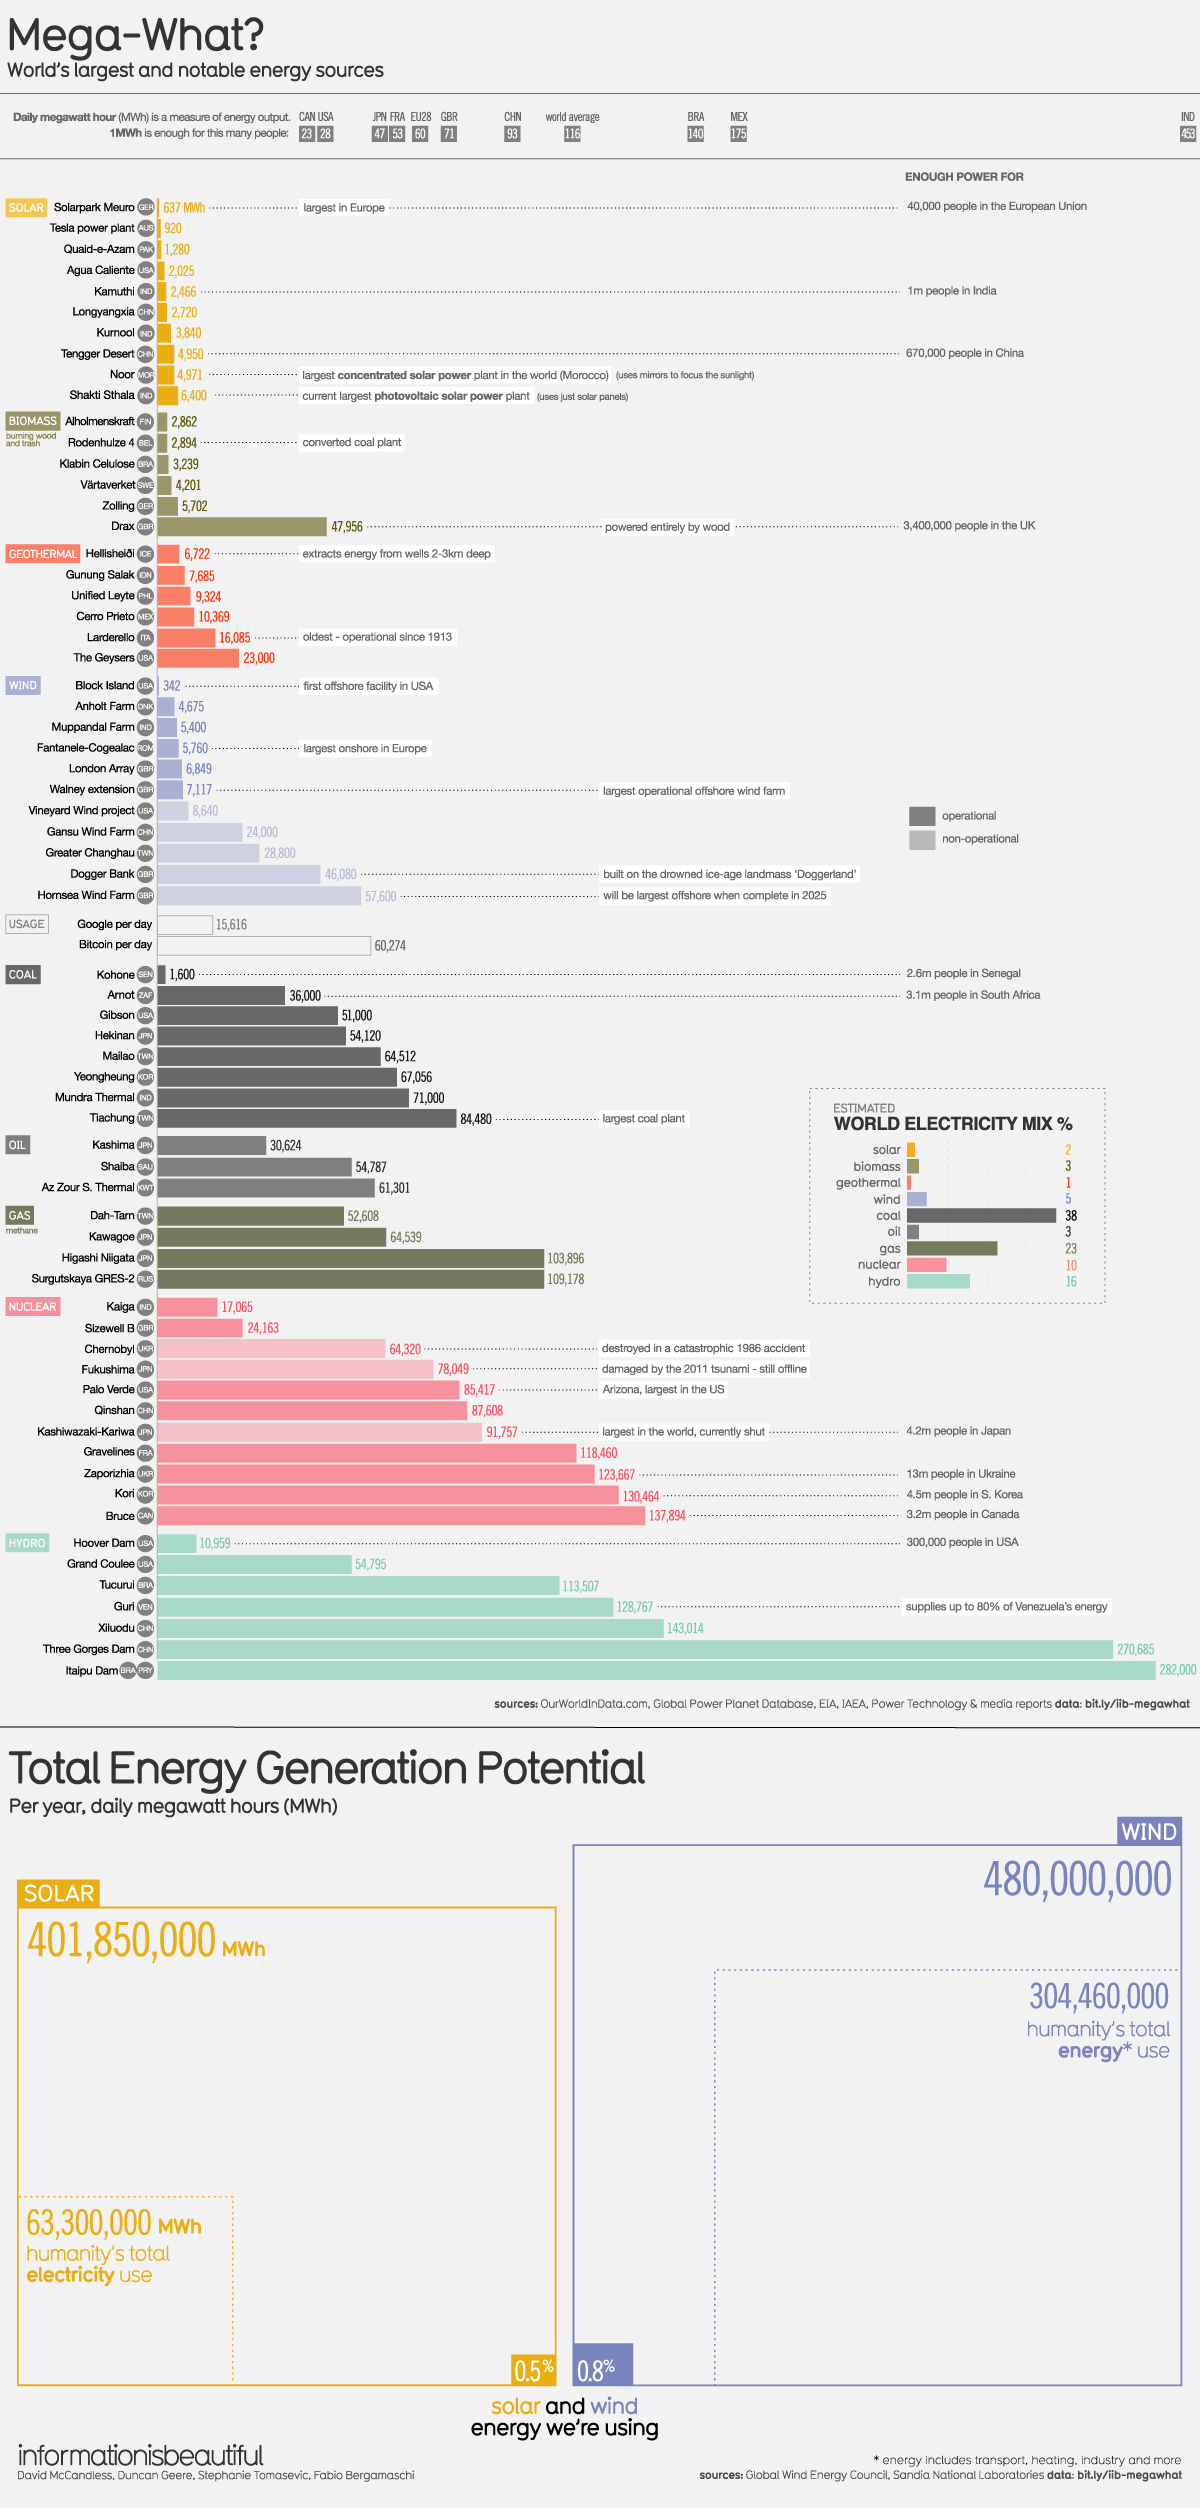
Every day, humans consume roughly 63,300,000 megawatt-hours (MWh) of electricity to power our homes, workplaces, and vehicles─about the same produced by over 5,700 Hoover Dams.
While present-day electricity generation is slanted heavily in favor of coal and gas on a global basis, renewable sources have started to gain ground.
Today’s graphic from Information is Beautiful lists the world’s largest energy sources and their energy outputs. These power plants are ranked using the daily megawatt-hour (MWh), the amount of energy a power source generates in a day.
Relying on Renewables
Located in the United Kingdom, Drax Power Station is the world’s largest biomass plant, powered chiefly by burning wood. Originally a coal-fired plant, Drax is expected to fully phase out coal by the year 2025.
Meanwhile, Tengger Desert Solar Park in China was the biggest solar operation until 2018, but it has since been displaced by the Shakti Sthala plant in India. The latter uses only solar panels─no mirrors─to generate energy from the sun.
Overall, solar photovoltaics have experienced the highest growth of all energy source segments, showing 31% annual growth─nearly triple the rate of wind power according to the International Energy Association (IEA).
Untapped Potential?
Currently, 27% of the world’s power comes from renewable energy sources such as solar, wind, hydro, biomass, and other similar resources.
However, according to back-of-the-envelope calculations, the potential for renewables is far beyond existing generation capacity. In fact, humans are just using 0.81% of solar’s potential generation capacity, and 0.57% of the potential from wind.
| Wind | Solar | Hydro | Geothermal | |
|---|---|---|---|---|
| Potential Energy Generation Capacity | 480,000,000 MWh | 401,850,000 MWh | 86,400,000 MWh | 48,767,123 MWh |
| Energy Generated (Current) | 3,884,983 MWh | 2,304,000 MWh | 11,465,753 MWh | 201,761 MWh |
| % of Potential Used | 0.81% | 0.57% | 13.3% | 0.41% |
Non-renewable Energy Sources
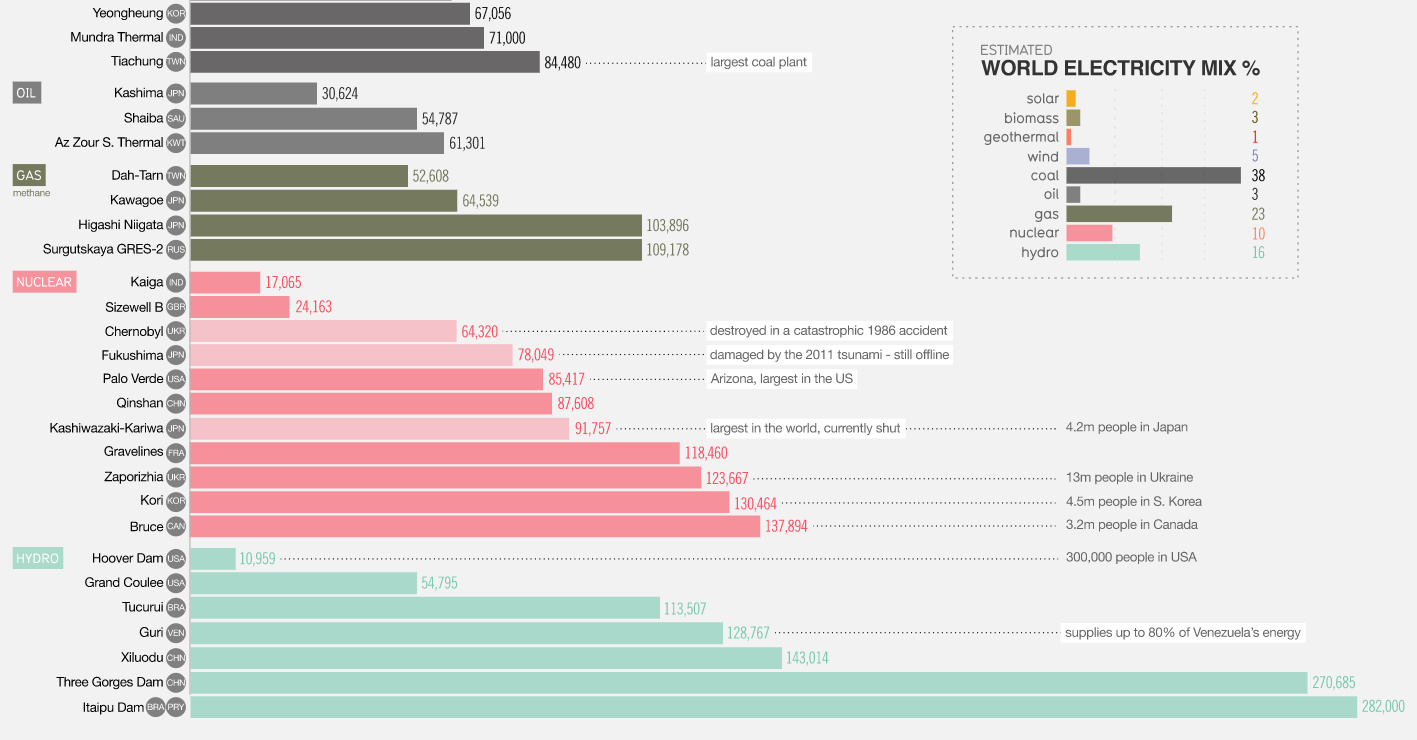
Nuclear power plants have perhaps the strongest stigma against them─largely due to international disasters such as Chernobyl and Fukushima.
However, nuclear power plants are still the most efficient energy sources, sitting at over 90% average capacity.
The largest nuclear plant (by MW) in the world, Kashiwazaki-Kariwa, is currently shut down due to damage from a 2007 earthquake, and awaiting confirmation to restart operations. As a result, the Bruce Nuclear Generating Station in Canada now holds the title of the largest operating reactor in the world. The plant currently generates about 30% of Ontario’s power.
In 2018, coal is still being used to generate roughly 38% of the world’s total electricity, followed by natural gas with a 23% share.
The Future of Energy Potential
Fittingly, the graphic also shows daily energy outputs for Google and Bitcoin usage. This data helps remind us that our online activity also consumes energy─something that will be top of mind as technology continues to advance and humans need to use more energy through our internet-enabled devices.
Understanding humanity’s need for energy is a daunting endeavor, but it’s critical to ensuring our planet has a sustainable source of energy for generations to come.


Who’s Building the Most Solar Energy?
This was originally posted on our Voronoi app. Download the app for free on iOS or Android and discover incredible data-driven charts from a variety of trusted sources.
In 2023, solar energy accounted for three-quarters of renewable capacity additions worldwide. Most of this growth occurred in Asia, the EU, and the U.S., continuing a trend observed over the past decade.
In this graphic, we illustrate the rise in installed solar photovoltaic (PV) capacity in China, the EU, and the U.S. between 2010 and 2022, measured in gigawatts (GW). Bruegel compiled the data..
Chinese Dominance
As of 2022, China’s total installed capacity stands at 393 GW, nearly double that of the EU’s 205 GW and surpassing the USA’s total of 113 GW by more than threefold in absolute terms.
| Installed solar capacity (GW) | China | EU27 | U.S. |
|---|---|---|---|
| 2022 | 393.0 | 205.5 | 113.0 |
| 2021 | 307.0 | 162.7 | 95.4 |
| 2020 | 254.0 | 136.9 | 76.4 |
| 2019 | 205.0 | 120.1 | 61.6 |
| 2018 | 175.3 | 104.0 | 52.0 |
| 2017 | 130.8 | 96.2 | 43.8 |
| 2016 | 77.8 | 91.5 | 35.4 |
| 2015 | 43.6 | 87.7 | 24.2 |
| 2014 | 28.4 | 83.6 | 18.1 |
| 2013 | 17.8 | 79.7 | 13.3 |
| 2012 | 6.7 | 71.1 | 8.6 |
| 2011 | 3.1 | 53.3 | 5.6 |
| 2010 | 1.0 | 30.6 | 3.4 |
Since 2017, China has shown a compound annual growth rate (CAGR) of approximately 25% in installed PV capacity, while the USA has seen a CAGR of 21%, and the EU of 16%.
Additionally, China dominates the production of solar power components, currently controlling around 80% of the world’s solar panel supply chain.
In 2022, China’s solar industry employed 2.76 million individuals, with manufacturing roles representing approximately 1.8 million and the remaining 918,000 jobs in construction, installation, and operations and maintenance.
The EU industry employed 648,000 individuals, while the U.S. reached 264,000 jobs.
According to the IEA, China accounts for almost 60% of new renewable capacity expected to become operational globally by 2028.
Despite the phasing out of national subsidies in 2020 and 2021, deployment of solar PV in China is accelerating. The country is expected to reach its national 2030 target for wind and solar PV installations in 2024, six years ahead of schedule.

-

 Markets6 days ago
The Most Valuable Companies in Major EU Economies
-

 Wealth2 weeks ago
Charted: Which City Has the Most Billionaires in 2024?
-

 Technology2 weeks ago
All of the Grants Given by the U.S. CHIPS Act
-

 Green2 weeks ago
The Carbon Footprint of Major Travel Methods
-

 United States2 weeks ago
Visualizing the Most Common Pets in the U.S.
-

 Culture2 weeks ago
The World’s Top Media Franchises by All-Time Revenue
-

 voronoi1 week ago
Best Visualizations of April on the Voronoi App
-

 Wealth1 week ago
Charted: Which Country Has the Most Billionaires in 2024?