Technology
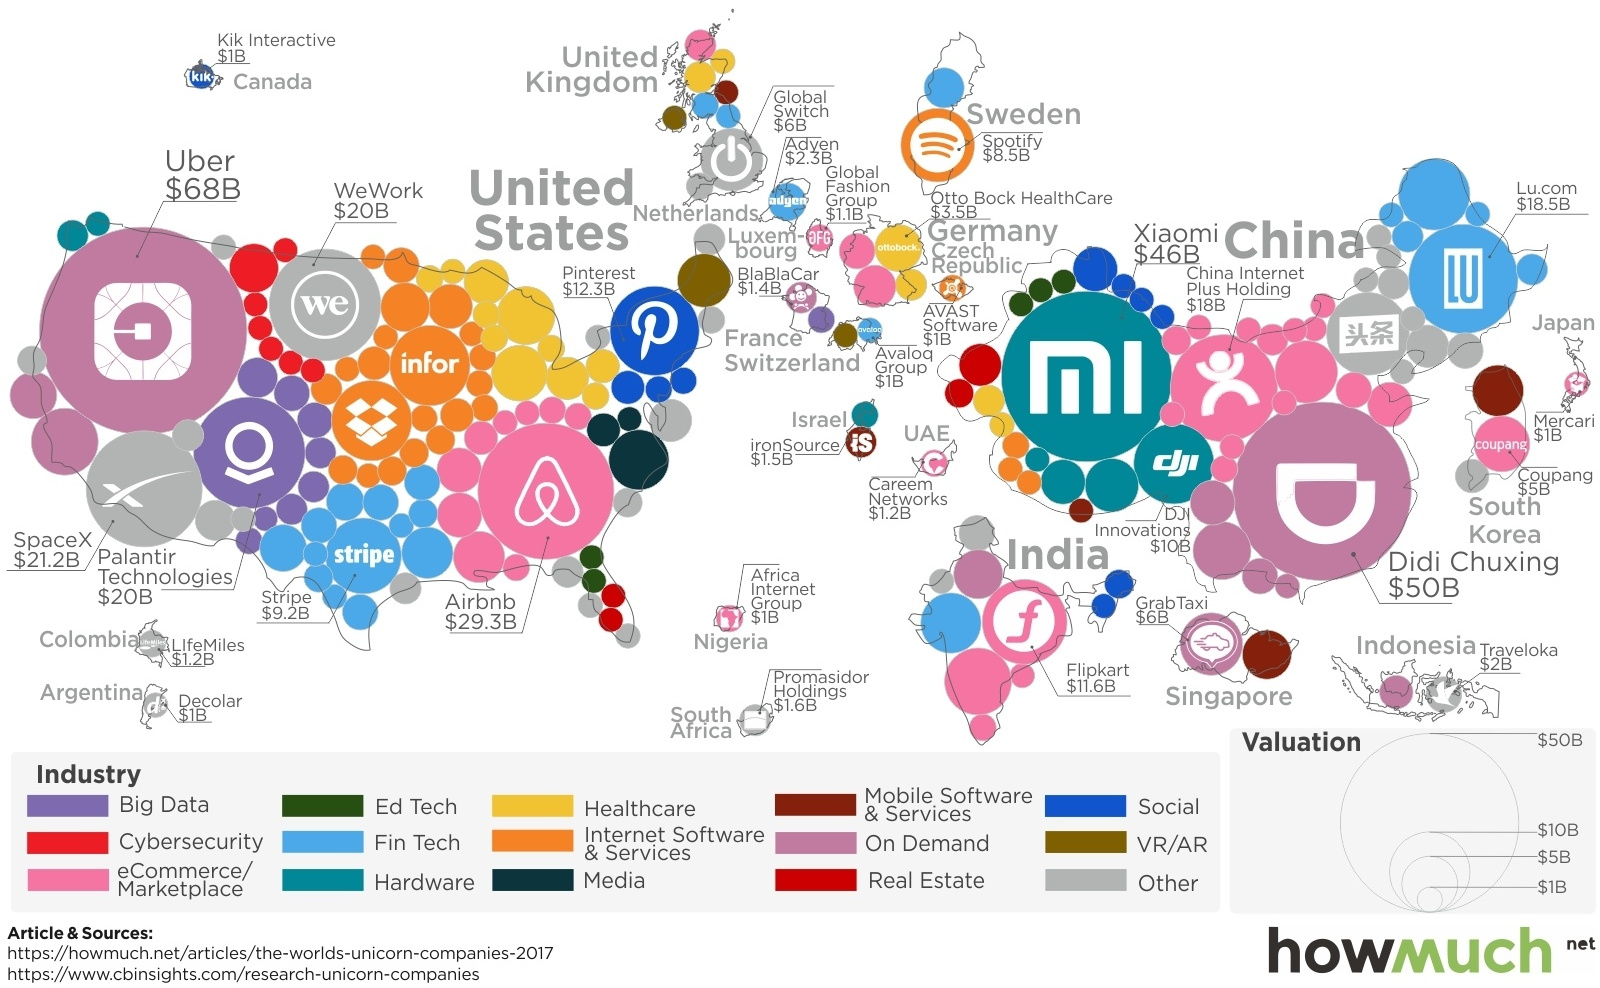
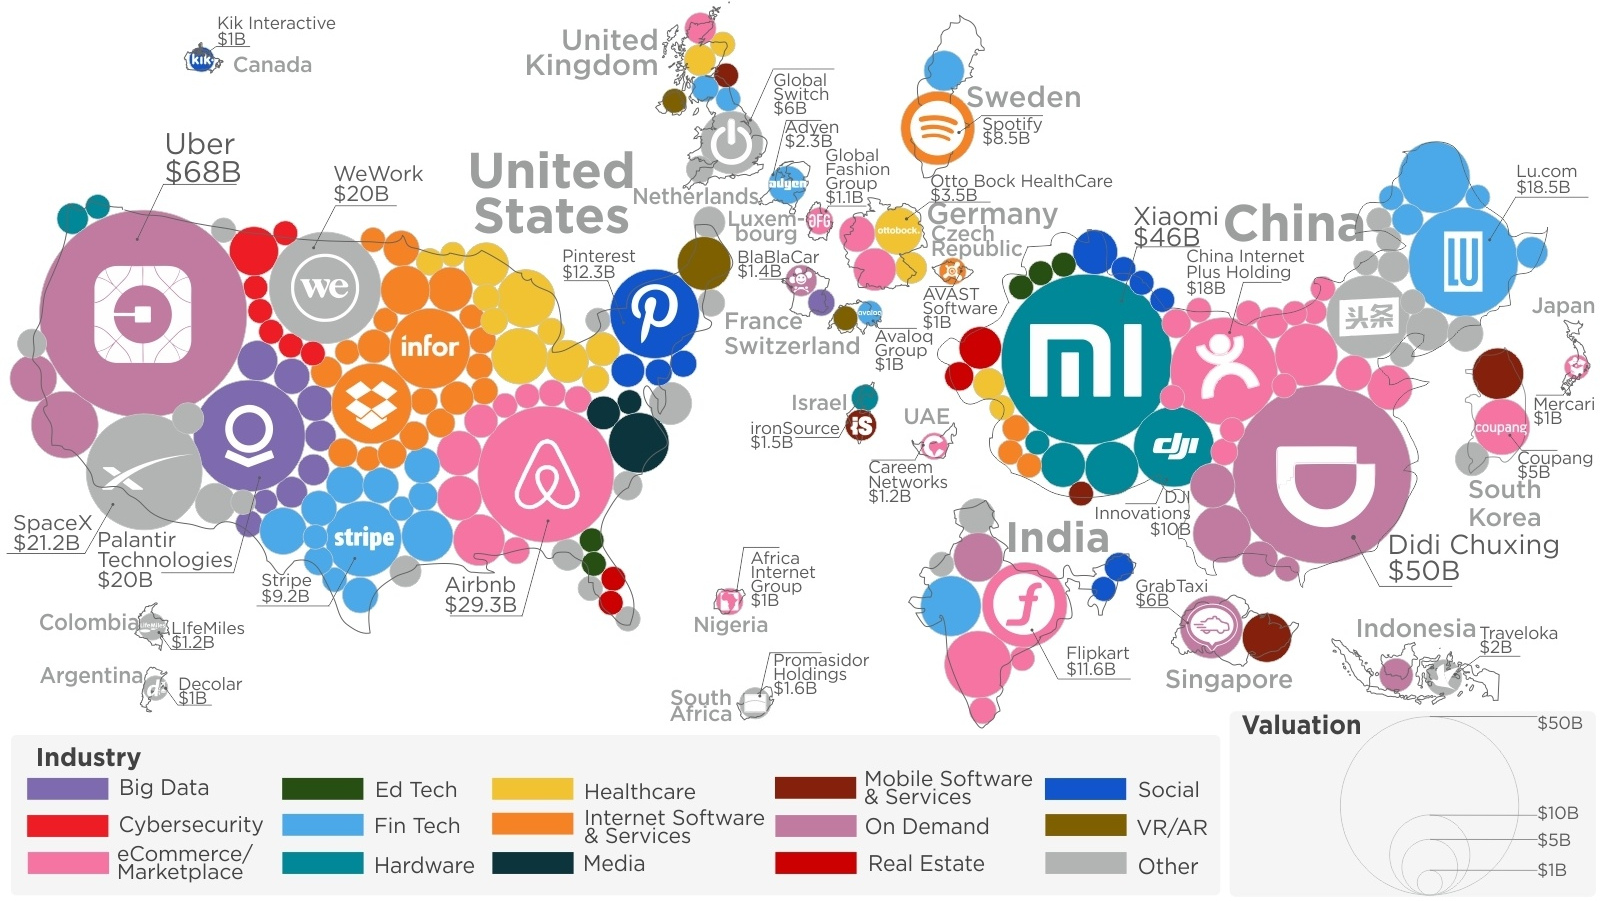
The World’s 200+ Unicorns, in One Giant Map
Unicorns are privately held startups valued at over $1B. Map is plotted based on country of origin, not exact geographic location.
The World’s 200+ Unicorns, in One Giant Map
Today’s infographic comes to us from cost information site HowMuch.net, and it shows the hundreds of unicorns around the world. The special “unicorn” moniker, of course, is reserved for privately-held startups that reach valuations of a billion dollars or more.
In this map, the startups are plotted plotted based on their country of origin, and not their physical geographic location (such as a specific city or state). Further, companies are organized also based on color, which represents the spectrum of sectors that these startups span across.
The Most Valuable Startups
Today, there are 214 unicorns worth a collective $744 billion – but that dollar value is distributed very unequally.
According to research firm CB Insights, the top 10 unicorns alone are worth $303.3 billion (41%), while the “bottom” 204 make up the remaining $440.7 billion (59%) of the pool.
| Rank | Unicorn | Country | Valuation ($B) | % of Unicorn Total |
|---|---|---|---|---|
| #1 | Uber | USA | $68 | 9.1% |
| #2 | Didi Chuxing | China | $50 | 6.7% |
| #3 | Xiaomi | China | $46 | 6.2% |
| #4 | Airbnb | USA | $29.3 | 3.9% |
| #5 | SpaceX | USA | $21.2 | 2.8% |
| #6 | Palantir Technologies | USA | $20 | 2.7% |
| #7 | WeWork | USA | $20 | 2.7% |
| #8 | Lu.com | China | $18.5 | 2.5% |
| #9 | China Internet Plus Holding | China | $18 | 2.4% |
| #10 | USA | $12.3 | 1.7% | |
| Top 10 Total | $303.3 | 40.8% | ||
| All Other 204 Unicorns | $440.70 | 59.2% |
Known Unknowns
You’re probably very familiar with companies like Uber and Airbnb, but almost half of the companies on the Top 10 list are from China.
What do these companies do that make them more valuable than big names like Dropbox, Stripe, or Spotify?
Didi Chuxing – $50 billion
Didi Chuxing is China’s most popular ride-sharing service, providing transportation to 400 million users across over 400 cities in China. In 2016, they even acquired Uber’s China division, winning an epic “battle” between these two transportation startup giants.
Xiaomi – $46 billion
Xiaomi designs and sells consumer electronics products, and is currently the world’s fifth-largest smartphone maker. (We talked about how Xiaomi and other companies in China are shaking up global the smartphone market here.)
Lu.com – $18.5 billion
Lufax is the second-largest P2P lender in China, and is partially owned by Ping An Insurance Group. The company plans to aggressively target other areas of fintech, including wealth, credit, payments, insurance, and regulatory tech.
China Internet Plus Holding – $18 billion
Formed by a merger in 2015, and now doing business as Meituan-Dianping, this company has the world’s largest online and on-demand delivery platform, recently reaching up to 10 million daily orders and deliveries. Think of it as a combination Groupon and Yelp.


Technology
All of the Grants Given by the U.S. CHIPS Act
Intel, TSMC, and more have received billions in subsidies from the U.S. CHIPS Act in 2024.


All of the Grants Given by the U.S. CHIPS Act
This was originally posted on our Voronoi app. Download the app for free on iOS or Android and discover incredible data-driven charts from a variety of trusted sources.
This visualization shows which companies are receiving grants from the U.S. CHIPS Act, as of April 25, 2024. The CHIPS Act is a federal statute signed into law by President Joe Biden that authorizes $280 billion in new funding to boost domestic research and manufacturing of semiconductors.
The grant amounts visualized in this graphic are intended to accelerate the production of semiconductor fabrication plants (fabs) across the United States.
Data and Company Highlights
The figures we used to create this graphic were collected from a variety of public news sources. The Semiconductor Industry Association (SIA) also maintains a tracker for CHIPS Act recipients, though at the time of writing it does not have the latest details for Micron.
| Company | Federal Grant Amount | Anticipated Investment From Company |
|---|---|---|
| 🇺🇸 Intel | $8,500,000,000 | $100,000,000,000 |
| 🇹🇼 TSMC | $6,600,000,000 | $65,000,000,000 |
| 🇰🇷 Samsung | $6,400,000,000 | $45,000,000,000 |
| 🇺🇸 Micron | $6,100,000,000 | $50,000,000,000 |
| 🇺🇸 GlobalFoundries | $1,500,000,000 | $12,000,000,000 |
| 🇺🇸 Microchip | $162,000,000 | N/A |
| 🇬🇧 BAE Systems | $35,000,000 | N/A |
BAE Systems was not included in the graphic due to size limitations
Intel’s Massive Plans
Intel is receiving the largest share of the pie, with $8.5 billion in grants (plus an additional $11 billion in government loans). This grant accounts for 22% of the CHIPS Act’s total subsidies for chip production.
From Intel’s side, the company is expected to invest $100 billion to construct new fabs in Arizona and Ohio, while modernizing and/or expanding existing fabs in Oregon and New Mexico. Intel could also claim another $25 billion in credits through the U.S. Treasury Department’s Investment Tax Credit.
TSMC Expands its U.S. Presence
TSMC, the world’s largest semiconductor foundry company, is receiving a hefty $6.6 billion to construct a new chip plant with three fabs in Arizona. The Taiwanese chipmaker is expected to invest $65 billion into the project.
The plant’s first fab will be up and running in the first half of 2025, leveraging 4 nm (nanometer) technology. According to TrendForce, the other fabs will produce chips on more advanced 3 nm and 2 nm processes.
The Latest Grant Goes to Micron
Micron, the only U.S.-based manufacturer of memory chips, is set to receive $6.1 billion in grants to support its plans of investing $50 billion through 2030. This investment will be used to construct new fabs in Idaho and New York.

-

 Debt1 week ago
How Debt-to-GDP Ratios Have Changed Since 2000
-

 Markets2 weeks ago
Ranked: The World’s Top Flight Routes, by Revenue
-

 Countries2 weeks ago
Population Projections: The World’s 6 Largest Countries in 2075
-

 Markets2 weeks ago
The Top 10 States by Real GDP Growth in 2023
-

 Demographics2 weeks ago
The Smallest Gender Wage Gaps in OECD Countries
-

 United States2 weeks ago
Where U.S. Inflation Hit the Hardest in March 2024
-

 Green2 weeks ago
Top Countries By Forest Growth Since 2001
-

 United States2 weeks ago
Ranked: The Largest U.S. Corporations by Number of Employees