Datastream
Which Industry Boasts the Most Billionaire Wealth?


The Briefing
- In every single sector, billionaire wealth saw positive growth from 2019 to 2020
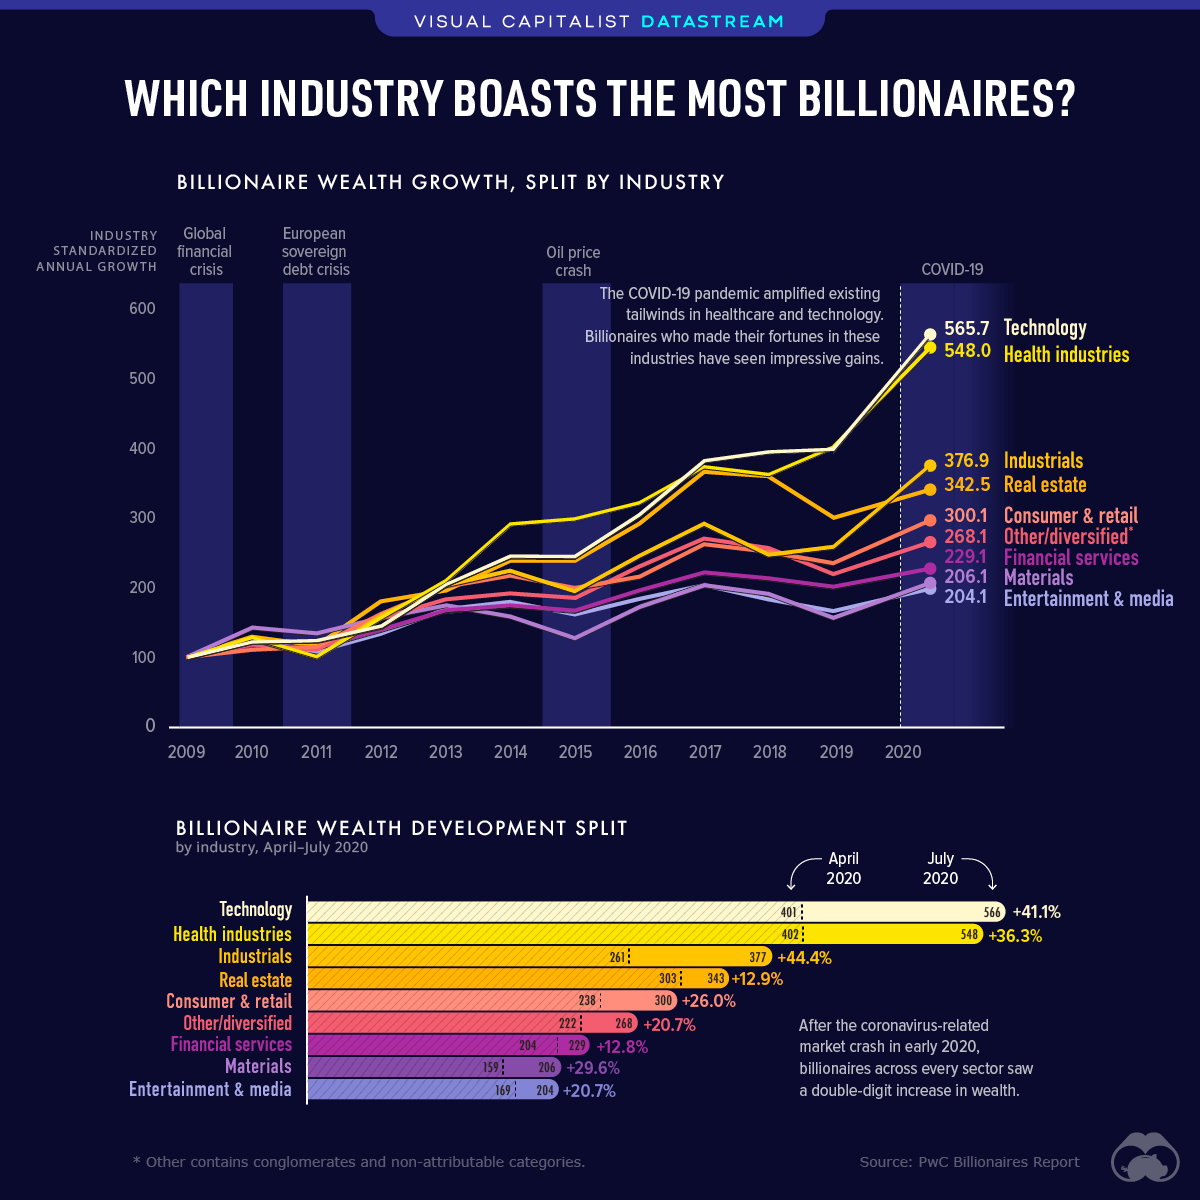
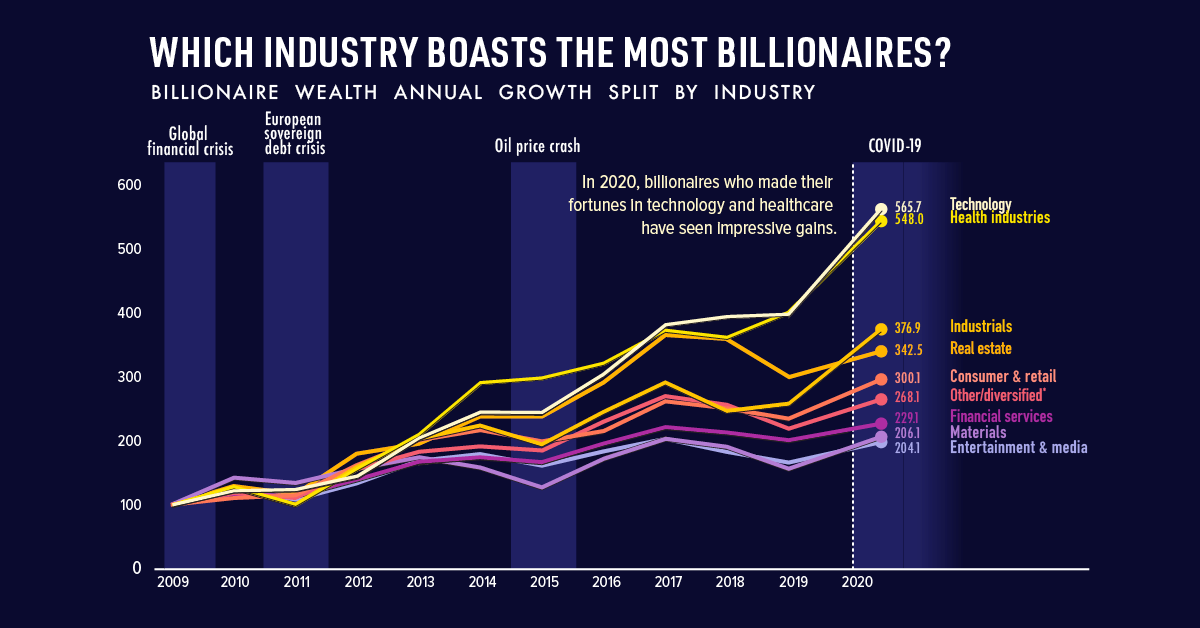
- Billionaire wealth in technology reached $566 billion after growing 41%, while healthcare reached $548 billion, growing 36%
It’s a Billionaires World
During the pandemic, billionaire wealth has shot up an average of 27% across various industries. Concurrently, the middle and working class have struggled, U.S. unemployment reached record highs, and millions of Americans are worried about facing eviction or foreclosure in the near future.
Tech and Healthcare Pull Ahead of the Pack
The industries that historically promote wealth creation for billionaires have undergone a number of changes in recent times.
Technology and healthcare have surged ahead of the pack, as companies in these industries possess qualities that have made innovation a huge value and growth driver. Innovative factors include AI, big data analytics, and a digital and cloud footprint.
| Industry | Wealth Per Industry ($ Billions) | Growth Rates between April-July 2020 |
|---|---|---|
| Technology | $565.7 | 41.1% |
| Health industries | $548.0 | 36.3% |
| Industrials | $376.9 | 44.4% |
| Real estate | $342.5 | 12.9% |
| Consumer & retail | $300.1 | 26% |
| Other/diversified | $268.1 | 20.7% |
| Financial services | $229.1 | 12.8% |
| Materials | $206.1 | 29.6% |
| Entertainment & media | $204.1 | 20.7% |
The pandemic enabled those well equipped to pivot towards the new environment and business landscape, while those without these advancements were forced to haphazardly adjust.
As a result, billionaires in these two industries have reaped great rewards. Between April-July 2020 they generated $164.8 billion and $145.7 billion in wealth between technology and healthcare respectively.
Playing Catchup
The graphic shows the two leading industries building a considerable spread between them and those lagging behind. As these innovative technologies take the mainstream, it may suggest the other industries will have the chance to catch up.
In real estate for instance, the wave of innovation is least prevalent according to the original report, yet disruption and innovation are already on their way. Consider two stocks in Zillow and Redfin: the first operates in residential real estate services exclusively through web and mobile, while the latter is a digital real estate brokerage that has the potential to undercut real estate agents.
Could these industry wealth results in a post-pandemic world look very different?
Where does this data come from?
Source: PWC Billionaires Report.
Notes: This data was released in the summer of 2020


Datastream
Can You Calculate Your Daily Carbon Footprint?
Discover how the average person’s carbon footprint impacts the environment and learn how carbon credits can offset your carbon footprint.


The Briefing
- A person’s carbon footprint is substantial, with activities such as food consumption creating as much as 4,500 g of CO₂ emissions daily.
- By purchasing carbon credits from Carbon Streaming Corporation, you can offset your own emissions and fund positive climate action.
Your Everyday Carbon Footprint
While many large businesses and countries have committed to net-zero goals, it is essential to acknowledge that your everyday activities also contribute to global emissions.
In this graphic, sponsored by Carbon Streaming Corporation, we will explore how the choices we make and the products we use have a profound impact on our carbon footprint.
Carbon Emissions by Activity
Here are some of the daily activities and products of the average person and their carbon footprint, according to Clever Carbon.
| Household Activities & Products | CO2 Emissions (g) |
|---|---|
| 💡 Standard Light Bulb (100 watts, four hours) | 172 g |
| 📱 Mobile Phone Use (195 minutes per day)* | 189 g |
| 👕 Washing Machine (0.63 kWh) | 275 g |
| 🔥 Electric Oven (1.56 kWh) | 675 g |
| ♨️ Tumble Dryer (2.5 kWh) | 1,000 g |
| 🧻 Toilet Roll (2 ply) | 1,300 g |
| 🚿 Hot Shower (10 mins) | 2,000 g |
| 🚙 Daily Commute (one hour, by car) | 3,360 g |
| 🍽️ Average Daily Food Consumption (three meals of 600 calories) | 4,500 g |
| *Phone use based on yearly use of 69kg per the source, Reboxed | |
Your choice of transportation plays a crucial role in determining your carbon footprint. For instance, a 15 km daily commute to work on public transport generates an average of 1,464 g of CO₂ emissions. Compared to 3,360 g—twice the volume for a journey the same length by car.
By opting for more sustainable modes of transport, such as cycling, walking, or public transportation, you can significantly reduce your carbon footprint.
Addressing Your Carbon Footprint
One way to compensate for your emissions is by purchasing high-quality carbon credits.
Carbon credits are used to help fund projects that avoid, reduce or remove CO₂ emissions. This includes nature-based solutions such as reforestation and improved forest management, or technology-based solutions such as the production of biochar and carbon capture and storage (CCS).
While carbon credits offer a potential solution for individuals to help reduce global emissions, public awareness remains a significant challenge. A BCG-Patch survey revealed that only 34% of U.S. consumers are familiar with carbon credits, and only 3% have purchased them in the past.
About Carbon Streaming
By financing the creation or expansion of carbon projects, Carbon Streaming Corporation secures the rights to future carbon credits generated by these sustainable projects. You can then purchase these carbon credits to help fund climate solutions around the world and compensate for your own emissions.
Ready to get involved?
>> Learn more about purchasing carbon credits at Carbon Streaming

-

 Education1 week ago
How Hard Is It to Get Into an Ivy League School?
-

 Technology2 weeks ago
Ranked: Semiconductor Companies by Industry Revenue Share
-

 Markets2 weeks ago
Ranked: The World’s Top Flight Routes, by Revenue
-

 Demographics2 weeks ago
Population Projections: The World’s 6 Largest Countries in 2075
-

 Markets2 weeks ago
The Top 10 States by Real GDP Growth in 2023
-

 Demographics2 weeks ago
The Smallest Gender Wage Gaps in OECD Countries
-

 Economy2 weeks ago
Where U.S. Inflation Hit the Hardest in March 2024
-

 Green2 weeks ago
Top Countries By Forest Growth Since 2001