Datastream
The World’s Top 10 Most Spoken Languages


The Briefing
- Around 15% of the global population speaks English, making it the world’s most spoken language
- However, only a third of English speakers consider it their native language
- There are more native Mandarin Chinese speakers worldwide than native English speakers
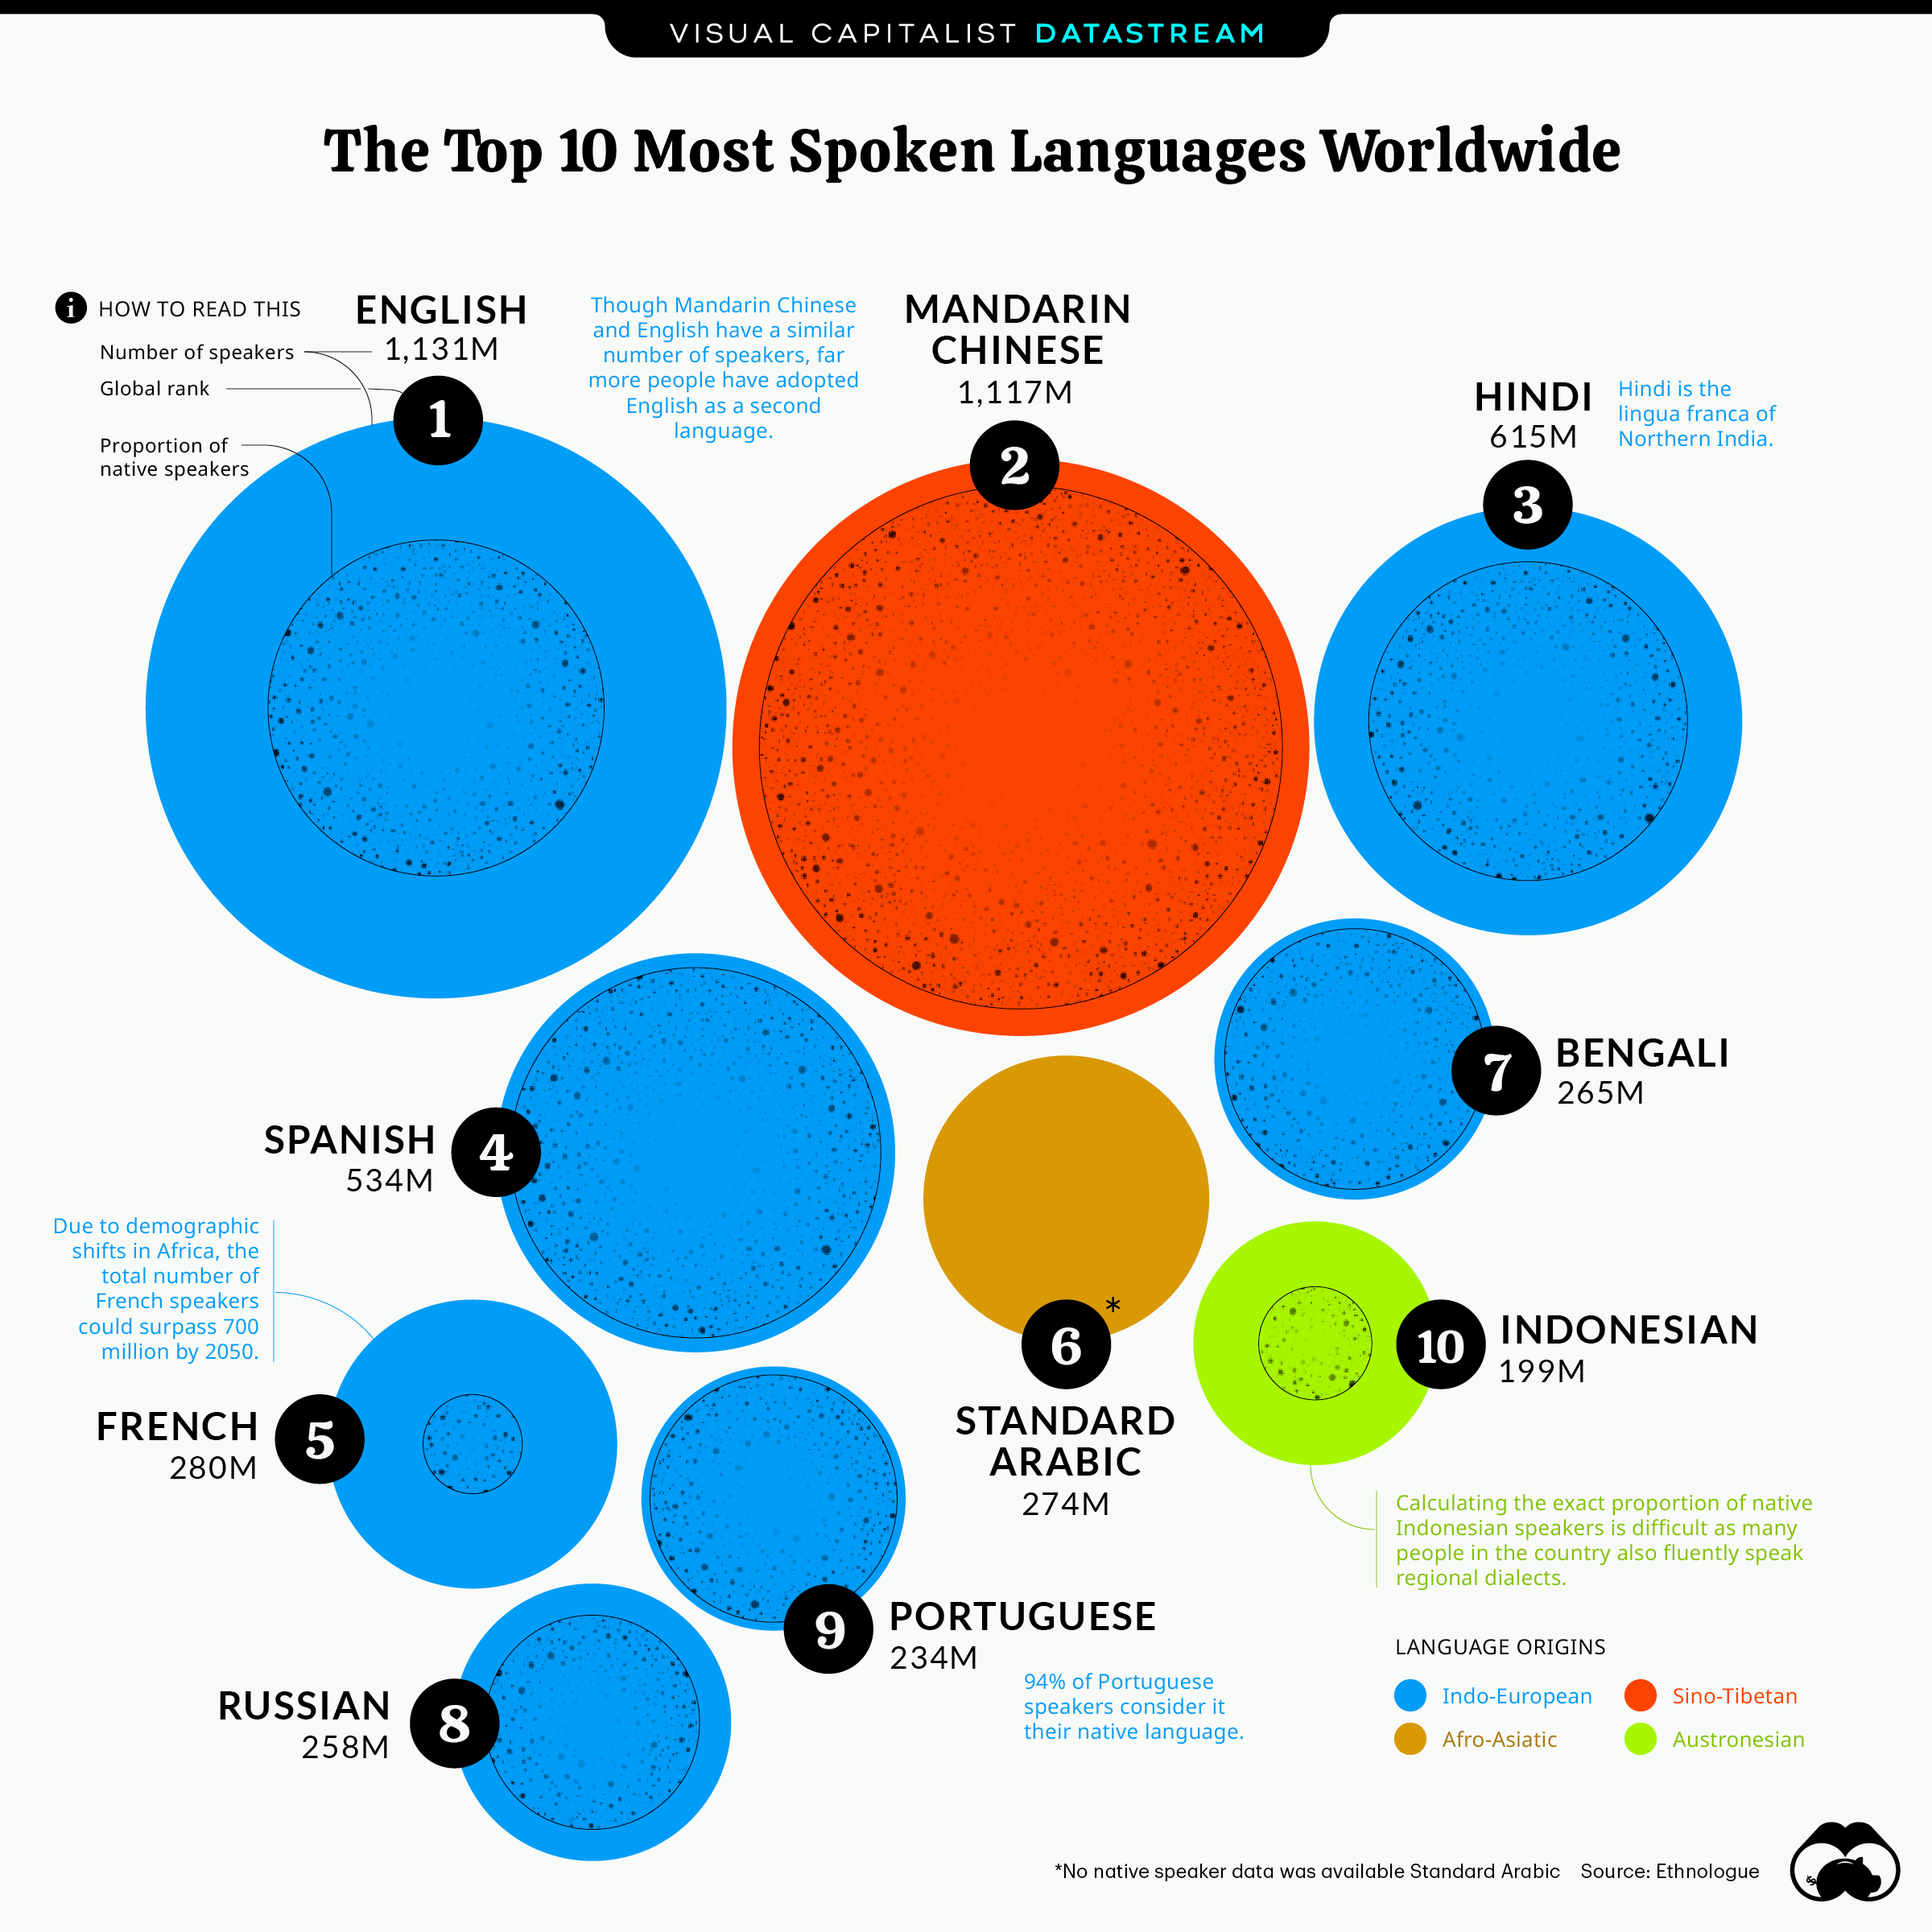
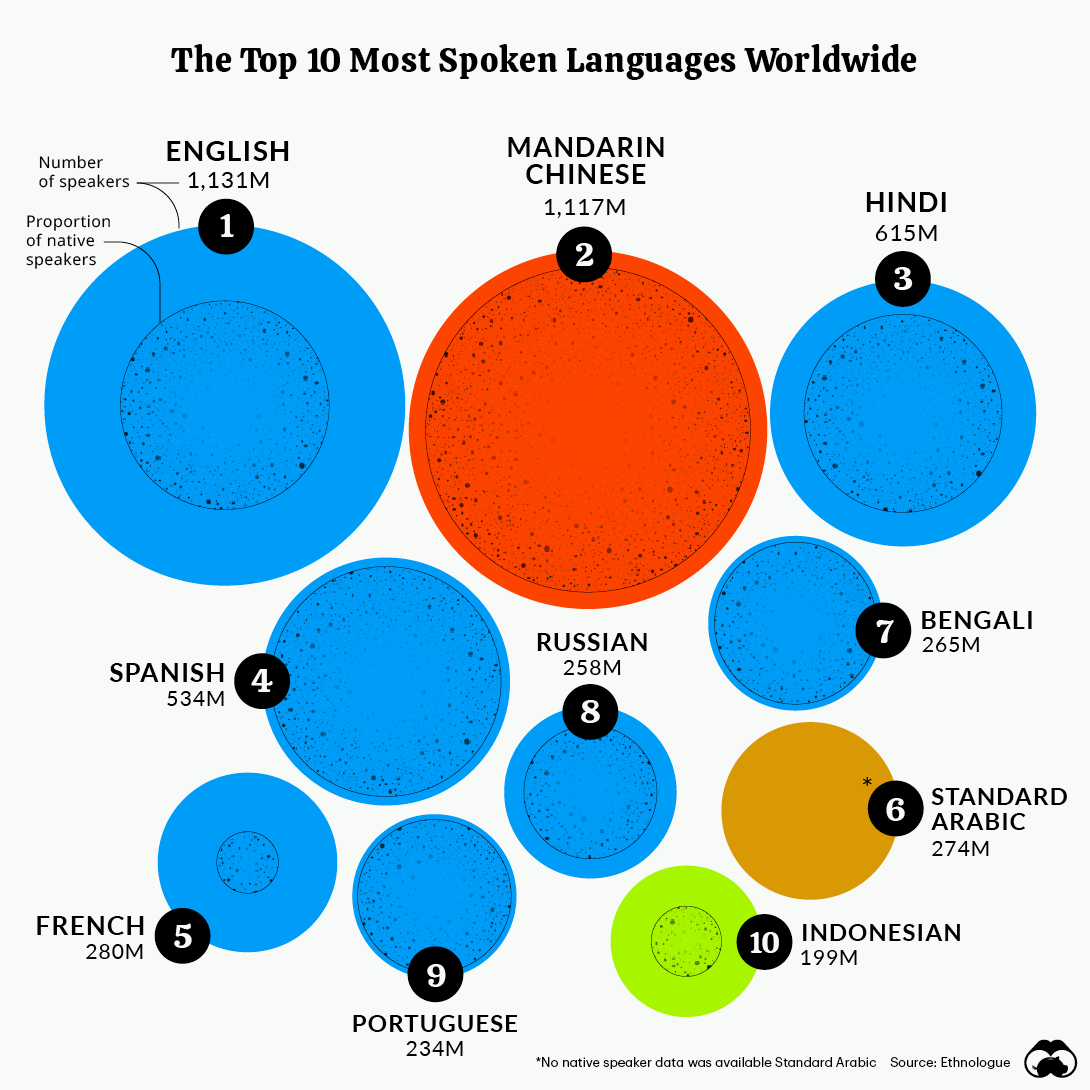
The World’s 10 Most Spoken Languages
In today’s increasingly globalized world, having a shared means of communication—or an international language, rather—is more important than ever.
With over 1.1 billion speakers worldwide, English is currently the closest we’ve come to a lingua franca, a common language that connects people from different backgrounds.
However, Mandarin Chinese may one day catch up. Here’s a look at the top 10 most spoken languages across the globe:
| Rank | Language | Total Speakers |
|---|---|---|
| 1 | English | 1,132 million |
| 2 | Mandarin Chinese | 1,117 million |
| 3 | Hindi | 615 million |
| 4 | Spanish | 534 million |
| 5 | French | 280 million |
| 6 | Standard Arabic | 274 million |
| 7 | Bengali | 265 million |
| 8 | Russian | 258 million |
| 9 | Portuguese | 234 million |
| 10 | Indonesian | 199 million |
While English and Mandarin Chinese come close when looking at their total number of speakers, English has a wider geographical distribution—it’s classified as an official language in 67 different countries worldwide.
In contrast, Mandarin Chinese is recognized as an official language in just five regions.
Top 10 Languages By Native Speakers
Things look slightly different when looking at total native speakers, or people who consider a language their first/primary one.
In this instance, Mandarin Chinese and Spanish outrank English:
| Rank | Language | Native Speakers |
|---|---|---|
| 1 | Mandarin Chinese | 918 million |
| 2 | Spanish | 460 million |
| 3 | English | 379 million |
| 4 | Hindi | 341 million |
| 5 | Bengali | 228 million |
| 6 | Portuguese | 221 million |
| 7 | Russian | 154 million |
| 8 | Japanese | 128 million |
| 9 | Western Punjabi | 93 million |
| 10 | Marathi | 83 million |
This begs the question—will English remain the “dominant” language in the years to come, or will the world be switching to a new lingua franca in the future?
»For a more in-depth look at languages, visit: The 100 Most Spoken Languages Around the World
Where does this data come from?
Source: Ethnologue
Notes: This database covers a majority of the world’s population and details approximately 7,111 living languages


Datastream
Can You Calculate Your Daily Carbon Footprint?
Discover how the average person’s carbon footprint impacts the environment and learn how carbon credits can offset your carbon footprint.


The Briefing
- A person’s carbon footprint is substantial, with activities such as food consumption creating as much as 4,500 g of CO₂ emissions daily.
- By purchasing carbon credits from Carbon Streaming Corporation, you can offset your own emissions and fund positive climate action.
Your Everyday Carbon Footprint
While many large businesses and countries have committed to net-zero goals, it is essential to acknowledge that your everyday activities also contribute to global emissions.
In this graphic, sponsored by Carbon Streaming Corporation, we will explore how the choices we make and the products we use have a profound impact on our carbon footprint.
Carbon Emissions by Activity
Here are some of the daily activities and products of the average person and their carbon footprint, according to Clever Carbon.
| Household Activities & Products | CO2 Emissions (g) |
|---|---|
| 💡 Standard Light Bulb (100 watts, four hours) | 172 g |
| 📱 Mobile Phone Use (195 minutes per day)* | 189 g |
| 👕 Washing Machine (0.63 kWh) | 275 g |
| 🔥 Electric Oven (1.56 kWh) | 675 g |
| ♨️ Tumble Dryer (2.5 kWh) | 1,000 g |
| 🧻 Toilet Roll (2 ply) | 1,300 g |
| 🚿 Hot Shower (10 mins) | 2,000 g |
| 🚙 Daily Commute (one hour, by car) | 3,360 g |
| 🍽️ Average Daily Food Consumption (three meals of 600 calories) | 4,500 g |
| *Phone use based on yearly use of 69kg per the source, Reboxed | |
Your choice of transportation plays a crucial role in determining your carbon footprint. For instance, a 15 km daily commute to work on public transport generates an average of 1,464 g of CO₂ emissions. Compared to 3,360 g—twice the volume for a journey the same length by car.
By opting for more sustainable modes of transport, such as cycling, walking, or public transportation, you can significantly reduce your carbon footprint.
Addressing Your Carbon Footprint
One way to compensate for your emissions is by purchasing high-quality carbon credits.
Carbon credits are used to help fund projects that avoid, reduce or remove CO₂ emissions. This includes nature-based solutions such as reforestation and improved forest management, or technology-based solutions such as the production of biochar and carbon capture and storage (CCS).
While carbon credits offer a potential solution for individuals to help reduce global emissions, public awareness remains a significant challenge. A BCG-Patch survey revealed that only 34% of U.S. consumers are familiar with carbon credits, and only 3% have purchased them in the past.
About Carbon Streaming
By financing the creation or expansion of carbon projects, Carbon Streaming Corporation secures the rights to future carbon credits generated by these sustainable projects. You can then purchase these carbon credits to help fund climate solutions around the world and compensate for your own emissions.
Ready to get involved?
>> Learn more about purchasing carbon credits at Carbon Streaming

-

 Maps2 weeks ago
Mapped: Average Wages Across Europe
-

 Money1 week ago
Which States Have the Highest Minimum Wage in America?
-

 Real Estate1 week ago
Ranked: The Most Valuable Housing Markets in America
-

 Markets1 week ago
Charted: Big Four Market Share by S&P 500 Audits
-

 AI1 week ago
The Stock Performance of U.S. Chipmakers So Far in 2024
-

 Automotive1 week ago
Almost Every EV Stock is Down After Q1 2024
-

 Money2 weeks ago
Where Does One U.S. Tax Dollar Go?
-

 Green2 weeks ago
Ranked: Top Countries by Total Forest Loss Since 2001