Energy
Which Countries are Buying Russian Fossil Fuels?
![]() Subscribe to the Elements free mailing list for more like this
Subscribe to the Elements free mailing list for more like this
The Countries Buying Russian Fossil Fuels Since the Invasion
This was originally posted on Elements. Sign up to the free mailing list to get beautiful visualizations on natural resource megatrends in your email every week.
A year on from Russia’s initial invasion of Ukraine, Russian fossil fuel exports are still flowing to various nations around the world.
According to estimates from the Centre for Research on Energy and Clean Air (CREA), since the invasion started about a year ago, Russia has made more than $315 billion in revenue from fossil fuel exports around the world, with nearly half ($149 billion) coming from EU nations.
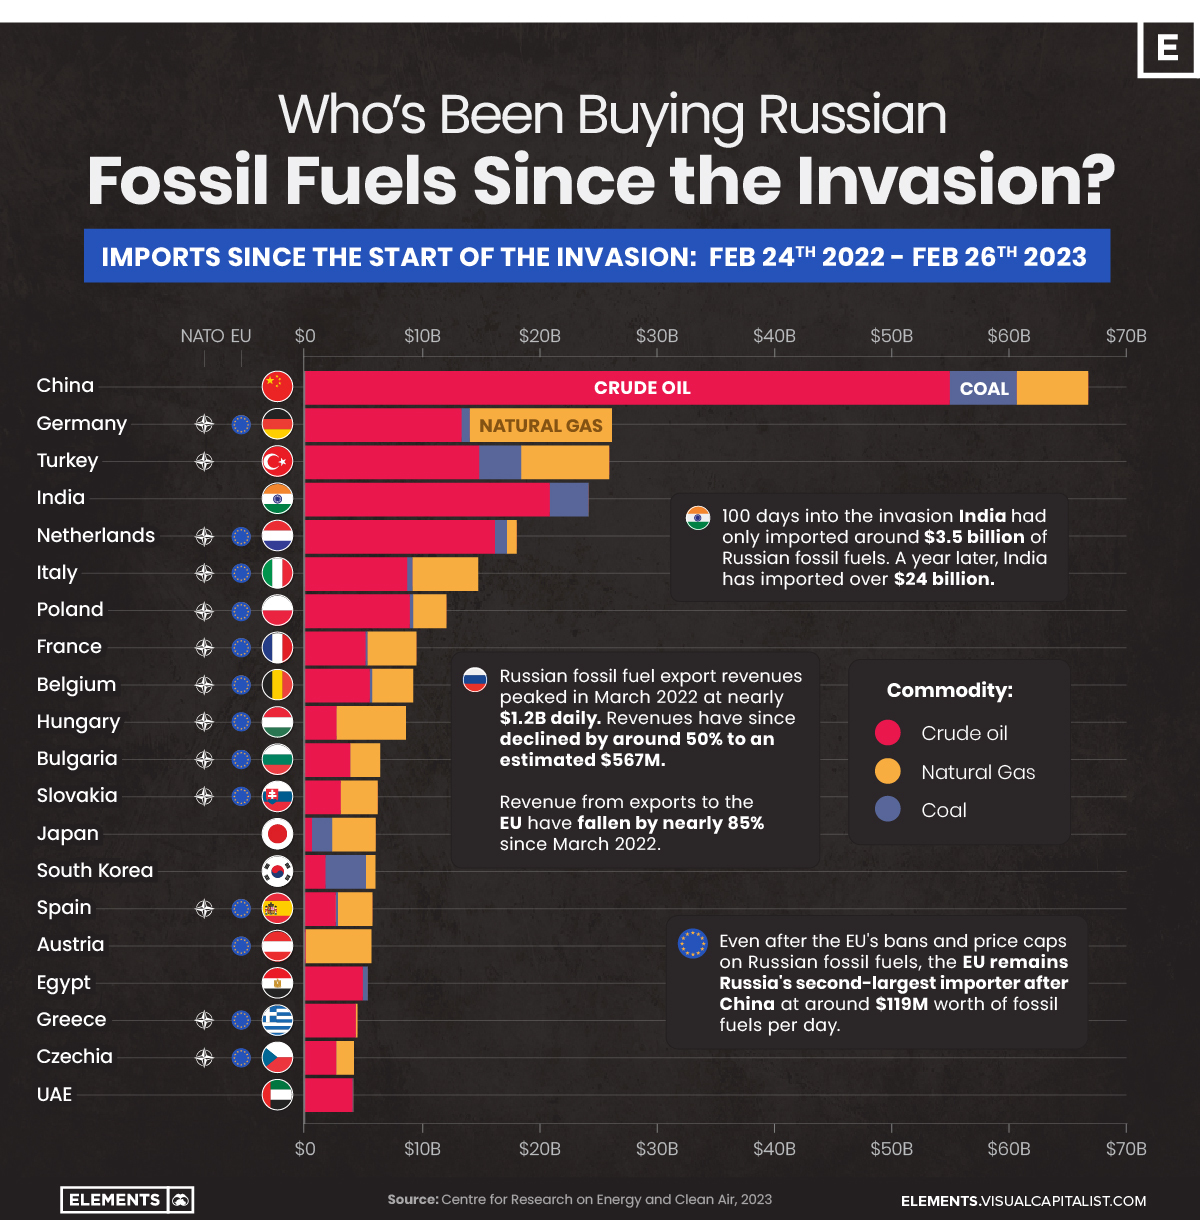
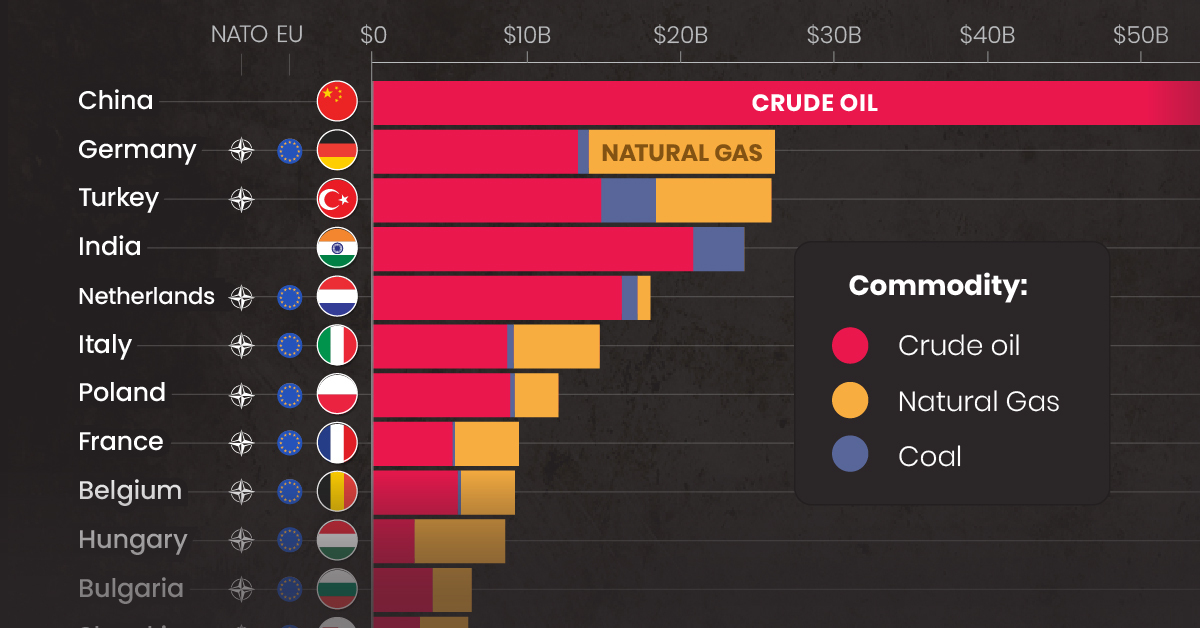
This graphic uses data from the CREA to visualize the countries that have bought the most Russian fossil fuels since the invasion, showcasing the billions in revenue Russia has made from these exports.
Top Importers of Russian Fossil Fuels
As one might expect, China has been the top buyer of Russian fossil fuels since the start of the invasion. Russia’s neighbor and informal ally has primarily imported crude oil, which has made up more than 80% of its imports totaling more than $55 billion since the start of the invasion.
The EU’s largest economy, Germany, is the second-largest importer of Russian fossil fuels, largely due to its natural gas imports worth more than $12 billion alone.
| Country | Total Value of Russian Fossil Fuel Imports* | Crude Oil | Natural Gas | Coal |
|---|---|---|---|---|
| 🇨🇳 China | $66.6B | $54.9B | $6.1B | $5.7B |
| 🇩🇪 Germany | $26.1B | $13.3B | $12.1B | $0.7B |
| 🇹🇷 Turkey | $25.9B | $14.8B | $7.5B | $3.6B |
| 🇮🇳 India | $24.1B | $20.8B | $0 | $3.3B |
| 🇳🇱 Netherlands | $18.0B | $16.2B | $0.8B | $1.0B |
| 🇮🇹 Italy | $14.8B | $8.7B | $5.6B | $0.4B |
| 🇵🇱 Poland | $12.1B | $8.9B | $2.9B | $0.3B |
| 🇫🇷 France | $9.5B | $5.2B | $4.2B | $0.2B |
| 🇧🇪 Belgium | $9.2B | $5.5B | $3.5B | $0.2B |
| 🇭🇺 Hungary | $8.6B | $2.7B | $5.9B | $0 |
| 🇧🇬 Bulgaria | $6.4B | $3.9B | $2.5B | $0 |
| 🇸🇰 Slovakia | $6.2B | $3.1B | $3.1B | $0 |
| 🇯🇵 Japan | $6.0B | $0.6B | $3.7B | $1.7B |
| 🇰🇷 South Korea | $6.0B | $1.8B | $0.8B | $3.5B |
| 🇪🇸 Spain | $5.8B | $2.7B | $2.9B | $0.2B |
| 🇦🇹 Austria | $5.7B | $0.1B | $5.6B | $0 |
| 🇪🇬 Egypt | $5.4B | $4.9B | $0 | $0.4B |
| 🇬🇷 Greece | $4.5B | $4.3B | $0.2B | $0 |
| 🇨🇿 Czechia | $4.2B | $2.7B | $1.5B | $0 |
| 🇦🇪 UAE | $4.1B | $4.1B | $0 | $0.1B |
*Over the time period of Feb 24, 2022 to Feb 26, 2023 in U.S. dollars
Turkey, a member of NATO but not of the EU, closely follows Germany as the third-largest importer of Russian fossil fuels since the invasion. The country is likely to overtake Germany soon, as not being part of the EU means it isn’t affected by the bloc’s Russian import bans put in place over the last year.
Although more than half of the top 20 fossil fuel importing nations are from the EU, nations from the bloc and the rest of Europe have been curtailing their imports as bans and price caps on Russian coal imports, crude oil seaborne shipments, and petroleum product imports have come into effect.
Russia’s Declining Fossil Fuel Revenues
The EU’s bans and price caps have resulted in a decline of daily fossil fuel revenues from the bloc of nearly 85%, falling from their March 2022 peak of $774 million per day to $119 million as of February 22nd, 2023.
Although India has stepped up its fossil fuel imports in the meantime, from $3 million daily on the day of the invasion to $81 million per day as of February 22nd of this year, this increase doesn’t come close to making up the $655 million hole left by EU nations’ reduction in imports.
Similarly, even if African nations have doubled their Russian fuel imports since December of last year, Russian seaborne oil product exports have still declined by 21% overall since January according to S&P Global.
Other Factors Impacting Revenues
Overall, from their peak on March 24th of around $1.17 billion in daily revenue, Russian fossil fuel revenues have declined by more than 50% to just $560 million daily.
Along with the EU’s reductions in purchases, a key contributing factor has been the decline in Russian crude oil’s price, which has also declined by nearly 50% since the invasion, from $99 a barrel to $50 a barrel today.
Whether these declines will continue is yet to be determined. That said, the EU’s 10th set of sanctions, announced on February 25th, ban the import of bitumen, related materials like asphalt, synthetic rubbers, and carbon blacks and are estimated to reduce overall Russian export revenues by almost $1.4 billion.


Who’s Building the Most Solar Energy?
This was originally posted on our Voronoi app. Download the app for free on iOS or Android and discover incredible data-driven charts from a variety of trusted sources.
In 2023, solar energy accounted for three-quarters of renewable capacity additions worldwide. Most of this growth occurred in Asia, the EU, and the U.S., continuing a trend observed over the past decade.
In this graphic, we illustrate the rise in installed solar photovoltaic (PV) capacity in China, the EU, and the U.S. between 2010 and 2022, measured in gigawatts (GW). Bruegel compiled the data..
Chinese Dominance
As of 2022, China’s total installed capacity stands at 393 GW, nearly double that of the EU’s 205 GW and surpassing the USA’s total of 113 GW by more than threefold in absolute terms.
| Installed solar capacity (GW) | China | EU27 | U.S. |
|---|---|---|---|
| 2022 | 393.0 | 205.5 | 113.0 |
| 2021 | 307.0 | 162.7 | 95.4 |
| 2020 | 254.0 | 136.9 | 76.4 |
| 2019 | 205.0 | 120.1 | 61.6 |
| 2018 | 175.3 | 104.0 | 52.0 |
| 2017 | 130.8 | 96.2 | 43.8 |
| 2016 | 77.8 | 91.5 | 35.4 |
| 2015 | 43.6 | 87.7 | 24.2 |
| 2014 | 28.4 | 83.6 | 18.1 |
| 2013 | 17.8 | 79.7 | 13.3 |
| 2012 | 6.7 | 71.1 | 8.6 |
| 2011 | 3.1 | 53.3 | 5.6 |
| 2010 | 1.0 | 30.6 | 3.4 |
Since 2017, China has shown a compound annual growth rate (CAGR) of approximately 25% in installed PV capacity, while the USA has seen a CAGR of 21%, and the EU of 16%.
Additionally, China dominates the production of solar power components, currently controlling around 80% of the world’s solar panel supply chain.
In 2022, China’s solar industry employed 2.76 million individuals, with manufacturing roles representing approximately 1.8 million and the remaining 918,000 jobs in construction, installation, and operations and maintenance.
The EU industry employed 648,000 individuals, while the U.S. reached 264,000 jobs.
According to the IEA, China accounts for almost 60% of new renewable capacity expected to become operational globally by 2028.
Despite the phasing out of national subsidies in 2020 and 2021, deployment of solar PV in China is accelerating. The country is expected to reach its national 2030 target for wind and solar PV installations in 2024, six years ahead of schedule.

-

 Markets7 days ago
The Best U.S. Companies to Work for According to LinkedIn
-

 VC+2 weeks ago
VC+: Get Our Key Takeaways From the IMF’s World Economic Outlook
-

 Demographics2 weeks ago
The Countries That Have Become Sadder Since 2010
-

 Money2 weeks ago
Charted: Who Has Savings in This Economy?
-

 Technology2 weeks ago
Visualizing AI Patents by Country
-

 Economy2 weeks ago
Economic Growth Forecasts for G7 and BRICS Countries in 2024
-

 Wealth1 week ago
Charted: Which City Has the Most Billionaires in 2024?
-

 Technology1 week ago
All of the Grants Given by the U.S. CHIPS Act