Money
Where Does One U.S. Tax Dollar Go?
![]() See this visualization first on the Voronoi app.
See this visualization first on the Voronoi app.
Where Does One U.S. Tax Dollar Go?
This was originally posted on our Voronoi app. Download the app for free on Apple or Android and discover incredible data-driven charts from a variety of trusted sources.
Come tax season, a common refrain is: “what do my taxes even pay for?”
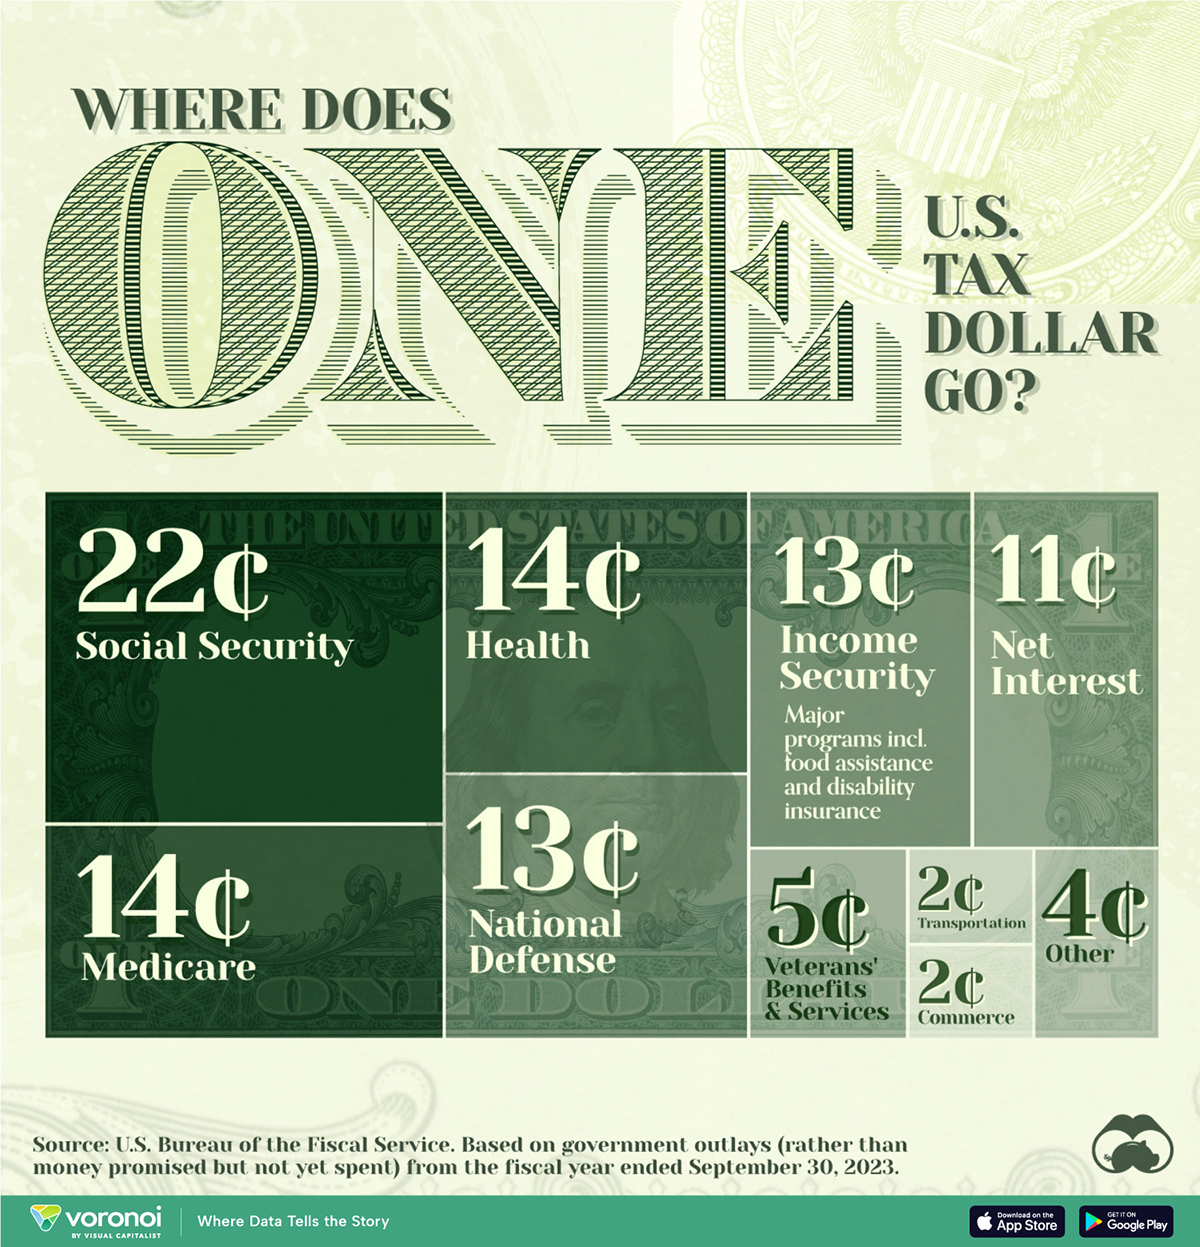
To answer that question, we visualized U.S. federal government spending by function, referencing expenditure to a single federal tax dollar.
Data is for the fiscal year ending September 30, 2023 from the U.S. Bureau of the Fiscal Service. Total spending amounts are converted to cents on the dollar and percentages, to show where one tax dollar goes.
Major Areas of U.S. Government Spending
Social security is the government’s single largest expense and where 22% of tax dollars go. Signed into law in 1935, the program was to insure against the “hazards and vicissitudes of life.” In practice, it meant the creation of a work-related contributory system in which workers secure their own retirement by taxes paid while employed.
However, an aging population threatens its sustainability because as more people retire and draw benefits, there are fewer active workers contributing to the system.
| Government Spending | Amount Paid Out of $1 Tax Dollar |
|---|---|
| 🏛️ Social Security | $0.22 |
| 🏥 Health | $0.14 |
| 🚑 Medicare | $0.14 |
| ⚔️ National Defense | $0.13 |
| 💰 Income Security | $0.13 |
| 📈 Net Interest | $0.11 |
| 🎖️ Veterans' Benefits & Services | $0.05 |
| 🚗 Transportation | $0.02 |
| 🛒 Commerce | $0.02 |
| 🔍 Other | $0.04 |
Health and Medicare together amount to 28% of government spending. The largest health expense is grants to states for Medicaid, which helps cover medical costs for people with lower incomes. Medicare, on the other hand, is federal health insurance for people 65 and older, as well as younger people with disabilities.
National Defense accounts for 13% of government spending. This includes paying military personnel, operating and maintenance costs like fuel, buying aircraft and ships, and research and development. While fourth in terms of percentage spending, this still contributes to the largest military budget in the world—by quite a margin.
Meanwhile, Income Security (also at 13%) covers programs like unemployment compensation, nutrition assistance, and housing assistance. It also has additional retirement and disability benefits not covered by social security.
Just behind—and still well-ahead of all other government spending—is Interest Payments on government debt, coming in at about 11% of tax supported expenditure.


Wealth
Charted: What Frustrates Americans About the Tax System
A survey during peak tax filing season reveals two big complaints that Americans have with the federal tax system.
What Frustrates Americans About the Tax System
This was originally posted on our Voronoi app. Download the app for free on Apple or Android and discover incredible data-driven charts from a variety of trusted sources.
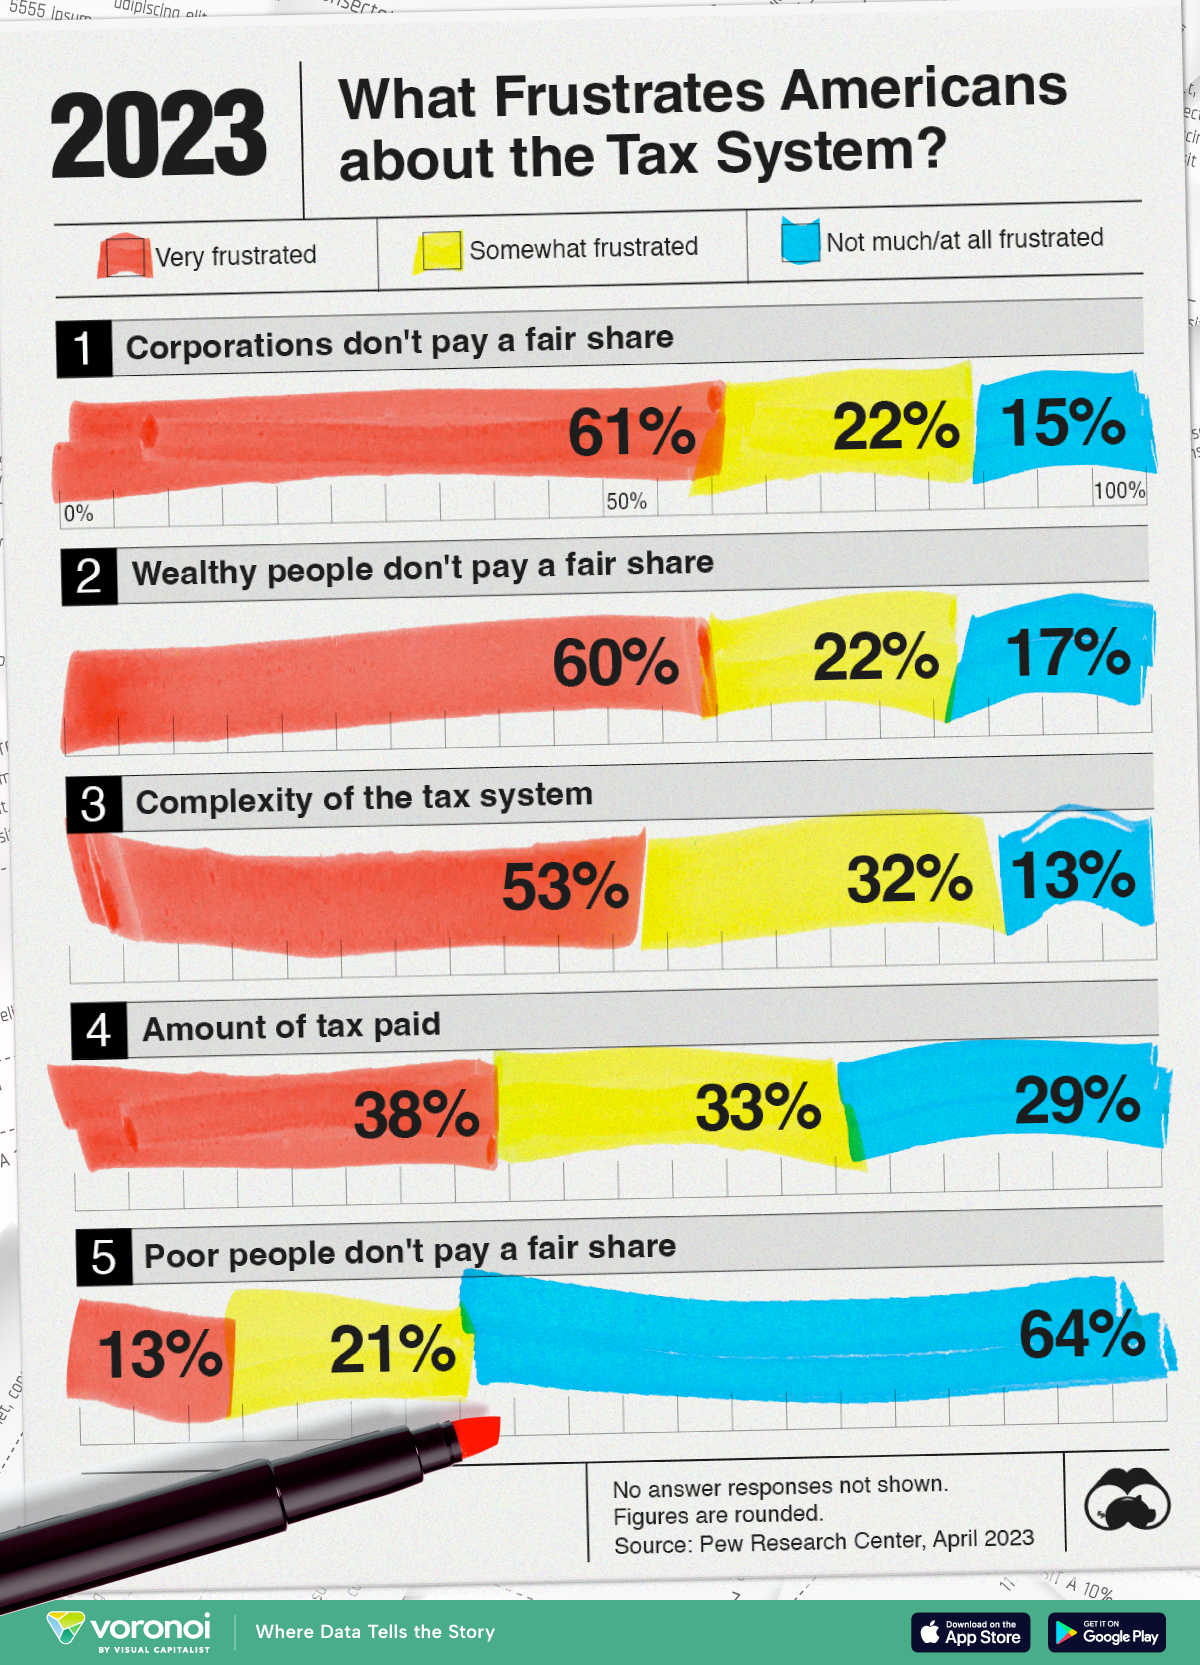
In this visualization, we show Pew Research’s findings on what bothers Americans the most about the tax system.
This data was collected after surveying more than 5,000 American adults between the period of March 27-April 2, 2023.
The survey was weighted to be representative of the U.S. adult population. Visit Pew Research’s methodology page for more details.
Americans Want More Taxes for Some
Six in every 10 Americans feel that both corporations and the wealthy don’t pay their fair share in federal taxes.
Their sentiments are not entirely unfounded.
| Very frustrated | Somewhat frustrated | Not much/ at all frustrated |
|
|---|---|---|---|
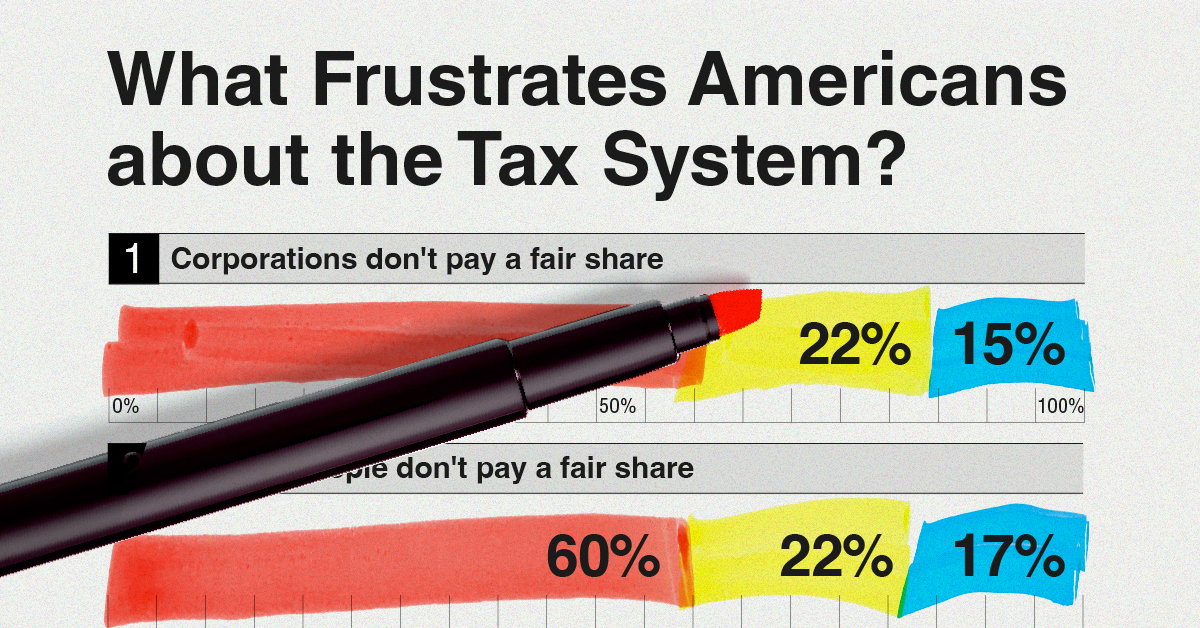
| 🏦 Corporations don't pay a fair share | 61% | 22% | 15% |
| 💼 Wealthy people don't pay a fair share | 60% | 22% | 17% |
| 🤔 Complexity of the tax system | 53% | 32% | 13% |
| 💸 Amount of tax paid | 38% | 33% | 29% |
| 🧑🤝🧑 Poor people don't pay a fair share | 13% | 21% | 64% |
Note: No answer responses are not shown, thus percentages may not sum to 100.
A 2021 ProPublica investigation found some of the wealthiest Americans—also the wealthiest people in the world—did not pay a single penny in federal income taxes in some years.
A significant part of why this is possible is how taxes are collected depending on the source. Since much of the top 1% grow their wealth in equity and property, they are not subject to taxes until they make an actual transaction.
As this Brookings Institution article explains: most Americans make money through their wages, and wages are subject to heavier taxation than capital income. Thus, the tax share of America’s highest-income households is often lower than America’s middle-income households.
Finally, Pew Research noted that their findings were essentially unchanged since 2021.

-

 Markets6 days ago
Visualized: Interest Rate Forecasts for Advanced Economies
-

 Markets2 weeks ago
Economic Growth Forecasts for G7 and BRICS Countries in 2024
-

 Wealth2 weeks ago
Charted: Which City Has the Most Billionaires in 2024?
-

 Technology2 weeks ago
All of the Grants Given by the U.S. CHIPS Act
-

 Green2 weeks ago
The Carbon Footprint of Major Travel Methods
-

 United States1 week ago
Visualizing the Most Common Pets in the U.S.
-

 Culture1 week ago
The World’s Top Media Franchises by All-Time Revenue
-

 voronoi1 week ago
Best Visualizations of April on the Voronoi App