Markets
Visualized: Real Interest Rates by Country
![]() Subscribe to the Elements free mailing list for more like this
Subscribe to the Elements free mailing list for more like this
Visualized: Real Interest Rates of Major World Economies
This was originally posted on Elements. Sign up to the free mailing list to get beautiful visualizations on real assets and resource megatrends each week.
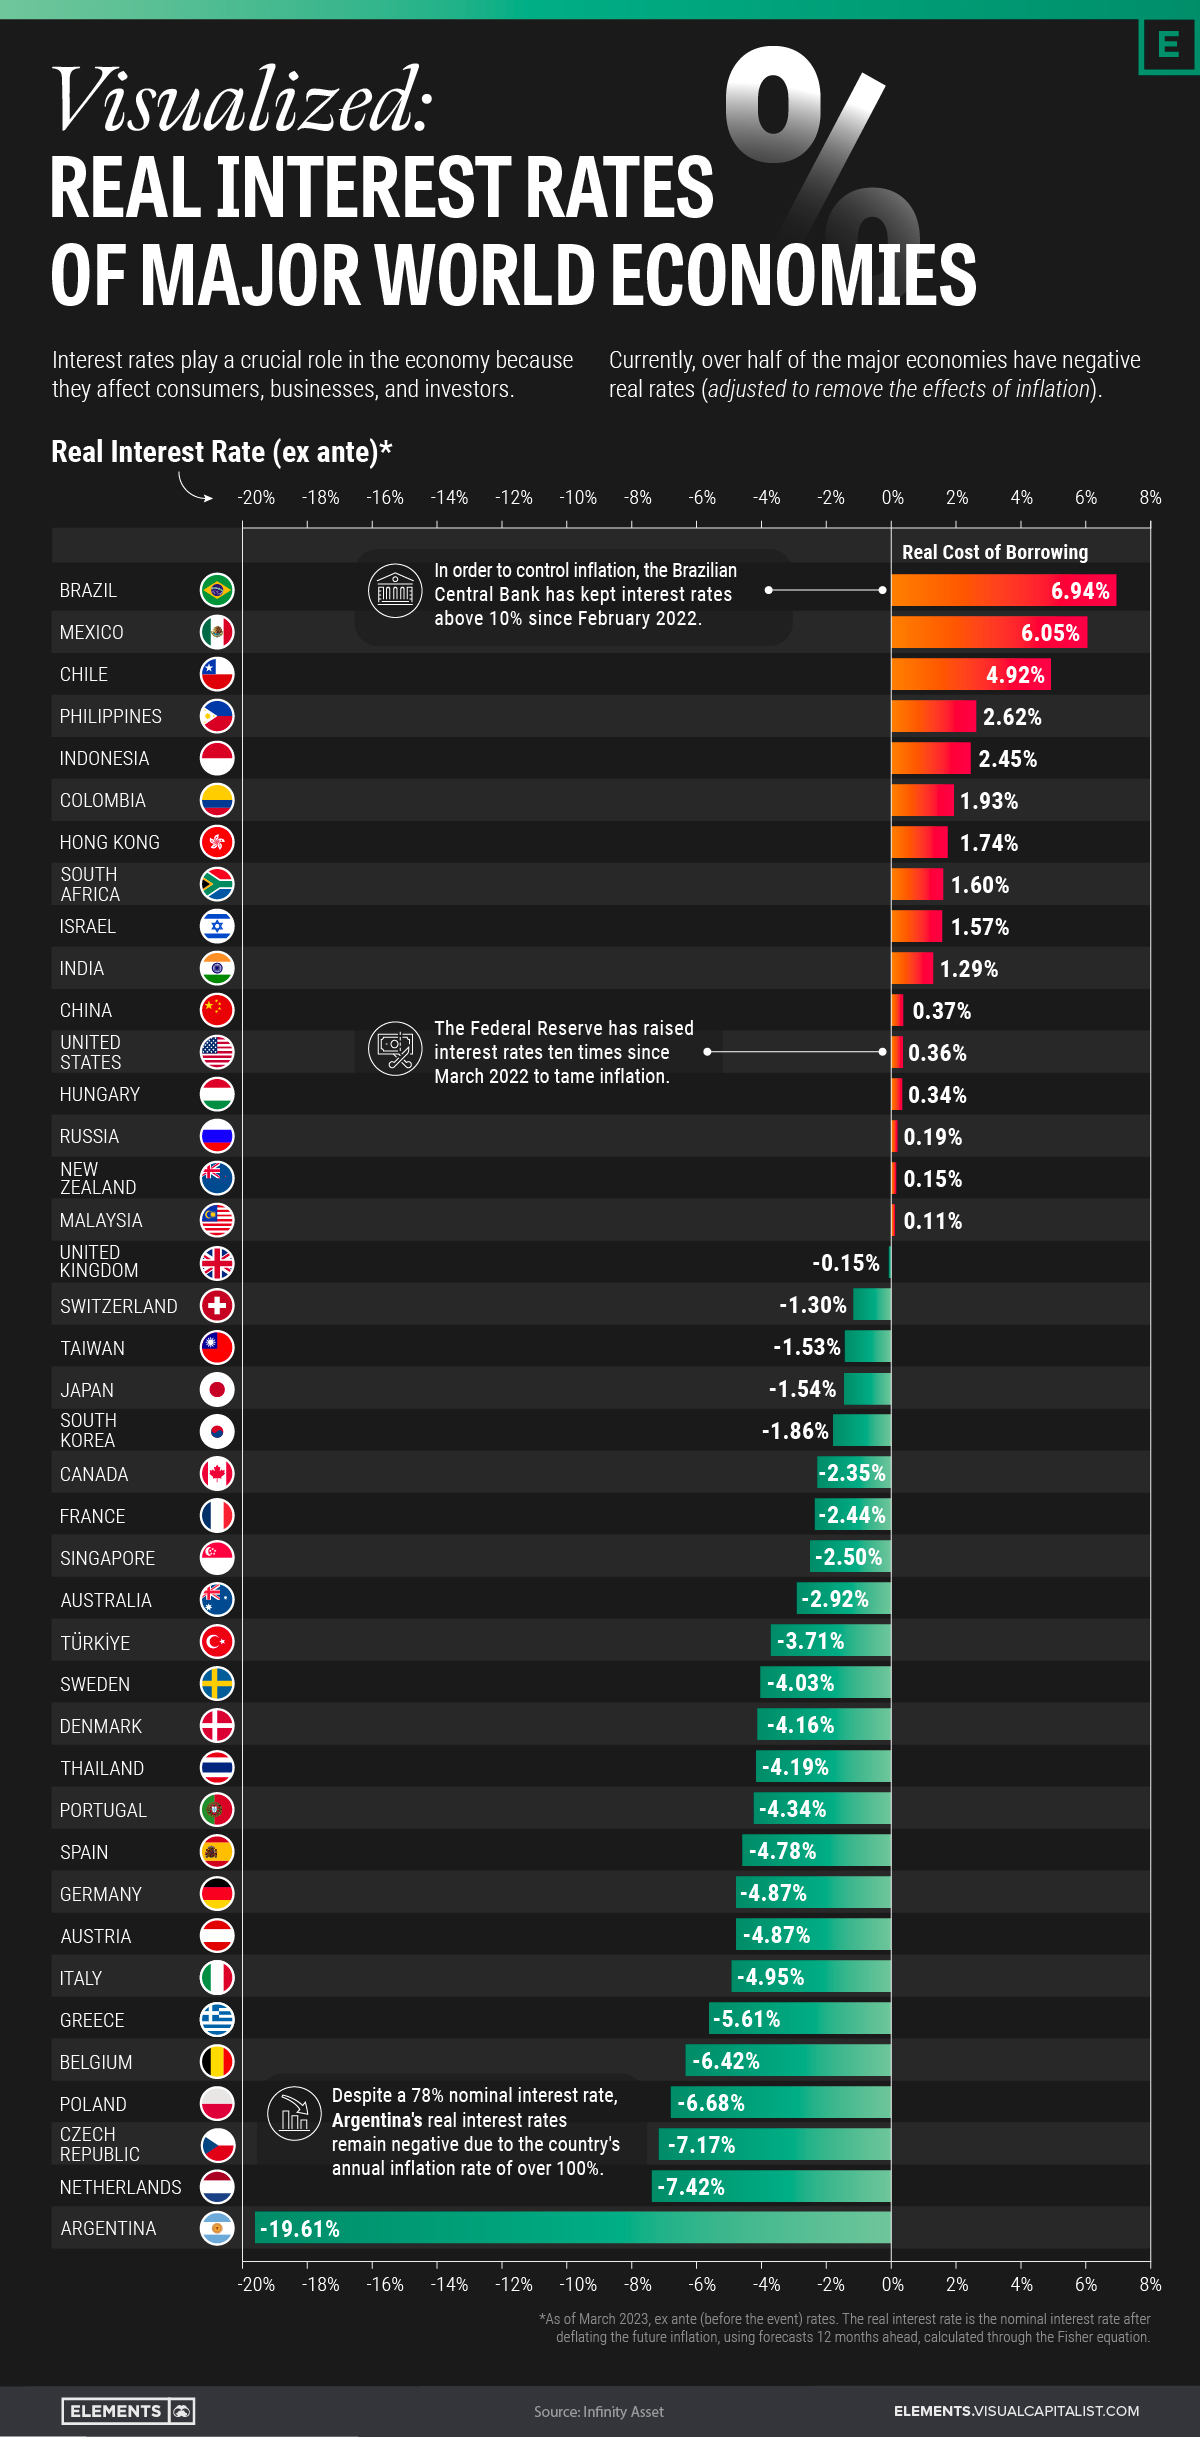
Interest rates play a crucial role in the economy because they affect consumers, businesses, and investors alike.
They can have significant implications for people’s ability to access credit, manage debts, and buy more expensive goods such as cars and houses.
This graphic uses data from Infinity Asset Management to visualize the real interest rates (ex ante) of 40 major world economies, by subtracting projected inflation over the next 12 months from current nominal rates.
Nominal Interest Rates vs. Real Interest Rates
Nominal interest rates refer to the rate at which money can be borrowed or lent at face value, without considering any other factors like inflation.
Meanwhile, the real interest rate is the nominal interest rate after taking into account inflation, reflecting the true cost of borrowing or lending. Real interest rates can fluctuate over time and are influenced by various factors such as inflation, central bank policies, and economic growth. They can also influence economic growth by affecting investment and consumption decisions.
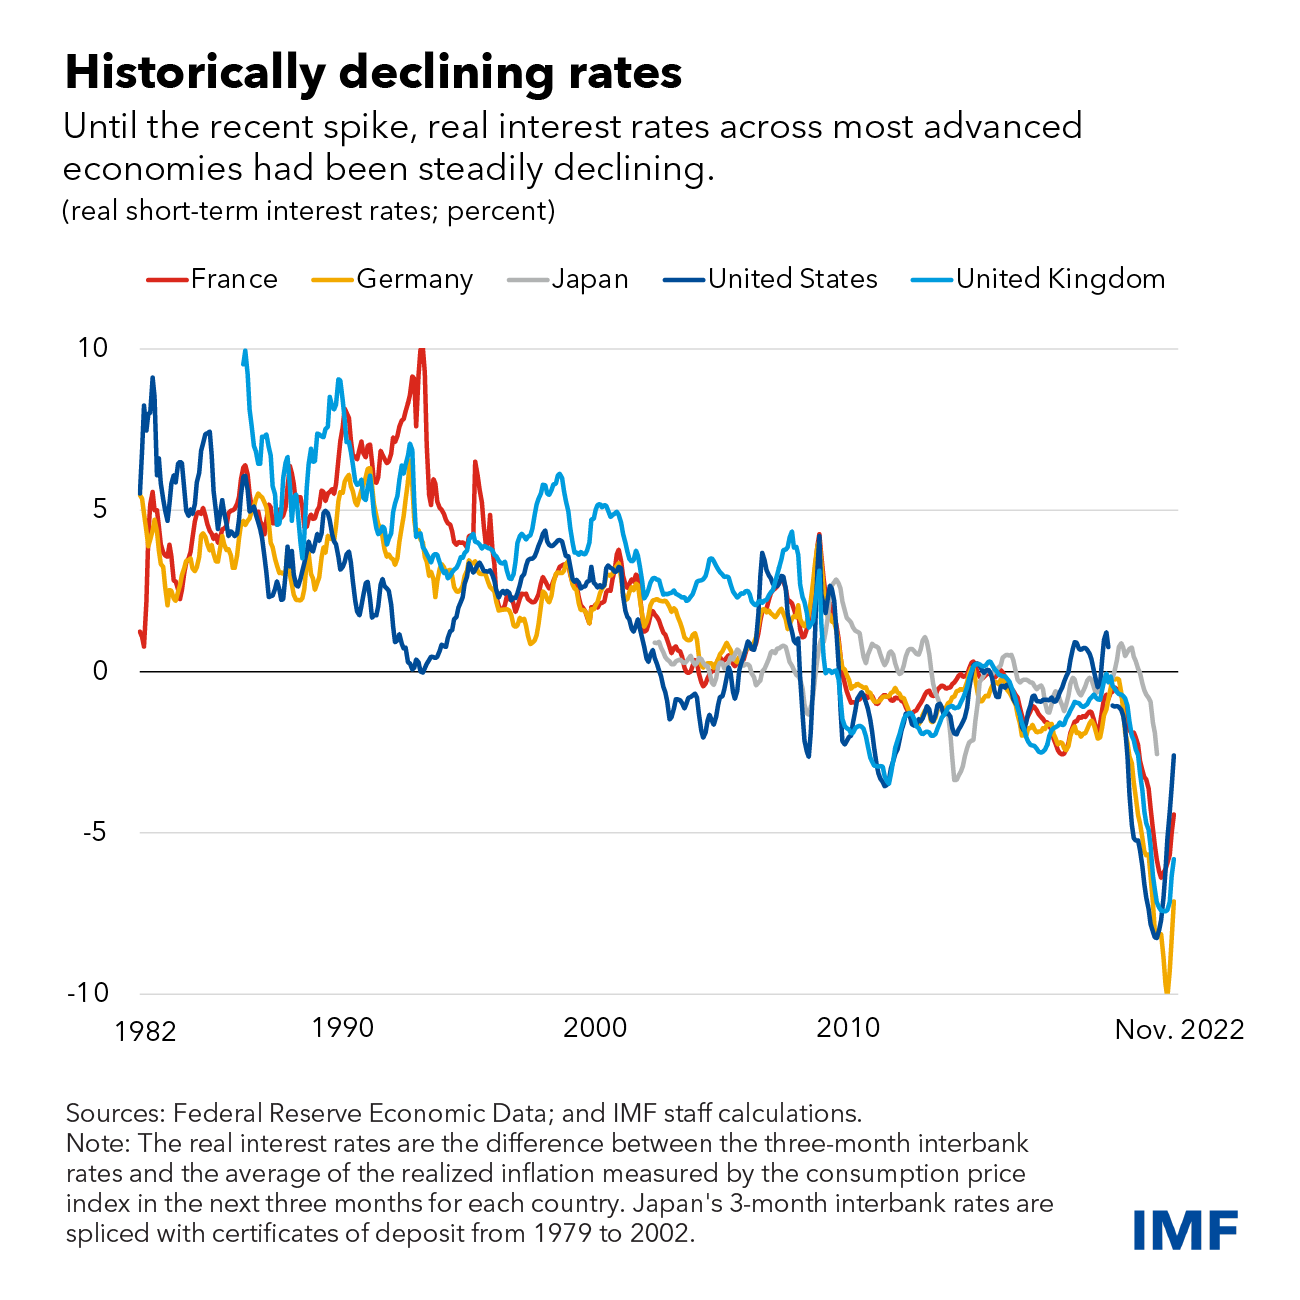
According to the International Monetary Fund (IMF), since the mid-1980s, real interest rates across several advanced economies have declined steadily.
As of March 2023, Brazil has the highest real interest rate among the 40 major economies shown in this dataset.
Below we look at Brazil’s situation, along with the data of the four other major economies with the highest real rates in the dataset:
| Nominal Interest Rate | Real Interest Rate | |
|---|---|---|
| 🇧🇷 Brazil | 13.75% | 6.94% |
| 🇲🇽 Mexico | 11.00% | 6.05% |
| 🇨🇱 Chile | 11.25% | 4.92% |
| 🇵🇭 Philippines | 6.00% | 2.62% |
| 🇮🇩 Indonesia | 5.75% | 2.45% |
In general, countries with high interest rates offer investors higher yields on their investments but also come with higher risks due to volatile economies and political instability.
Below are the five countries in the dataset with the lowest real rates:
| Nominal Interest Rate | Real Interest Rate | |
|---|---|---|
| 🇦🇷 Argentina | 78.00% | -19.61% |
| 🇳🇱 Netherlands | 3.50% | -7.42% |
| 🇨🇿 Czech Republic | 7.00% | -7.17% |
| 🇵🇱 Poland | 6.75% | -6.68% |
| 🇧🇪 Belgium | 3.50% | -6.42% |
Hyperinflation, as seen in Argentina, can lead to anomalies in both real and nominal rates, causing problems for the country’s broader economy and financial system.
As you can see above, with a 78% nominal interest rate, Argentina’s real interest rates remain the lowest on the planet due to a staggering annual inflation rate of over 100%.
Interest Rate Outlook
Increasing inflation and tighter monetary policy have resulted in rapid increases in nominal interest rates recently in many countries.
However, IMF analysis suggests that recent increases could be temporary.
Central banks in advanced economies are likely to ease monetary policy and bring interest rates back to pre-pandemic levels when inflation is brought under control, according to the fund.


Markets
Mapped: Europe’s GDP Per Capita, by Country
Which European economies are richest on a GDP per capita basis? This map shows the results for 44 countries across the continent.


Mapped: Europe’s GDP Per Capita, by Country (2024)
This was originally posted on our Voronoi app. Download the app for free on iOS or Android and discover incredible data-driven charts from a variety of trusted sources.
Europe is home to some of the largest and most sophisticated economies in the world. But how do countries in the region compare with each other on a per capita productivity basis?
In this map, we show Europe’s GDP per capita levels across 44 nations in current U.S. dollars. Data for this visualization and article is sourced from the International Monetary Fund (IMF) via their DataMapper tool, updated April 2024.
Europe’s Richest and Poorest Nations, By GDP Per Capita
Luxembourg, Ireland, and Switzerland, lead the list of Europe’s richest nations by GDP per capita, all above $100,000.
| Rank | Country | GDP Per Capita (2024) |
|---|---|---|
| 1 | 🇱🇺 Luxembourg | $131,380 |
| 2 | 🇮🇪 Ireland | $106,060 |
| 3 | 🇨🇭 Switzerland | $105,670 |
| 4 | 🇳🇴 Norway | $94,660 |
| 5 | 🇮🇸 Iceland | $84,590 |
| 6 | 🇩🇰 Denmark | $68,900 |
| 7 | 🇳🇱 Netherlands | $63,750 |
| 8 | 🇸🇲 San Marino | $59,410 |
| 9 | 🇦🇹 Austria | $59,230 |
| 10 | 🇸🇪 Sweden | $58,530 |
| 11 | 🇧🇪 Belgium | $55,540 |
| 12 | 🇫🇮 Finland | $55,130 |
| 13 | 🇩🇪 Germany | $54,290 |
| 14 | 🇬🇧 UK | $51,070 |
| 15 | 🇫🇷 France | $47,360 |
| 16 | 🇦🇩 Andorra | $44,900 |
| 17 | 🇲🇹 Malta | $41,740 |
| 18 | 🇮🇹 Italy | $39,580 |
| 19 | 🇨🇾 Cyprus | $37,150 |
| 20 | 🇪🇸 Spain | $34,050 |
| 21 | 🇸🇮 Slovenia | $34,030 |
| 22 | 🇪🇪 Estonia | $31,850 |
| 23 | 🇨🇿 Czech Republic | $29,800 |
| 24 | 🇵🇹 Portugal | $28,970 |
| 25 | 🇱🇹 Lithuania | $28,410 |
| 26 | 🇸🇰 Slovakia | $25,930 |
| 27 | 🇱🇻 Latvia | $24,190 |
| 28 | 🇬🇷 Greece | $23,970 |
| 29 | 🇭🇺 Hungary | $23,320 |
| 30 | 🇵🇱 Poland | $23,010 |
| 31 | 🇭🇷 Croatia | $22,970 |
| 32 | 🇷🇴 Romania | $19,530 |
| 33 | 🇧🇬 Bulgaria | $16,940 |
| 34 | 🇷🇺 Russia | $14,390 |
| 35 | 🇹🇷 Türkiye | $12,760 |
| 36 | 🇲🇪 Montenegro | $12,650 |
| 37 | 🇷🇸 Serbia | $12,380 |
| 38 | 🇦🇱 Albania | $8,920 |
| 39 | 🇧🇦 Bosnia & Herzegovina | $8,420 |
| 40 | 🇲🇰 North Macedonia | $7,690 |
| 41 | 🇧🇾 Belarus | $7,560 |
| 42 | 🇲🇩 Moldova | $7,490 |
| 43 | 🇽🇰 Kosovo | $6,390 |
| 44 | 🇺🇦 Ukraine | $5,660 |
| N/A | 🇪🇺 EU Average | $44,200 |
Note: Figures are rounded.
Three Nordic countries (Norway, Iceland, Denmark) also place highly, between $70,000-90,000. Other Nordic peers, Sweden and Finland rank just outside the top 10, between $55,000-60,000.
Meanwhile, Europe’s biggest economies in absolute terms, Germany, UK, and France, rank closer to the middle of the top 20, with GDP per capitas around $50,000.
Finally, at the end of the scale, Eastern Europe as a whole tends to have much lower per capita GDPs. In that group, Ukraine ranks last, at $5,660.
A Closer Look at Ukraine
For a broader comparison, Ukraine’s per capita GDP is similar to Iran ($5,310), El Salvador ($5,540), and Guatemala ($5,680).
According to experts, Ukraine’s economy has historically underperformed to expectations. After the fall of the Berlin Wall, the economy contracted for five straight years. Its transition to a Western, liberalized economic structure was overshadowed by widespread corruption, a limited taxpool, and few revenue sources.
Politically, its transformation from authoritarian regime to civil democracy has proved difficult, especially when it comes to institution building.
Finally, after the 2022 invasion of the country, Ukraine’s GDP contracted by 30% in a single year—the largest loss since independence. Large scale emigration—to the tune of six million refugees—is also playing a role.
Despite these challenges, the country’s economic growth has somewhat stabilized while fighting continues.

-

 Politics5 days ago
Charted: What Southeast Asia Thinks About China & the U.S.
-

 Misc2 weeks ago
Visualizing the Most Common Pets in the U.S.
-

 Culture2 weeks ago
The World’s Top Media Franchises by All-Time Revenue
-

 Best of2 weeks ago
Best Visualizations of April on the Voronoi App
-

 Wealth1 week ago
Charted: Which Country Has the Most Billionaires in 2024?
-

 Markets1 week ago
The Top Private Equity Firms by Country
-

 Markets1 week ago
The Best U.S. Companies to Work for According to LinkedIn
-

 Economy1 week ago
Ranked: The Top 20 Countries in Debt to China