Technology
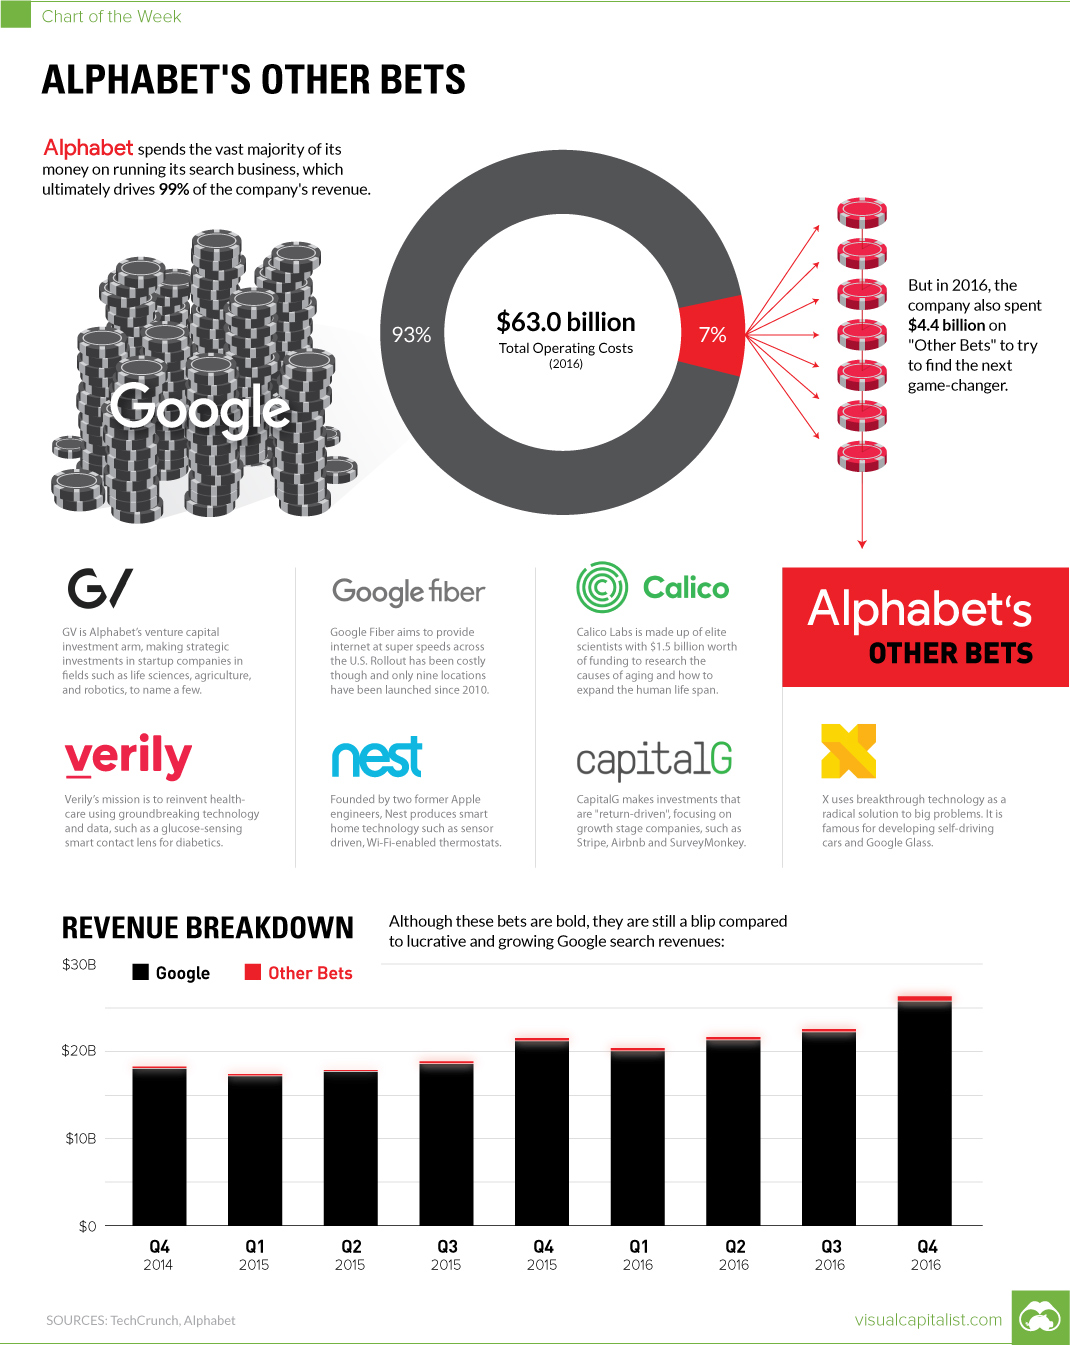
Chart: Vetting Alphabet’s $4 Billion in “Other Bets”
The Chart of the Week is a weekly Visual Capitalist feature on Fridays.
Regardless of whether the policy remains in place today, one of Google’s most famous management philosophies has been the “20% rule”. Legend goes that especially in Google’s earlier days, employees were encouraged to spend 20% of their time working on new initiatives that could potentially benefit Google outside of their regular workflows, teams, and projects. This meant there was time to explore new ideas or to challenge existing status quos within the organization.
It’s a seemingly arbitrary and systematic way to spur innovation, but it has worked well over the years. The 20% rule has apparently led to new products such as Gmail, Google News, and AdSense, which are all important aspects of Google’s business today.
It should not be surprising then, that Google’s parent company Alphabet also takes a systematic approach to innovating outside of its core search business. By making ambitious “Other Bets” and keeping investors up-to-date with their own segment on the company’s financial statements, Alphabet shows both commitment and discipline in finding its next multi-billion dollar game-changer.
“Other Bets”
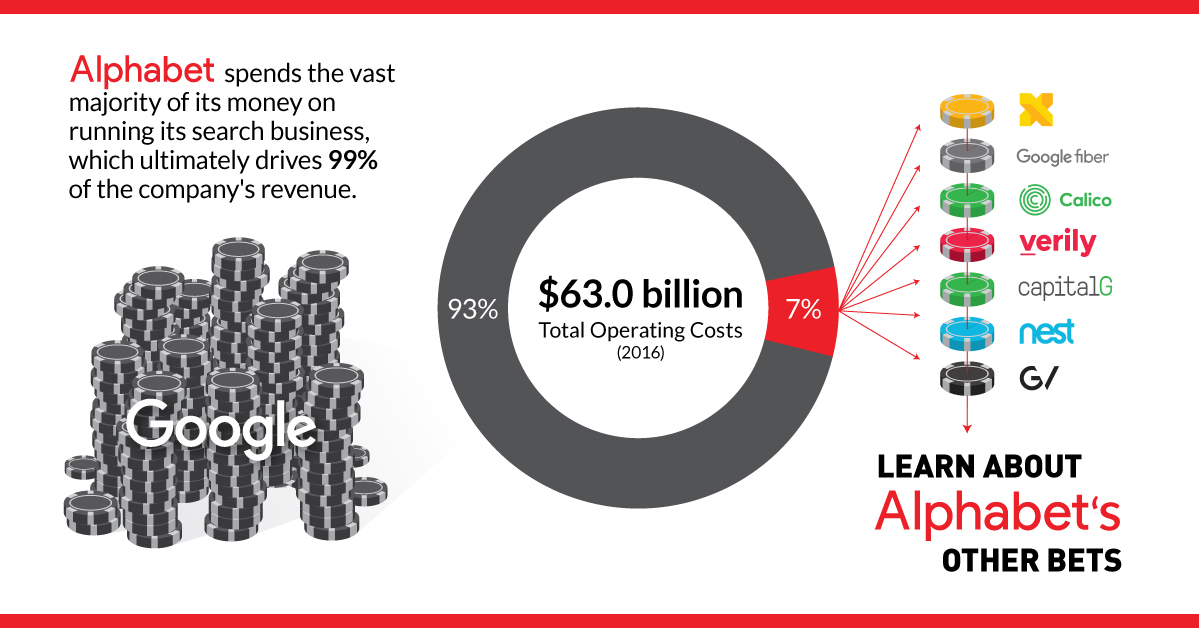
In 2016, Alphabet was a cash machine. The company raked in $19.5 billion of profit off of a whopping $87.4 billion of revenue.
The only challenge? If you do the math, 99% of that revenue comes from Google, which currently dominates digital advertising with a 41% share of the entire market.
Wisely, the company does not want to put all of its eggs in one basket – and it spends about 7% of its annual operating costs on facilitating “Other Bets”. Here is what else Alphabet is up to:
Google Fiber
Google Fiber aims to provide internet at super speeds across the United States. Rollout has been costly though and only nine locations have been launched since 2010.
Calico Labs
Calico Labs is made up of elite scientists with $1.5 billion worth of funding to research the causes of aging and how to expand the human life span.
Nest
Founded by two former Apple engineers, Nest produces smart-home technology such as sensor-driven, Wi-Fi-enabled thermostats.
Verily
Verily’s mission is to reinvent healthcare using groundbreaking technology and data, such as a glucose-sensing smart contact lens for diabetics.
GV
GV, formerly known as Google Ventures, is Alphabet’s venture capital investment arm, making strategic investments in startup companies in fields such as life sciences, agriculture, and robotics, to name a few.
CapitalG
CapitalG makes investments that are “return-driven”, focusing on growth stage companies, such as Stripe, Airbnb and SurveyMonkey.
X
X uses breakthrough technology as a radical solution to big problems. Its most famous projects are its self-driving car and Google Glass.
Which “Other Bets” are Paying Off?
“Other Bets” generated $809 million in revenue in 2016, which is a 82% increase over 2015. This revenue came mostly from Nest, Fiber, and Verily.
Nest, which aims to dominate the smart home of tomorrow, was acquired for $3.2 billion in 2014. And while it does generate revenue for Alphabet, it has been viewed mostly as a disappointment even from the company’s perspective.
Verily is Alphabet’s business in life sciences, and is apparently profitable already. The unit partners with pharmaceutical companies to make money, and it will also eventually move forward with human clinical trials on its smart contact lens product.
Lastly, Fiber has been rolled out in nine cities across the United States to provide ultra-fast broadband speeds for internet and television. In recent news, Fiber has laid off employees, while halting many further expansion plans.
Technology
Every Mission to Mars in One Visualization
This graphic shows a timeline of every mission to Mars since 1960, highlighting which ones have been successful and which ones haven’t.

Timeline: A Historical Look at Every Mission to Mars
Within our Solar System, Mars is one of the most similar planets to Earth—both have rocky landscapes, solid outer crusts, and cores made of molten rock.
Because of its similarities to Earth and proximity, humanity has been fascinated by Mars for centuries. In fact, it’s one of the most explored objects in our Solar System.
But just how many missions to Mars have we embarked on, and which of these journeys have been successful? This graphic by Jonathan Letourneau shows a timeline of every mission to Mars since 1960 using NASA’s historical data.
A Timeline of Mars Explorations
According to a historical log from NASA, there have been 48 missions to Mars over the last 60 years. Here’s a breakdown of each mission, and whether or not they were successful:
# | Launch | Name | Country | Result |
---|---|---|---|---|
1 | 1960 | Korabl 4 | USSR (flyby) | Failure |
2 | 1960 | Korabl 5 | USSR (flyby) | Failure |
3 | 1962 | Korabl 11 | USSR (flyby) | Failure |
4 | 1962 | Mars 1 | USSR (flyby) | Failure |
5 | 1962 | Korabl 13 | USSR (flyby) | Failure |
6 | 1964 | Mariner 3 | US (flyby) | Failure |
7 | 1964 | Mariner 4 | US (flyby) | Success |
8 | 1964 | Zond 2 | USSR (flyby) | Failure |
9 | 1969 | Mars 1969A | USSR | Failure |
10 | 1969 | Mars 1969B | USSR | Failure |
11 | 1969 | Mariner 6 | US (flyby) | Success |
12 | 1969 | Mariner 7 | US (flyby) | Success |
13 | 1971 | Mariner 8 | US | Failure |
14 | 1971 | Kosmos 419 | USSR | Failure |
15 | 1971 | Mars 2 Orbiter/Lander | USSR | Failure |
16 | 1971 | Mars 3 Orbiter/Lander | USSR | Success/Failure |
17 | 1971 | Mariner 9 | US | Success |
18 | 1973 | Mars 4 | USSR | Failure |
19 | 1973 | Mars 5 | USSR | Success |
20 | 1973 | Mars 6 Orbiter/Lander | USSR | Success/Failure |
21 | 1973 | Mars 7 Lander | USSR | Failure |
22 | 1975 | Viking 1 Orbiter/Lander | US | Success |
23 | 1975 | Viking 2 Orbiter/Lander | US | Success |
24 | 1988 | Phobos 1 Orbiter | USSR | Failure |
25 | 1988 | Phobos 2 Orbiter/Lander | USSR | Failure |
26 | 1992 | Mars Observer | US | Failure |
27 | 1996 | Mars Global Surveyor | US | Success |
28 | 1996 | Mars 96 | Russia | Failure |
29 | 1996 | Mars Pathfinder | US | Success |
30 | 1998 | Nozomi | Japan | Failure |
31 | 1998 | Mars Climate Orbiter | US | Failure |
32 | 1999 | Mars Polar Lander | US | Failure |
33 | 1999 | Deep Space 2 Probes (2) | US | Failure |
34 | 2001 | Mars Odyssey | US | Success |
35 | 2003 | Mars Express Orbiter/Beagle 2 Lander | ESA | Success/Failure |
36 | 2003 | Mars Exploration Rover - Spirit | US | Success |
37 | 2003 | Mars Exploration Rover - Opportunity | US | Success |
38 | 2005 | Mars Reconnaissance Orbiter | US | Success |
39 | 2007 | Phoenix Mars Lander | US | Success |
40 | 2011 | Mars Science Laboratory | US | Success |
41 | 2011 | Phobos-Grunt/Yinghuo-1 | Russia/China | Failure |
42 | 2013 | Mars Atmosphere and Volatile Evolution | US | Success |
43 | 2013 | Mars Orbiter Mission (MOM) | India | Success |
44 | 2016 | ExoMars Orbiter/Schiaparelli EDL Demo Lander | ESA/Russia | Success/Failure |
45 | 2018 | Mars InSight Lander | US | Success |
46 | 2020 | Hope Orbiter | UAE | Success |
47 | 2020 | Tianwen-1 Orbiter/Zhurong Rover | China | Success |
48 | 2020 | Mars 2020 Perseverance Rover | US | Success |
The first mission to Mars was attempted by the Soviets in 1960, with the launch of Korabl 4, also known as Mars 1960A.
As the table above shows, the voyage was unsuccessful. The spacecraft made it 120 km into the air, but its third-stage pumps didn’t generate enough momentum for it to stay in Earth’s orbit.
For the next few years, several more unsuccessful Mars missions were attempted by the USSR and then NASA. Then, in 1964, history was made when NASA launched the Mariner 4 and completed the first-ever successful trip to Mars.
The Mariner 4 didn’t actually land on the planet, but the spacecraft flew by Mars and was able to capture photos, which gave us an up-close glimpse at the planet’s rocky surface.
Then on July 20, 1976, NASA made history again when its spacecraft called Viking 1 touched down on Mars’ surface, making it the first space agency to complete a successful Mars landing. Viking 1 captured panoramic images of the planet’s terrain, and also enabled scientists to monitor the planet’s weather.
Vacation to Mars, Anyone?
To date, all Mars landings have been done without crews, but NASA is planning to send humans to Mars by the late 2030s.
And it’s not just government agencies that are planning missions to Mars—a number of private companies are getting involved, too. Elon Musk’s aerospace company SpaceX has a long-term plan to build an entire city on Mars.
Two other aerospace startups, Impulse and Relativity, also announced an unmanned joint mission to Mars in July 2022, with hopes it could be ready as soon as 2024.
As more players are added to the mix, the pressure is on to be the first company or agency to truly make it to Mars. If (or when) we reach that point, what’s next is anyone’s guess.
Technology
Thematic Investing: 3 Key Trends in Cybersecurity
Cyberattacks are becoming more frequent and sophisticated. Here’s what investors need to know about the future of cybersecurity.


Thematic Investing: 3 Key Trends in Cybersecurity
In 2020, the global cost of cybercrime was estimated to be around $945 billion, according to McAfee.
It’s likely even higher today, as multiple sources have recorded an increase in the frequency and sophistication of cyberattacks during the pandemic.
In this infographic from Global X ETFs, we highlight three major trends that are shaping the future of the cybersecurity industry that investors need to know.
Trend 1: Increasing Costs
Research from IBM determined that the average data breach cost businesses $4.2 million in 2021, up from $3.6 million in 2017. The following table breaks this figure into four components:
Cost Component | Value ($) |
---|---|
Cost of lost business | $1.6M |
Detection and escalation | $1.2M |
Post breach response | $1.1M |
Notification | $0.3M |
Total | $4.2M |
The greatest cost of a data breach is lost business, which results from system downtimes, reputational losses, and lost customers. Second is detection and escalation, including investigative activities, audit services, and communications to stakeholders.
Post breach response includes costs such as legal expenditures, issuing new accounts or credit cards (in the case of financial institutions), and other monitoring services. Lastly, notification refers to the cost of notifying regulators, stakeholders, and other third parties.
To stay ahead of these rising costs, businesses are placing more emphasis on cybersecurity. For example, Microsoft announced in September 2021 that it would quadruple its cybersecurity investments to $20 billion over the next five years.
Trend 2: Remote Work Opens New Vulnerabilities
According to IBM, companies that rely more on remote work experience greater losses from data breaches. For companies where 81 to 100% of employees were remote, the average cost of a data breach was $5.5 million (2021). This dropped to $3.7 million for companies that had under 10% of employees working from home.
A major reason for this gap is that work-from-home setups are typically less secure. Phishing attacks surged in 2021, taking advantage of the fact that many employees access corporate systems through their personal devices.
Type of Attack | Number of attacks in 2020 | Number of attacks in 2021 | Growth (%) |
---|---|---|---|
Spam phishing | 1.5M | 10.1M | +573% |
Credential phishing | 5.5M | 6.2M | +13% |
As detected by Trend Micro’s Cloud App Security.
Spam phishing refers to “fake” emails that trick users by impersonating company management. They can include malicious links that download ransomware onto the users device. Credential phishing is similar in concept, though the goal is to steal a person’s account credentials.
A tactic you may have seen before is the Amazon scam, where senders impersonate Amazon and convince users to update their payment methods. This strategy could also be used to gain access to a company’s internal systems.
Trend 3: AI Can Reduce the Cost of a Data Breach
AI-based cybersecurity can detect and respond to cyberattacks without any human intervention. When fully deployed, IBM measured a 20% reduction in the time it takes to identify and contain a breach. It also resulted in cost savings upwards of 60%.
A prominent user of AI-based cybersecurity is Google, which uses machine learning to detect phishing attacks within Gmail.
Machine learning helps Gmail block spam and phishing messages from showing up in your inbox with over 99.9% accuracy. This is huge, given that 50-70% of messages that Gmail receives are spam.
– Andy Wen, Google
As cybercrime escalates, Acumen Research and Consulting believes the market for AI-based security solutions will reach $134 billion by 2030, up from $15 billion in 2021.
Introducing the Global X Cybersecurity ETF
The Global X Cybersecurity ETF (Ticker: BUG) seeks to provide investment results that correspond generally to the price and yield performance, before fees and expenses, of the Indxx Cybersecurity Index. See below for industry and country-level breakdowns, as of June 2022.
Sector (By security type) | Weight |
---|---|
Cloud | 28.0% |
Network | 25.1% |
Identity | 17.7% |
Internet | 15.0% |
Endpoint | 12.8% |
Country | Weight |
---|---|
🇺🇸 U.S. | 71.6% |
🇮🇱 Israel | 13.2% |
🇬🇧 UK | 8.2% |
🇯🇵 Japan | 5.5% |
🇰🇷 South Korea | 0.9% |
🇨🇦 Canada | 0.6% |
Totals may not equal 100% due to rounding.
Investors can use this passively managed solution to gain exposure to the rising adoption of cybersecurity technologies.

-
Economy2 hours ago
Visualized: The Value of U.S. Imports of Goods by State
U.S. goods imports were worth $2.8T in 2021. From east coast to west, this visualization breaks down imports on a state-by-state basis
-
Misc9 hours ago
Sharpen Your Thinking with These 10 Powerful Cognitive Razors
Here are 10 razors, or rules of thumb, that help simplify decision-making, inspired by a list curated by the investor and thought leader Sahil Bloom.
-
Misc3 days ago
Brand Loyalty is Declining for Most Luxury Automakers
Brand loyalty has declined for most luxury automakers, but three brands—Tesla, Maserati, and Genesis—appear to have bucked the trend.
-
Demographics4 days ago
Ranked: The Most and Least Livable Cities in 2022
Which cities rank as the best places to live worldwide? This map reveals the world’s most and least livable cities.
-
Markets6 days ago
Visualizing Major Layoffs At U.S. Corporations
This infographic highlights the accelerating pace of layoffs so far in 2022, as businesses cut costs ahead of a potential recession.
-
Energy7 days ago
Visualizing 10 Years of Global EV Sales by Country
Global EV sales have grown exponentially, more than doubling in 2021 to 6.8 million units. Here’s a look at EV sales by country since 2011.
-
Misc2 weeks ago
Visualizing Which Countries Drink the Most Beer
-
Demographics4 weeks ago
Ranked: The 20 Countries With the Fastest Declining Populations
-
Personal Finance2 weeks ago
Mapped: The Salary You Need to Buy a Home in 50 U.S. Cities
-
Energy3 weeks ago
Visualizing the World’s Largest Oil Producers
-
Energy2 weeks ago
Which Countries Produce the Most Natural Gas?
-
Agriculture3 weeks ago
Timeline: The Domestication of Animals
-
Business3 weeks ago
Ranked: The World’s Largest Container Shipping Companies
-
Energy4 weeks ago
Visualized: Battery Vs. Hydrogen Fuel Cell