Technology
What Ideas Are Trending Among Tech’s Biggest Influencers?
Y Combinator, one of best-known Silicon Valley accelerators, has an impressive track record of success. With well-timed investments in Dropbox, Stripe, and Airbnb, the startups in the company’s portfolio are now worth an aggregate of $600 billion in market capitalization.
While Y Combinator has made a clear impact on the tech sector, the company also launched an internal side project in 2007 that would end up becoming highly influential in a different and surprising way.
Its user-powered news aggregator called Hacker News, which is now visited by 20 million people per month, has become a mainstay for entrepreneurs, tech professionals, and venture capitalists around the world. Using a Reddit-like interface, users can upvote and downvote articles that they think have the most relevance to trends and issues affecting the tech sector.
Data Mining For Trends
Today’s charts come to us from Variance Explained, and they help to paint a picture of what topics have been trending on Hacker News over the last 3.5 years.
Using data from over 1 million subject lines, we can see which topics are being mentioned with increasing frequency by the site’s community of technology influencers.
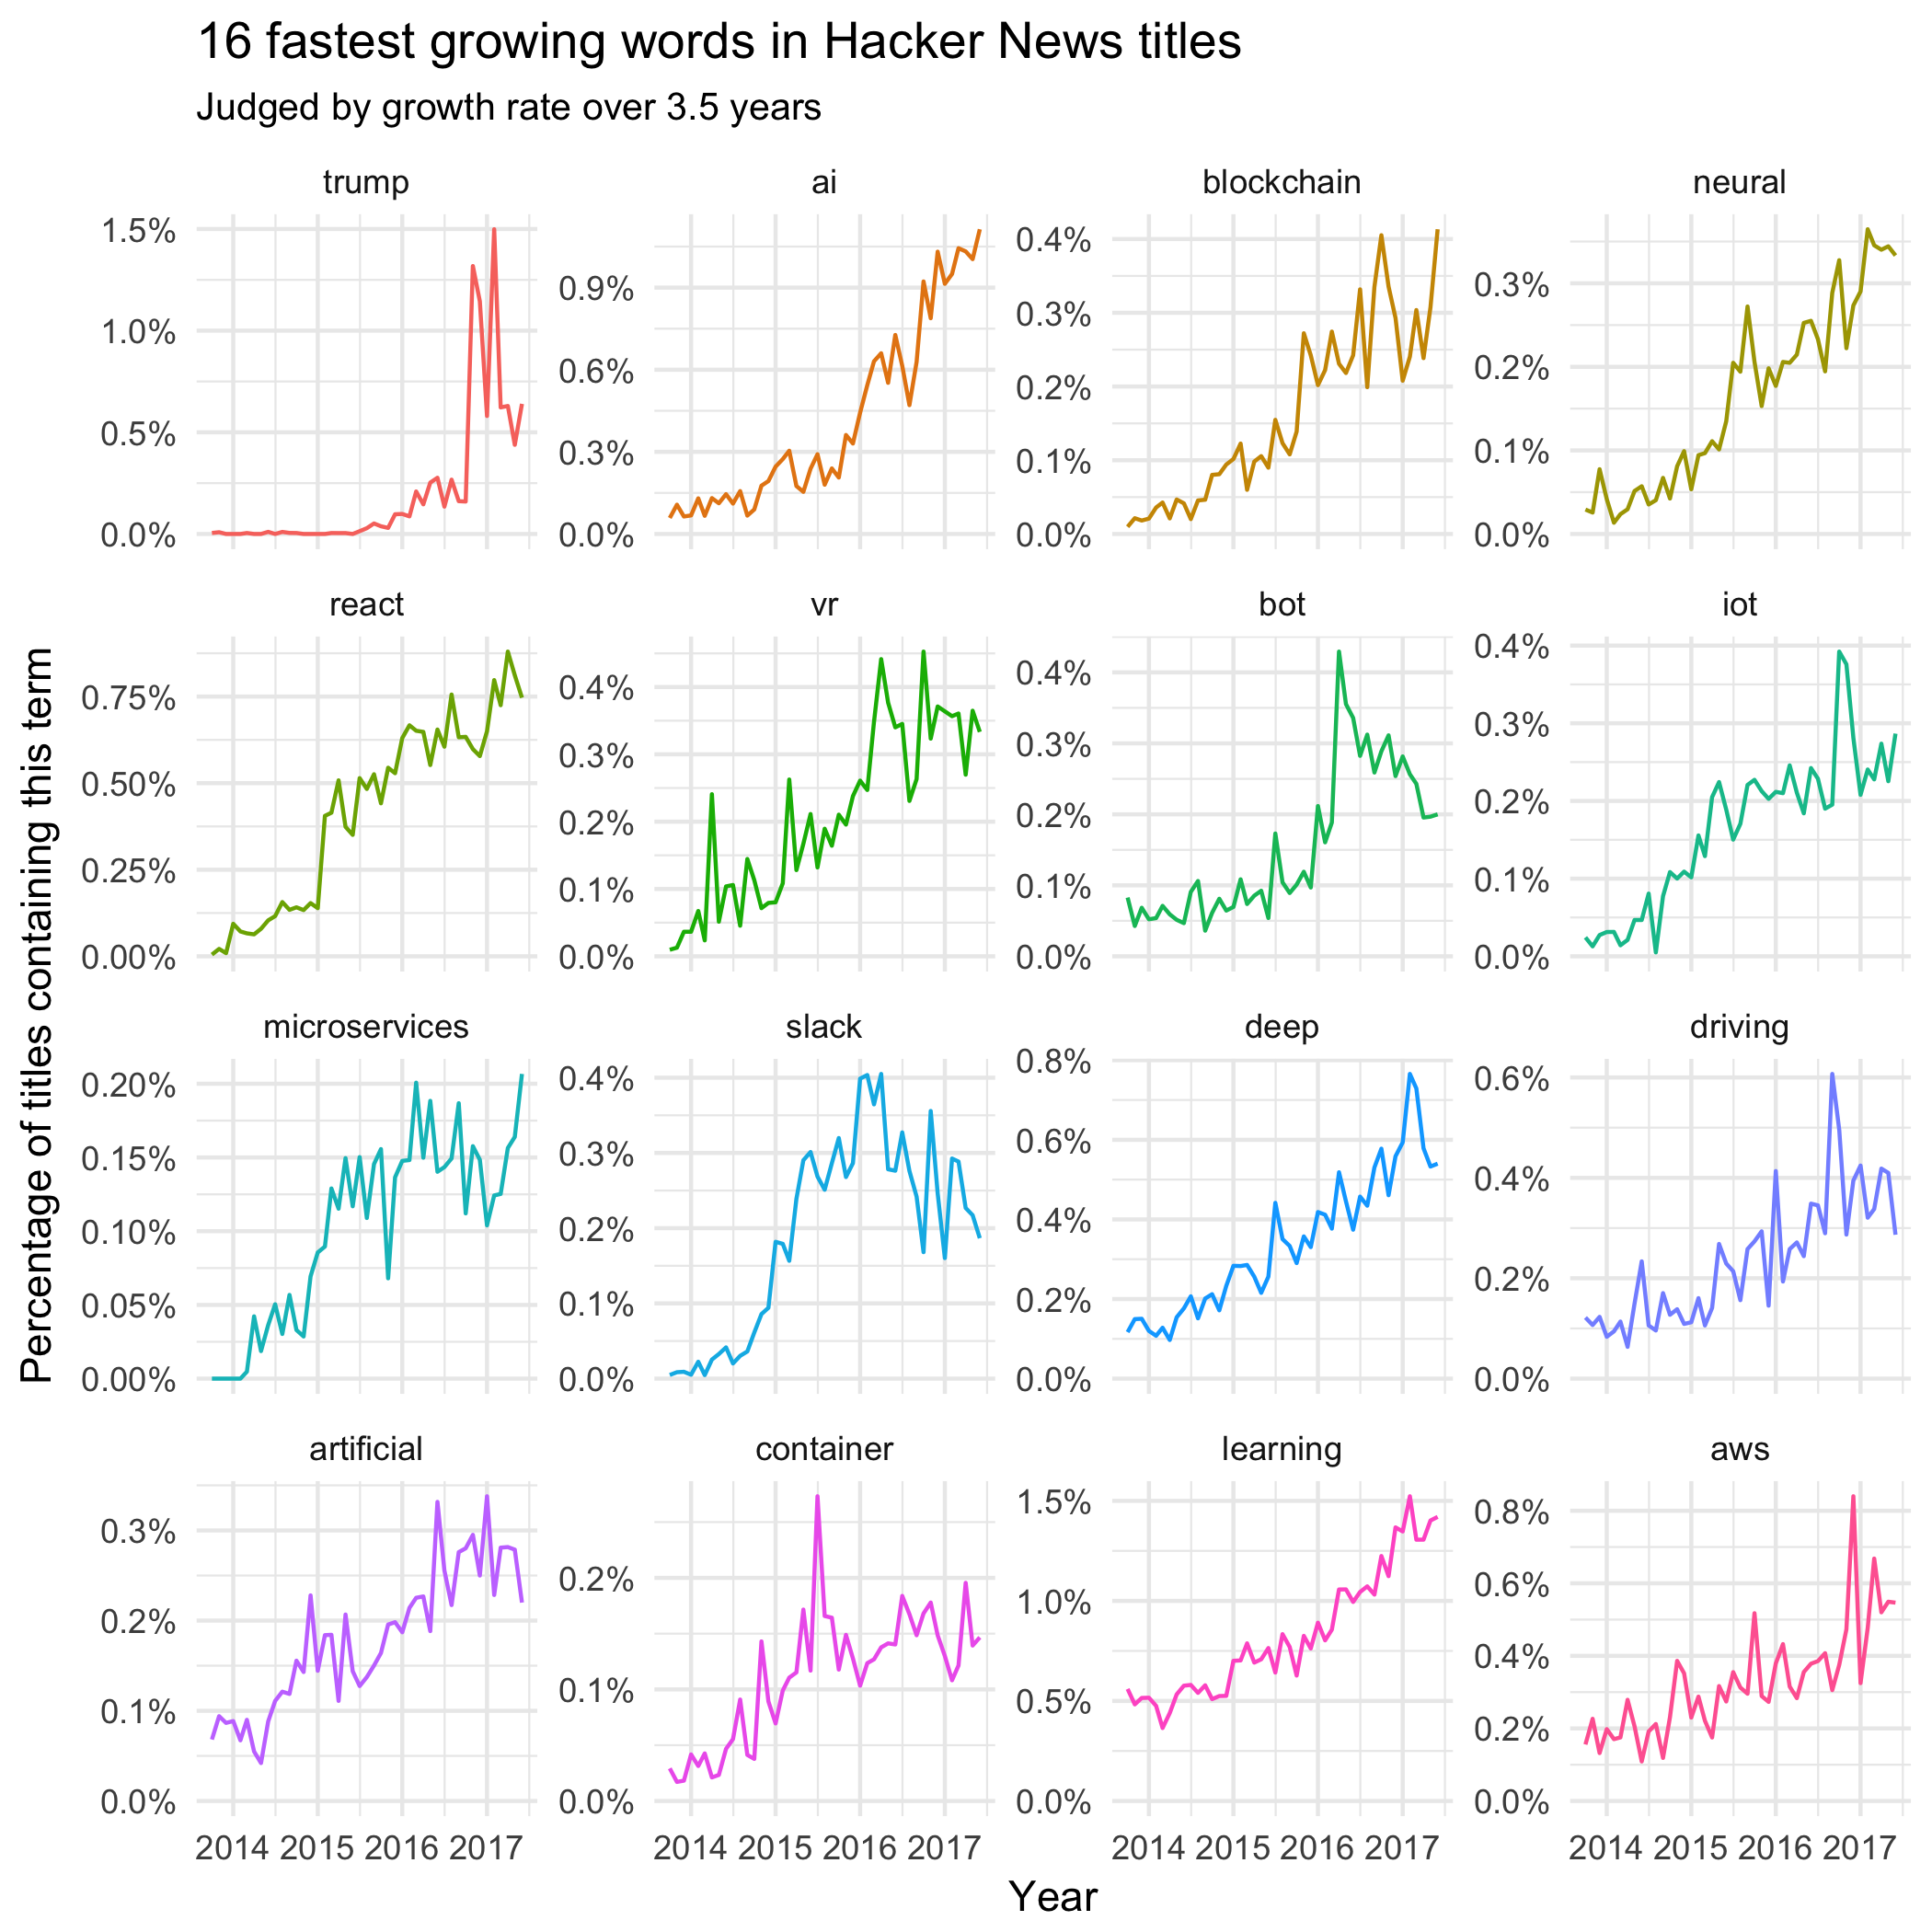
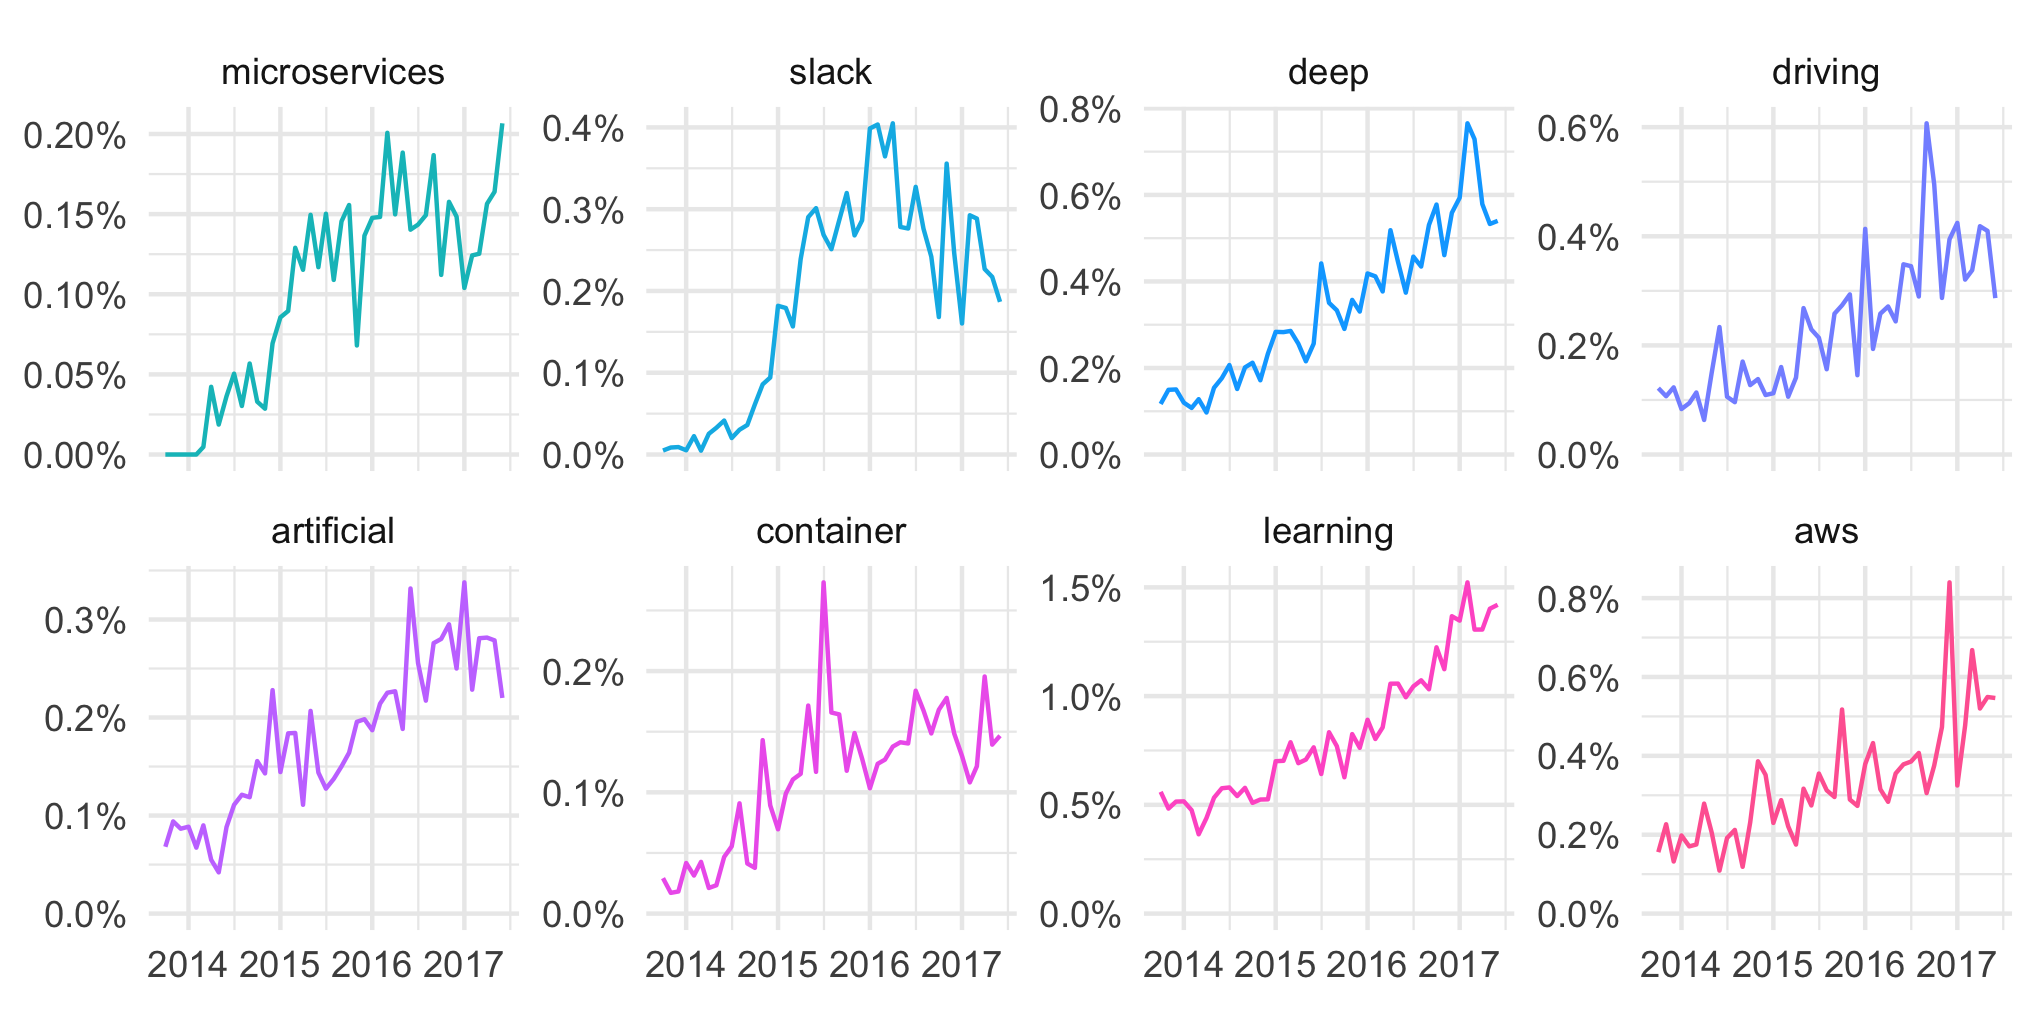
As you can see, words like “AI”, “artificial”, “bot”, “deep”, “neural”, and “learning” are key terms that have growing interest within the community. It shows that the buzz around AI and deep learning is widespread and happening on multiple fronts.
Donald Trump was also a hot topic of debate in Hacker News, as evidenced by the increase in mentions.
Cooling Off
Here are some of the words in the community used with decreasing frequency over the same 3.5 year timeframe:
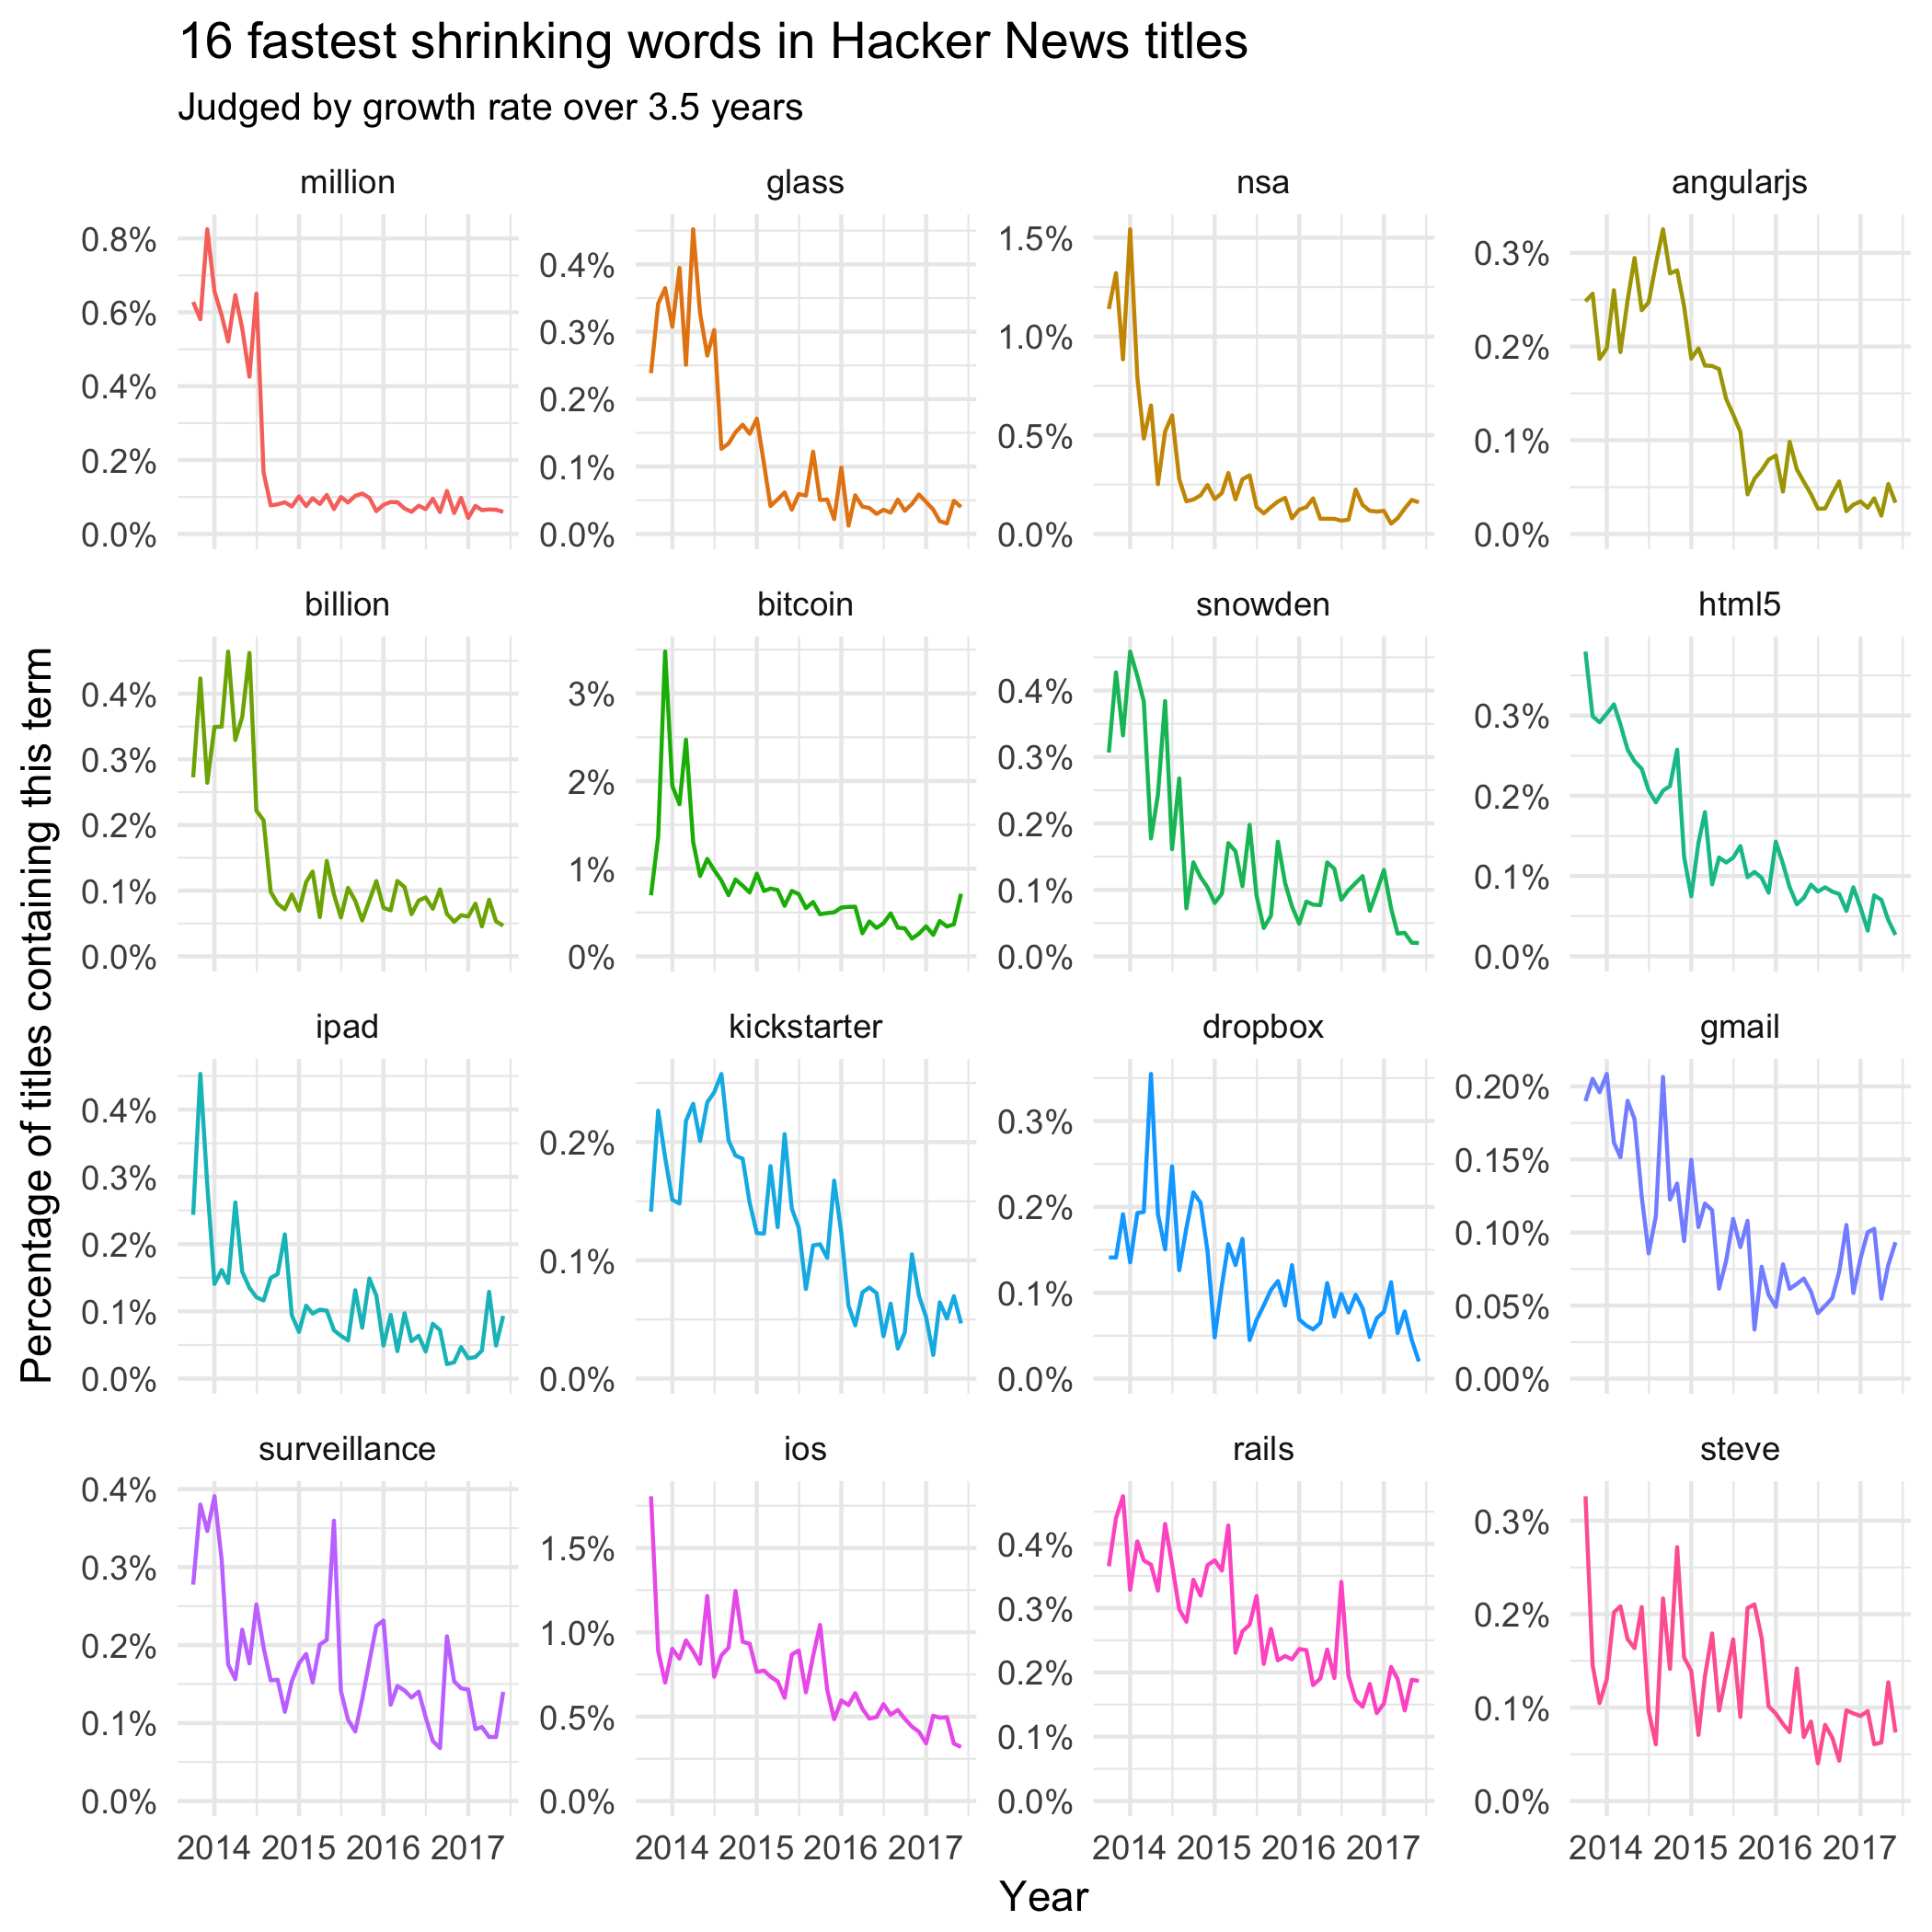
Over time, as the rubber hits the road, we get to see which ideas have staying power.
Google Glass, as cool as it was, ended up not directly revolutionizing how we use augmented reality. Likewise, Edward Snowden’s revelations about the NSA and surveillance seemed to have also dropped out of discussion.
On the flipside, some of these concepts also seem to have transitioned to the mainstream. Bitcoin and other altcoins, for example, are now more popular than ever before with a market capitalization of over $100 billion. Likewise, iPads, Gmail, and Kickstarter are pretty ubiquitous, but it could be argued that discussion on these topics is now pretty staid for the idea-hungry folks that frequent Hacker News.
Blockchain vs. Bitcoin
It’s also interesting to see the contrasting popularity of two related terms among Hacker News participants.
Bitcoin-related talk, at least on Hacker News, was hot in late-2013 after the price skyrocketed for the first time. The blockchain, on the other hand, took some time to pick up steam among influencers.
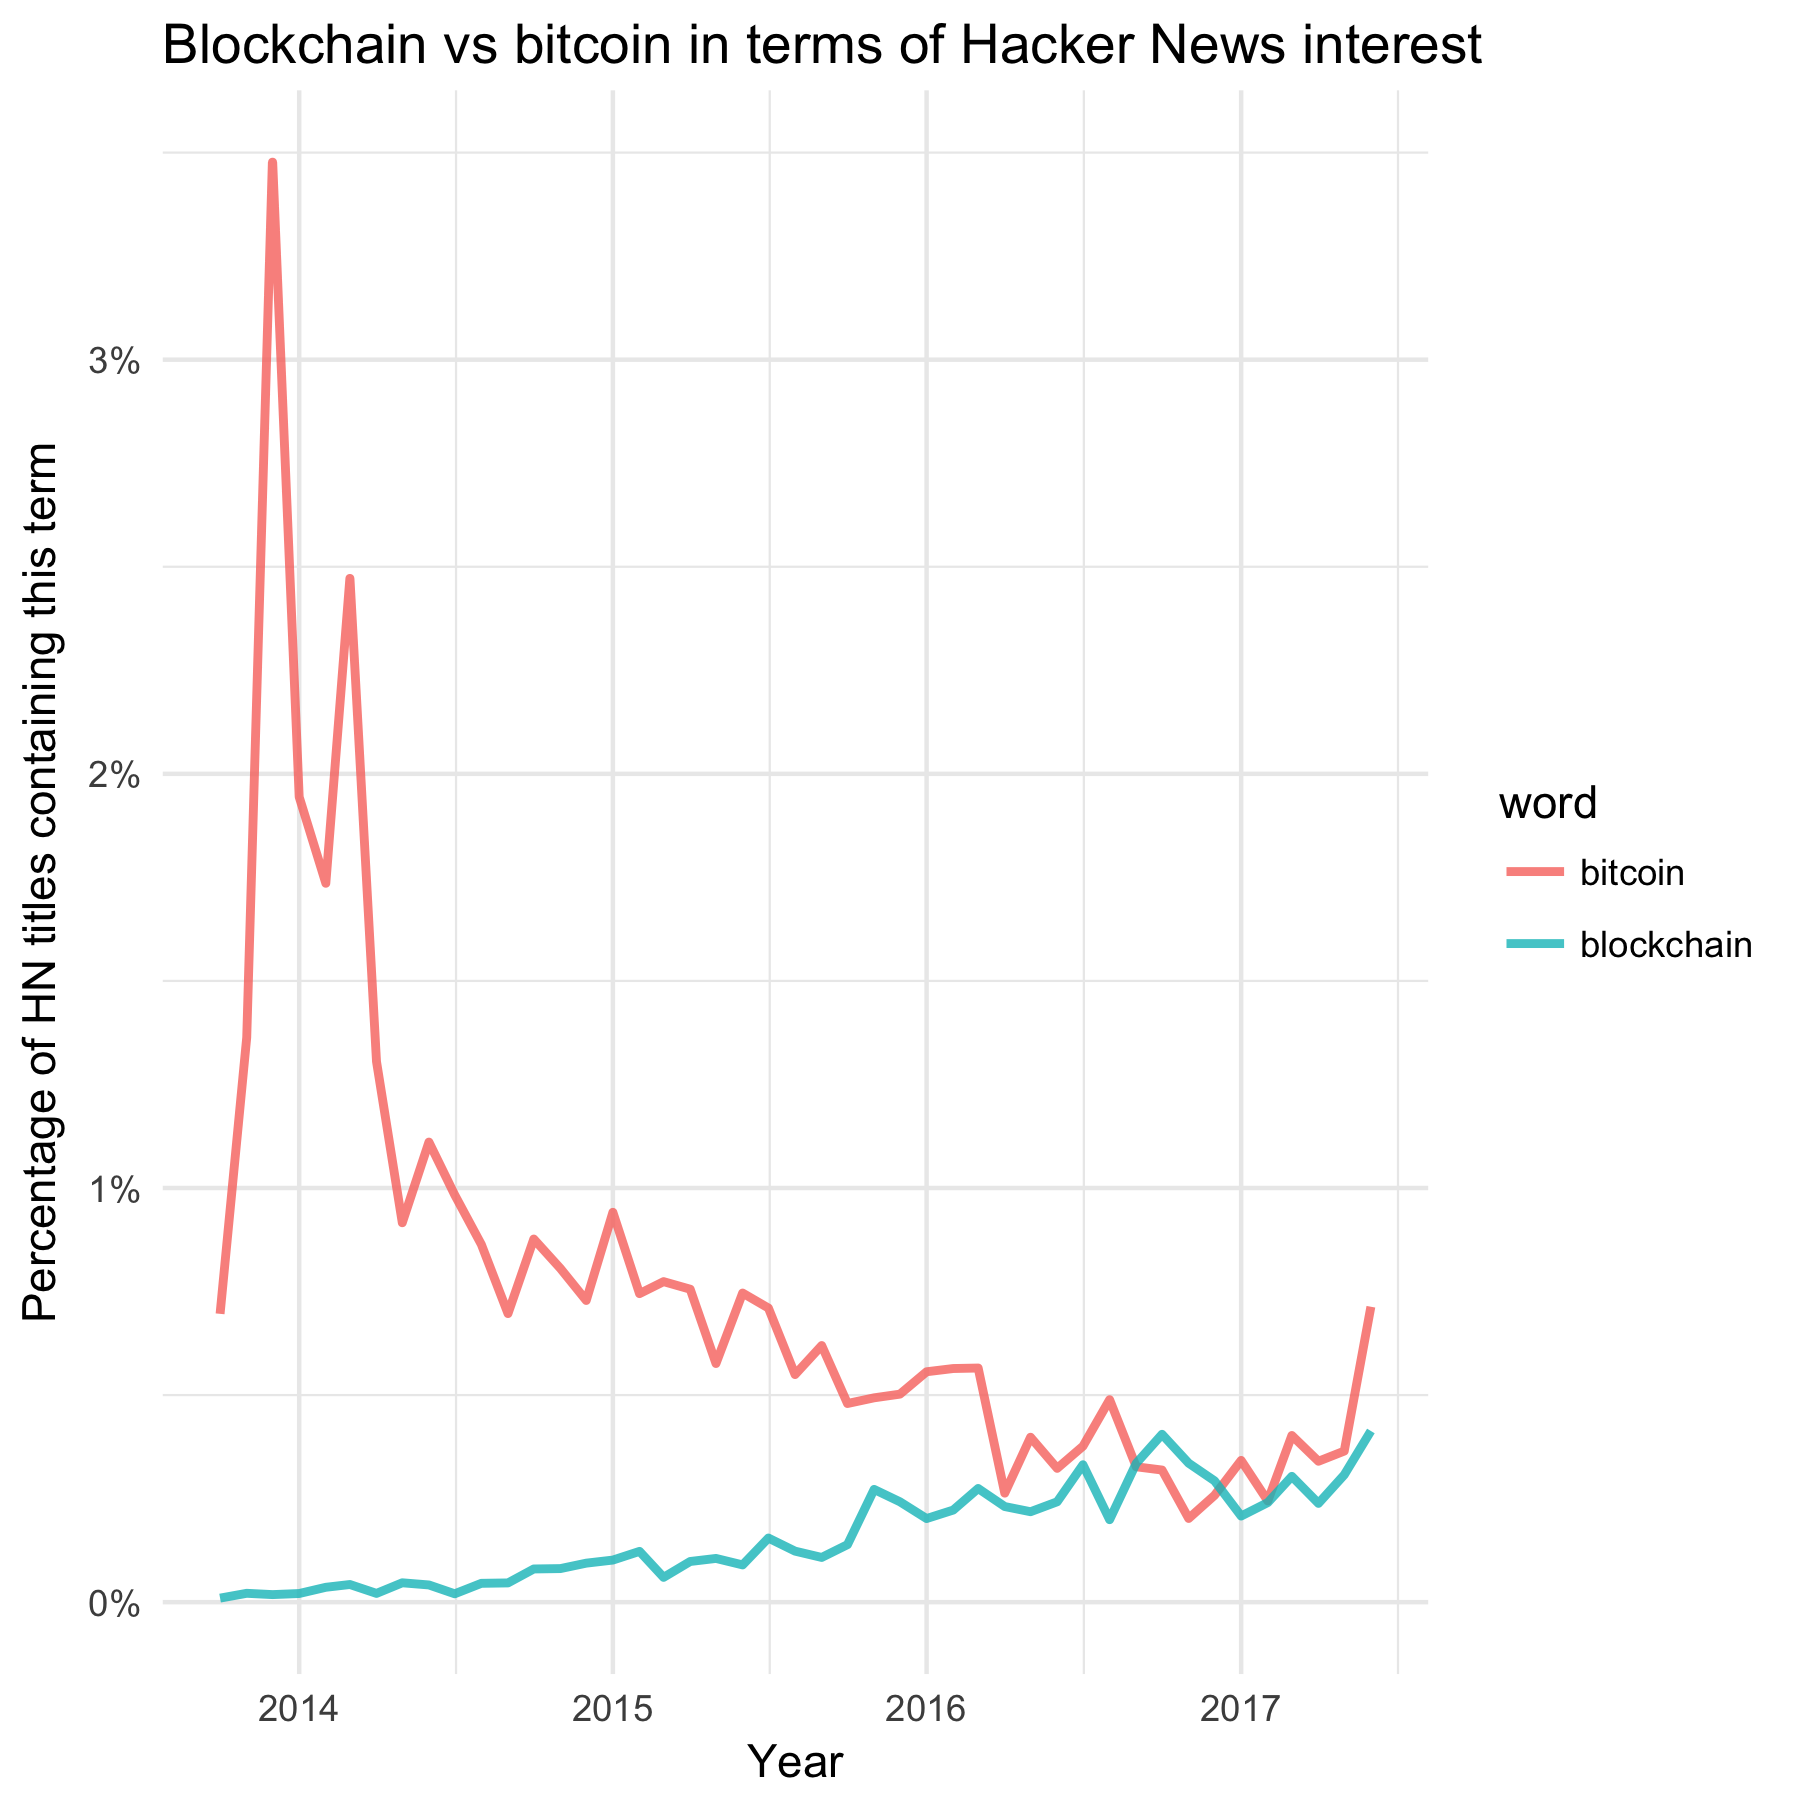
Fast-forward to today, and the concept of the blockchain is much more fleshed out.
It took time, but the blockchain is now considered to be a foundational technology that is affecting everything from how how stock markets work, to the proof of ownership for digital assets.


Technology
Visualizing AI Patents by Country
See which countries have been granted the most AI patents each year, from 2012 to 2022.


Visualizing AI Patents by Country
This was originally posted on our Voronoi app. Download the app for free on iOS or Android and discover incredible data-driven charts from a variety of trusted sources.
This infographic shows the number of AI-related patents granted each year from 2010 to 2022 (latest data available). These figures come from the Center for Security and Emerging Technology (CSET), accessed via Stanford University’s 2024 AI Index Report.
From this data, we can see that China first overtook the U.S. in 2013. Since then, the country has seen enormous growth in the number of AI patents granted each year.
| Year | China | EU and UK | U.S. | RoW | Global Total |
|---|---|---|---|---|---|
| 2010 | 307 | 137 | 984 | 571 | 1,999 |
| 2011 | 516 | 129 | 980 | 581 | 2,206 |
| 2012 | 926 | 112 | 950 | 660 | 2,648 |
| 2013 | 1,035 | 91 | 970 | 627 | 2,723 |
| 2014 | 1,278 | 97 | 1,078 | 667 | 3,120 |
| 2015 | 1,721 | 110 | 1,135 | 539 | 3,505 |
| 2016 | 1,621 | 128 | 1,298 | 714 | 3,761 |
| 2017 | 2,428 | 144 | 1,489 | 1,075 | 5,136 |
| 2018 | 4,741 | 155 | 1,674 | 1,574 | 8,144 |
| 2019 | 9,530 | 322 | 3,211 | 2,720 | 15,783 |
| 2020 | 13,071 | 406 | 5,441 | 4,455 | 23,373 |
| 2021 | 21,907 | 623 | 8,219 | 7,519 | 38,268 |
| 2022 | 35,315 | 1,173 | 12,077 | 13,699 | 62,264 |
In 2022, China was granted more patents than every other country combined.
While this suggests that the country is very active in researching the field of artificial intelligence, it doesn’t necessarily mean that China is the farthest in terms of capability.
Key Facts About AI Patents
According to CSET, AI patents relate to mathematical relationships and algorithms, which are considered abstract ideas under patent law. They can also have different meaning, depending on where they are filed.
In the U.S., AI patenting is concentrated amongst large companies including IBM, Microsoft, and Google. On the other hand, AI patenting in China is more distributed across government organizations, universities, and tech firms (e.g. Tencent).
In terms of focus area, China’s patents are typically related to computer vision, a field of AI that enables computers and systems to interpret visual data and inputs. Meanwhile America’s efforts are more evenly distributed across research fields.
Learn More About AI From Visual Capitalist
If you want to see more data visualizations on artificial intelligence, check out this graphic that shows which job departments will be impacted by AI the most.

-

 Mining1 week ago
Gold vs. S&P 500: Which Has Grown More Over Five Years?
-

 Markets2 weeks ago
Ranked: The Most Valuable Housing Markets in America
-

 Money2 weeks ago
Which States Have the Highest Minimum Wage in America?
-

 AI2 weeks ago
Ranked: Semiconductor Companies by Industry Revenue Share
-

 Markets2 weeks ago
Ranked: The World’s Top Flight Routes, by Revenue
-

 Countries2 weeks ago
Population Projections: The World’s 6 Largest Countries in 2075
-

 Markets2 weeks ago
The Top 10 States by Real GDP Growth in 2023
-

 Demographics2 weeks ago
The Smallest Gender Wage Gaps in OECD Countries