Energy
The Top 10 EV Battery Manufacturers in 2022
![]() Subscribe to the Elements free mailing list for more like this
Subscribe to the Elements free mailing list for more like this
The Top 10 EV Battery Manufacturers in 2022
This was originally posted on Elements. Sign up to the free mailing list to get beautiful visualizations on natural resource megatrends in your email every week.
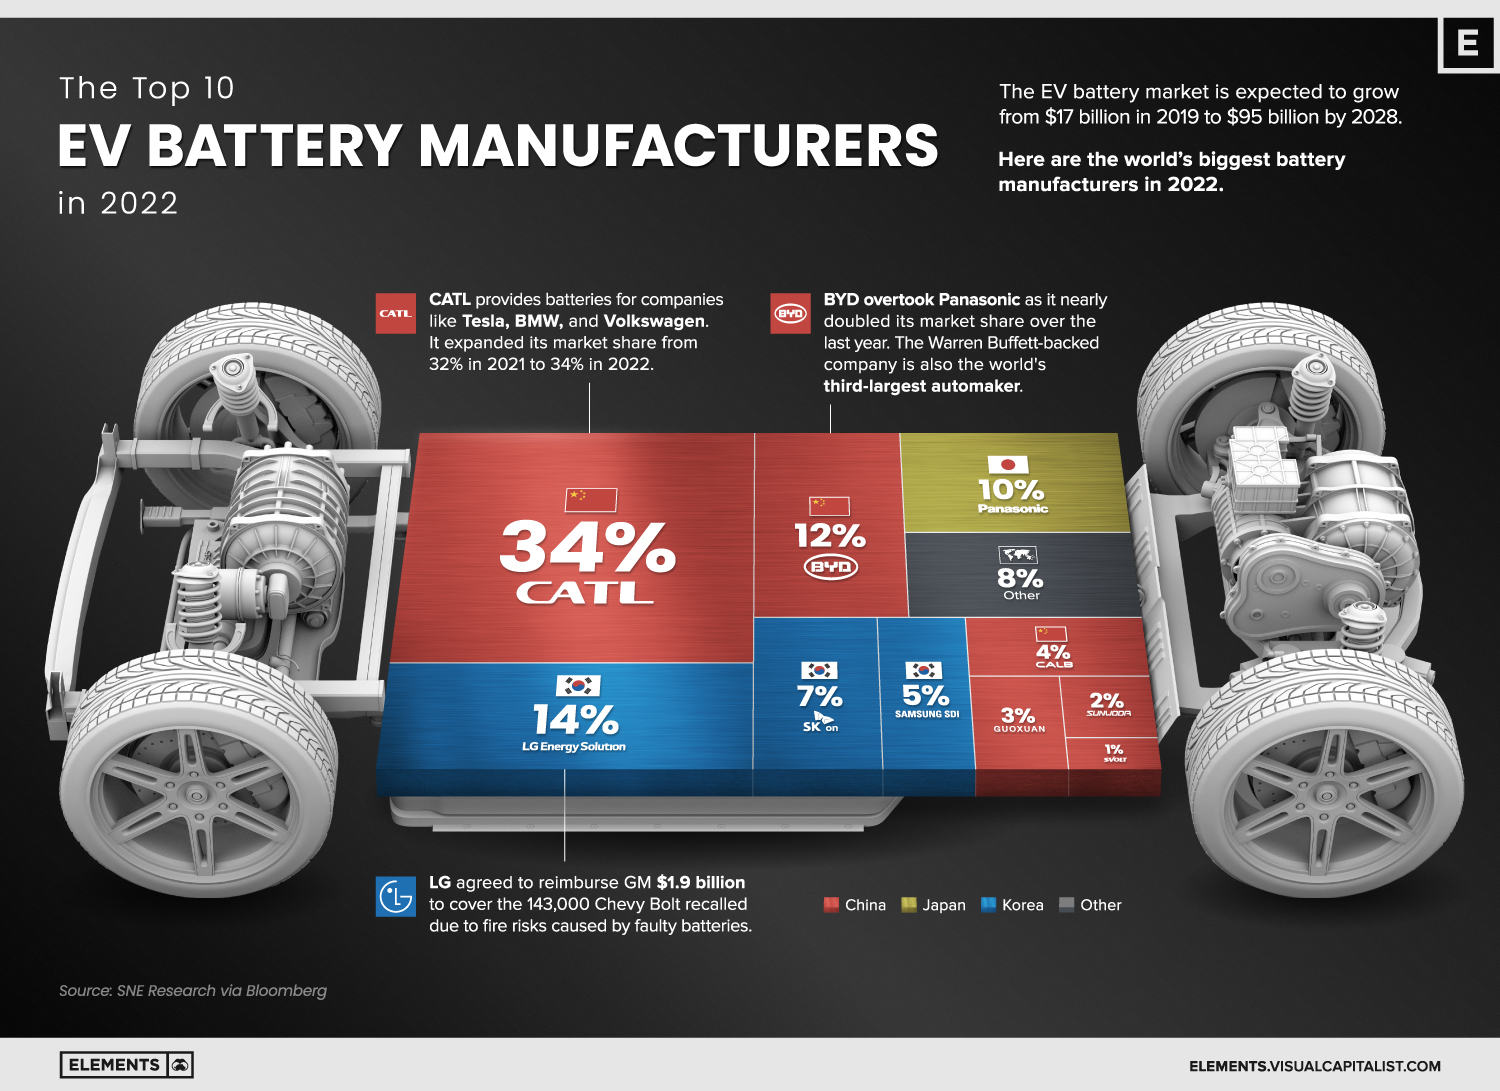
The global electric vehicle (EV) battery market is expected to grow from $17 billion to more than $95 billion between 2019 and 2028.
With increasing demand to decarbonize the transportation sector, companies producing the batteries that power EVs have seen substantial momentum.
Here we update our previous graphic of the top 10 EV battery manufacturers, bringing you the world’s biggest battery manufacturers in 2022.
Chinese Dominance
Despite efforts from the United States and Europe to increase the domestic production of batteries, the market is still dominated by Asian suppliers.
The top 10 producers are all Asian companies.
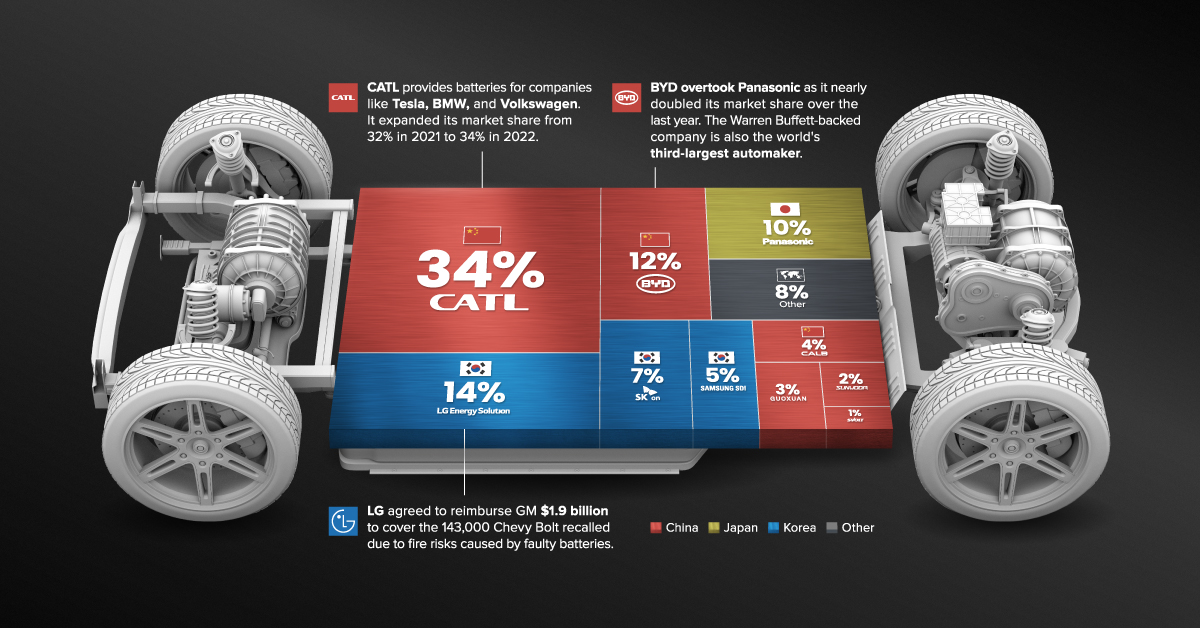
Currently, Chinese companies make up 56% of the EV battery market, followed by Korean companies (26%) and Japanese manufacturers (10%).
The leading battery supplier, CATL, expanded its market share from 32% in 2021 to 34% in 2022. One-third of the world’s EV batteries come from the Chinese company. CATL provides lithium-ion batteries to Tesla, Peugeot, Hyundai, Honda, BMW, Toyota, Volkswagen, and Volvo.
| Rank | Company | 2022 Market Share | Country |
|---|---|---|---|
| #1 | CATL | 34% | China 🇨🇳 |
| #2 | LG Energy Solution | 14% | Korea 🇰🇷 |
| #3 | BYD | 12% | China 🇨🇳 |
| #4 | Panasonic | 10% | Japan 🇯🇵 |
| #5 | SK On | 7% | Korea 🇰🇷 |
| #6 | Samsung SDI | 5% | Korea 🇰🇷 |
| #7 | CALB | 4% | China 🇨🇳 |
| #8 | Guoxuan | 3% | China 🇨🇳 |
| #9 | Sunwoda | 2% | China 🇨🇳 |
| #10 | SVOLT | 1% | China 🇨🇳 |
| Other | 8% | ROW 🌐 |
Despite facing strict scrutiny after EV battery-fire recalls in the United States, LG Energy Solution remains the second-biggest battery manufacturer. In 2021, the South Korean supplier agreed to reimburse General Motors $1.9 billion to cover the 143,000 Chevy Bolt EVs recalled due to fire risks from faulty batteries.
BYD took the third spot from Panasonic as it nearly doubled its market share over the last year. The Warren Buffett-backed company is the world’s third-largest automaker by market cap, but it also produces batteries sold in markets around the world. Recent sales figures point to BYD overtaking LG Energy Solution in market share the coming months or years.
The Age of Battery Power
Electric vehicles are here to stay, while internal combustion engine (ICE) vehicles are set to fade away in the coming decades. Recently, General Motors announced that it aims to stop selling ICE vehicles by 2035, while Audi plans to stop producing such models by 2033.
Besides EVs, battery technology is essential for the energy transition, providing storage capacity for intermittent solar and wind generation.
As battery makers work to supply the EV transition’s increasing demand and improve energy density in their products, we can expect more interesting developments within this industry.
Energy
Charted: 4 Reasons Why Lithium Could Be the Next Gold Rush
Visual Capitalist has partnered with EnergyX to show why drops in prices and growing demand may make now the right time to invest in lithium.


4 Reasons Why You Should Invest in Lithium
Lithium’s importance in powering EVs makes it a linchpin of the clean energy transition and one of the world’s most precious minerals.
In this graphic, Visual Capitalist partnered with EnergyX to explore why now may be the time to invest in lithium.
1. Lithium Prices Have Dropped
One of the most critical aspects of evaluating an investment is ensuring that the asset’s value is higher than its price would indicate. Lithium is integral to powering EVs, and, prices have fallen fast over the last year:
| Date | LiOH·H₂O* | Li₂CO₃** |
|---|---|---|
| Feb 2023 | $76 | $71 |
| March 2023 | $71 | $61 |
| Apr 2023 | $43 | $33 |
| May 2023 | $43 | $33 |
| June 2023 | $47 | $45 |
| July 2023 | $44 | $40 |
| Aug 2023 | $35 | $35 |
| Sept 2023 | $28 | $27 |
| Oct 2023 | $24 | $23 |
| Nov 2023 | $21 | $21 |
| Dec 2023 | $17 | $16 |
| Jan 2024 | $14 | $15 |
| Feb 2024 | $13 | $14 |
Note: Monthly spot prices were taken as close to the 14th of each month as possible.
*Lithium hydroxide monohydrate MB-LI-0033
**Lithium carbonate MB-LI-0029
2. Lithium-Ion Battery Prices Are Also Falling
The drop in lithium prices is just one reason to invest in the metal. Increasing economies of scale, coupled with low commodity prices, have caused the cost of lithium-ion batteries to drop significantly as well.
In fact, BNEF reports that between 2013 and 2023, the price of a Li-ion battery dropped by 82%.
| Year | Price per KWh |
|---|---|
| 2023 | $139 |
| 2022 | $161 |
| 2021 | $150 |
| 2020 | $160 |
| 2019 | $183 |
| 2018 | $211 |
| 2017 | $258 |
| 2016 | $345 |
| 2015 | $448 |
| 2014 | $692 |
| 2013 | $780 |

3. EV Adoption is Sustainable
One of the best reasons to invest in lithium is that EVs, one of the main drivers behind the demand for lithium, have reached a price point similar to that of traditional vehicle.
According to the Kelly Blue Book, Tesla’s average transaction price dropped by 25% between 2022 and 2023, bringing it in line with many other major manufacturers and showing that EVs are a realistic transport option from a consumer price perspective.
| Manufacturer | September 2022 | September 2023 |
|---|---|---|
| BMW | $69,000 | $72,000 |
| Ford | $54,000 | $56,000 |
| Volkswagon | $54,000 | $56,000 |
| General Motors | $52,000 | $53,000 |
| Tesla | $68,000 | $51,000 |
4. Electricity Demand in Transport is Growing
As EVs become an accessible transport option, there’s an investment opportunity in lithium. But possibly the best reason to invest in lithium is that the IEA reports global demand for the electricity in transport could grow dramatically by 2030:
| Transport Type | 2022 | 2025 | 2030 |
|---|---|---|---|
| Buses 🚌 | 23,000 GWh | 50,000 GWh | 130,000 GWh |
| Cars 🚙 | 65,000 GWh | 200,000 GWh | 570,000 GWh |
| Trucks 🛻 | 4,000 GWh | 15,000 GWh | 94,000 GWh |
| Vans 🚐 | 6,000 GWh | 16,000 GWh | 72,000 GWh |
The Lithium Investment Opportunity
Lithium presents a potentially classic investment opportunity. Lithium and battery prices have dropped significantly, and recently, EVs have reached a price point similar to other vehicles. By 2030, the demand for clean energy, especially in transport, will grow dramatically.
With prices dropping and demand skyrocketing, now is the time to invest in lithium.
EnergyX is poised to exploit lithium demand with cutting-edge lithium extraction technology capable of extracting 300% more lithium than current processes.

-

 Lithium5 days ago
Ranked: The Top 10 EV Battery Manufacturers in 2023
Asia dominates this ranking of the world’s largest EV battery manufacturers in 2023.
-

 Energy1 week ago
The World’s Biggest Nuclear Energy Producers
China has grown its nuclear capacity over the last decade, now ranking second on the list of top nuclear energy producers.
-

 Energy1 month ago
The World’s Biggest Oil Producers in 2023
Just three countries accounted for 40% of global oil production last year.
-

 Energy1 month ago
How Much Does the U.S. Depend on Russian Uranium?
Currently, Russia is the largest foreign supplier of nuclear power fuel to the U.S.
-

 Uranium2 months ago
Charted: Global Uranium Reserves, by Country
We visualize the distribution of the world’s uranium reserves by country, with 3 countries accounting for more than half of total reserves.
-

 Energy3 months ago
Visualizing the Rise of the U.S. as Top Crude Oil Producer
Over the last decade, the United States has established itself as the world’s top producer of crude oil, surpassing Saudi Arabia and Russia.


-

 Debt1 week ago
How Debt-to-GDP Ratios Have Changed Since 2000
-

 Countries2 weeks ago
Population Projections: The World’s 6 Largest Countries in 2075
-

 Markets2 weeks ago
The Top 10 States by Real GDP Growth in 2023
-

 Demographics2 weeks ago
The Smallest Gender Wage Gaps in OECD Countries
-

 United States2 weeks ago
Where U.S. Inflation Hit the Hardest in March 2024
-

 Green2 weeks ago
Top Countries By Forest Growth Since 2001
-

 United States2 weeks ago
Ranked: The Largest U.S. Corporations by Number of Employees
-

 Maps2 weeks ago
The Largest Earthquakes in the New York Area (1970-2024)