Markets
The Pandemic Economy: Which Stocks are Weathering the Storm?
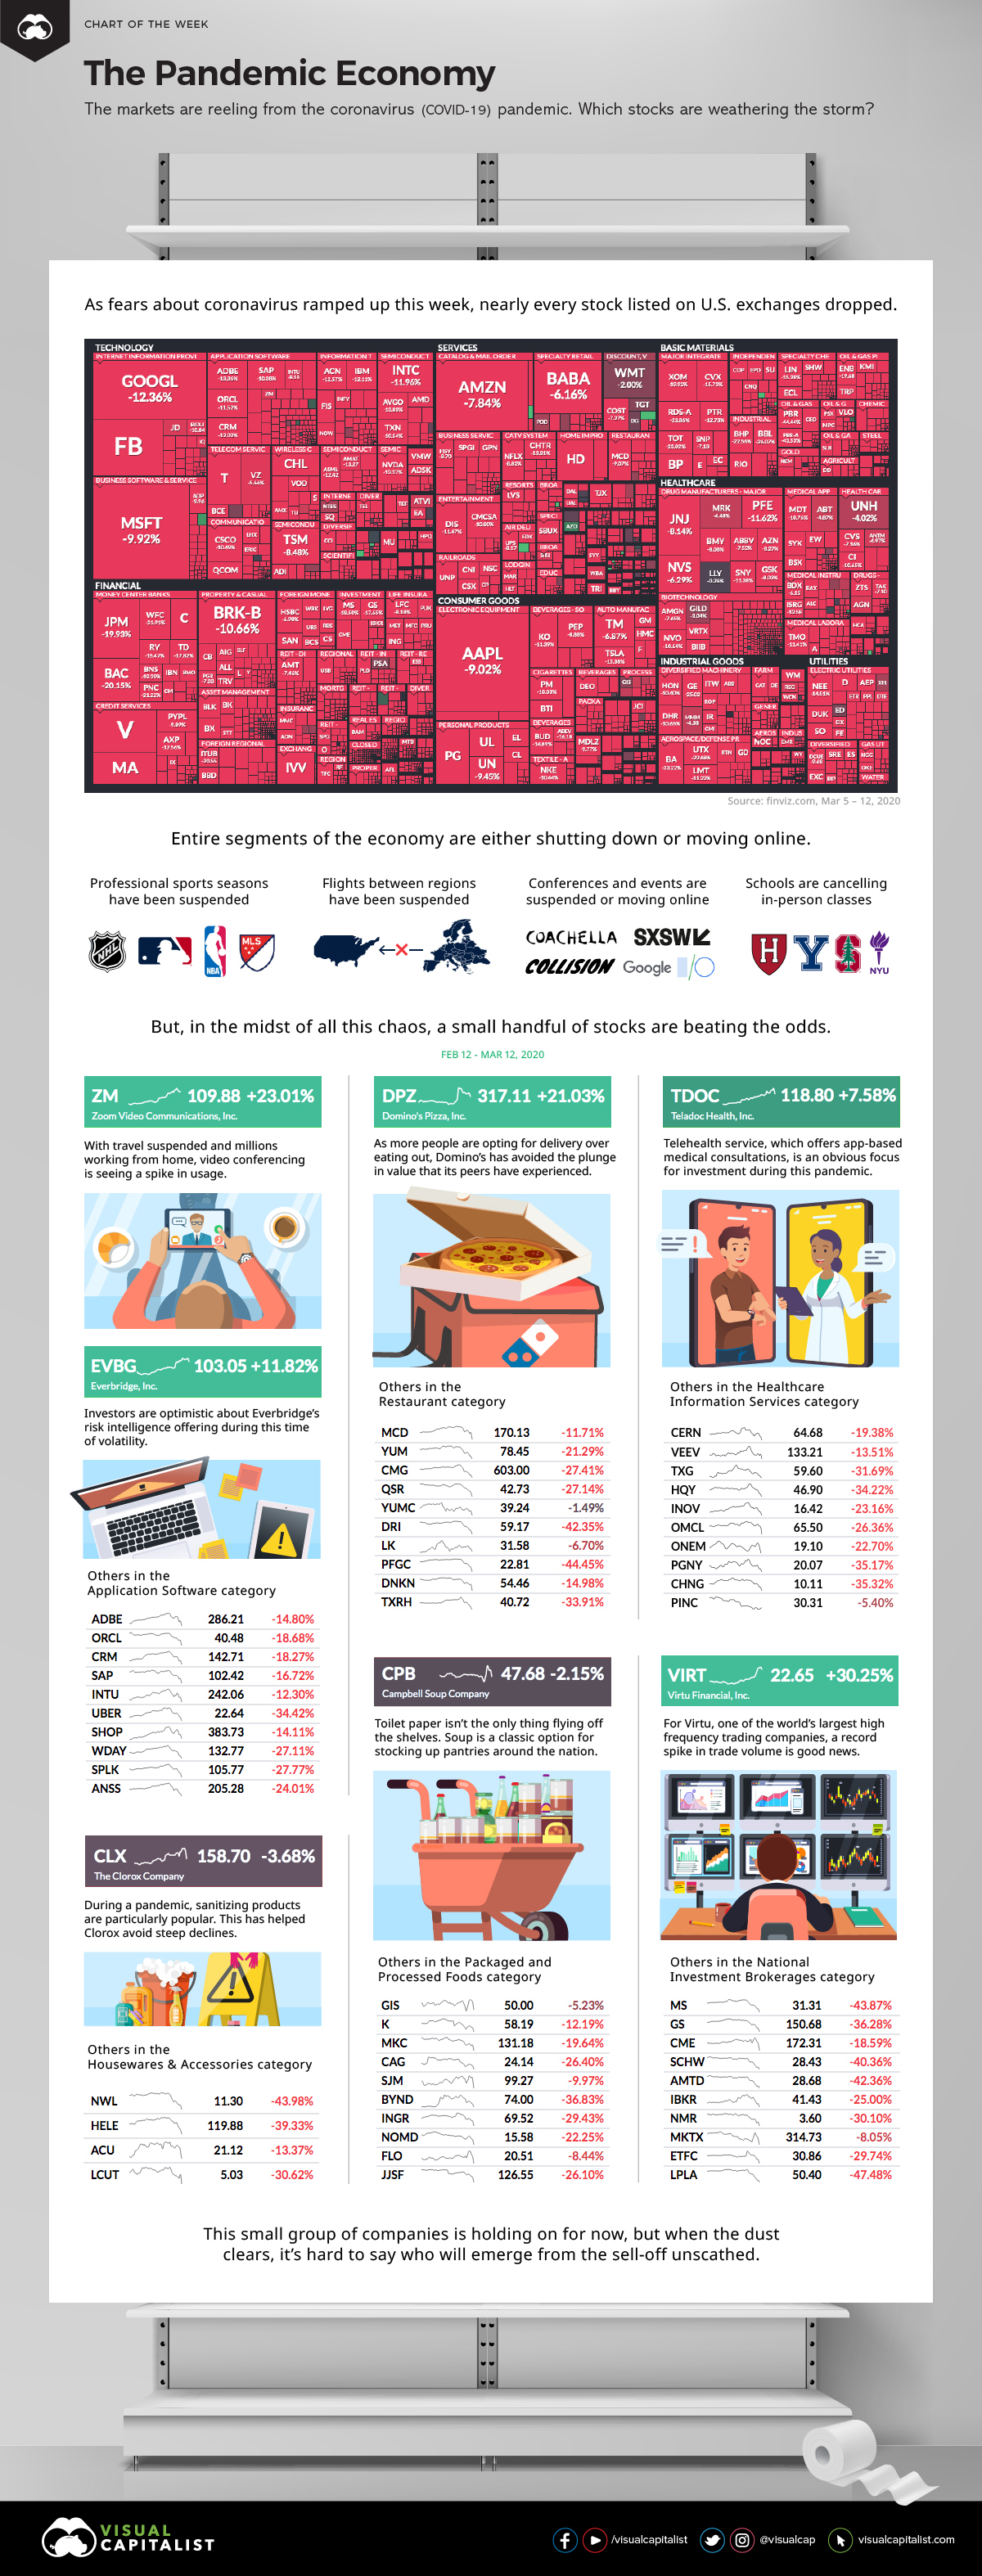
The Pandemic Economy: The Stocks Weathering the Storm
When markets get wacky, even the best companies can’t avoid the maelstrom.
Investors were already tiptoeing on broken glass, knowing that the longest U.S. stock market bull run in history was getting long in the tooth.
Then, when the market foresaw the potential damage that could be caused by the COVID-19 pandemic, it quickly created a vortex that would suck almost everything into it.
Bizarro Market
In the last week, markets flipped into an alternate universe. Every major stock got crushed, while suddenly those holding onto stockpiles of toilet paper and soup reigned supreme.
In such unique circumstances, we wondered which companies were weathering the storm of volatility. To do this, we used Finviz to pull up a visualization of S&P 500 performance, then investigating the segments of the market that were doing well in spite of the recent plunge.
| Stock selection | Performance (Mar 5-12) | Components |
|---|---|---|
| S&P 500 | -18.0% 📉 | The 500 largest U.S. companies by market cap |
| The Pandemic Economy | +12.7% 📈 | Soup, bleach, pizza, and telecommuting stocks |
A few companies not only avoided the chaos — they actually thrived over the last week.
Let’s look at why!
Not Getting Bugged Down
With global travel, events, and social gatherings screeching to a halt, it’s obvious that this is not a winning situation for any typical economy.
However, it’s hard for everyone to simultaneously be a loser, and it’s always inevitable that some stocks will benefit from any crisis — or at least not get hit as hard as their peers.
- Zoom Video Communications (ZM)
There’s no doubt a pandemic is tough on brick-and-mortar companies, but for most white collar workers the show must go on. As a pure play stock in the video conferencing category, Zoom is uniquely positioned as companies shift to more remote work. - Domino’s Pizza (DPZ)
With people wanting to avoid crowds because of COVID-19, it’s natural to want to order in. Domino’s, as well as other companies that focus on food delivery, stand to benefit in the short term from the virus. - Campbell Soup Company (CPB)
Campbell is the quintessential counter-cyclical stock, and even more so in a prepping environment. When the global outlook is gloomy, people want to stockpile — and soup is a major pantry staple. - Teladoc Health, Inc. (TDOC)
If sitting in a doctor’s office with dozens of other sick people can be avoided, it seems it would be regarded as a prudent decision. For this reason, remote health services are an obvious focus for investors during the pandemic. - The Clorox Company (CLX)
Wash your hands. Wash your hands. Have you heard that you should wash your hands to avoid the spread of the coronavirus? Clorox benefits from this sudden interest in sanitation and cleanliness. - Everbridge, Inc. (EVBG)
When times are uncertain, global decision-makers want to get as much quality information as possible. Everbridge offers a risk intelligence platform that provides this service. - Virtu Financial, Inc. (VIRT)
Whether markets are going up or down, large amounts of volume and volatility are a good thing for financial services companies that make money from high frequency trading.
Not all of these companies are in the green — some have simply traded sideways — but on average, they’ve seen a 12.7% bump in price over the last week.
Whether that will last in a fast-changing news environment is another story.


Markets
Mapped: Europe’s GDP Per Capita, by Country
Which European economies are richest on a GDP per capita basis? This map shows the results for 44 countries across the continent.


Mapped: Europe’s GDP Per Capita, by Country (2024)
This was originally posted on our Voronoi app. Download the app for free on iOS or Android and discover incredible data-driven charts from a variety of trusted sources.
Europe is home to some of the largest and most sophisticated economies in the world. But how do countries in the region compare with each other on a per capita productivity basis?
In this map, we show Europe’s GDP per capita levels across 44 nations in current U.S. dollars. Data for this visualization and article is sourced from the International Monetary Fund (IMF) via their DataMapper tool, updated April 2024.
Europe’s Richest and Poorest Nations, By GDP Per Capita
Luxembourg, Ireland, and Switzerland, lead the list of Europe’s richest nations by GDP per capita, all above $100,000.
| Rank | Country | GDP Per Capita (2024) |
|---|---|---|
| 1 | 🇱🇺 Luxembourg | $131,380 |
| 2 | 🇮🇪 Ireland | $106,060 |
| 3 | 🇨🇭 Switzerland | $105,670 |
| 4 | 🇳🇴 Norway | $94,660 |
| 5 | 🇮🇸 Iceland | $84,590 |
| 6 | 🇩🇰 Denmark | $68,900 |
| 7 | 🇳🇱 Netherlands | $63,750 |
| 8 | 🇸🇲 San Marino | $59,410 |
| 9 | 🇦🇹 Austria | $59,230 |
| 10 | 🇸🇪 Sweden | $58,530 |
| 11 | 🇧🇪 Belgium | $55,540 |
| 12 | 🇫🇮 Finland | $55,130 |
| 13 | 🇩🇪 Germany | $54,290 |
| 14 | 🇬🇧 UK | $51,070 |
| 15 | 🇫🇷 France | $47,360 |
| 16 | 🇦🇩 Andorra | $44,900 |
| 17 | 🇲🇹 Malta | $41,740 |
| 18 | 🇮🇹 Italy | $39,580 |
| 19 | 🇨🇾 Cyprus | $37,150 |
| 20 | 🇪🇸 Spain | $34,050 |
| 21 | 🇸🇮 Slovenia | $34,030 |
| 22 | 🇪🇪 Estonia | $31,850 |
| 23 | 🇨🇿 Czech Republic | $29,800 |
| 24 | 🇵🇹 Portugal | $28,970 |
| 25 | 🇱🇹 Lithuania | $28,410 |
| 26 | 🇸🇰 Slovakia | $25,930 |
| 27 | 🇱🇻 Latvia | $24,190 |
| 28 | 🇬🇷 Greece | $23,970 |
| 29 | 🇭🇺 Hungary | $23,320 |
| 30 | 🇵🇱 Poland | $23,010 |
| 31 | 🇭🇷 Croatia | $22,970 |
| 32 | 🇷🇴 Romania | $19,530 |
| 33 | 🇧🇬 Bulgaria | $16,940 |
| 34 | 🇷🇺 Russia | $14,390 |
| 35 | 🇹🇷 Türkiye | $12,760 |
| 36 | 🇲🇪 Montenegro | $12,650 |
| 37 | 🇷🇸 Serbia | $12,380 |
| 38 | 🇦🇱 Albania | $8,920 |
| 39 | 🇧🇦 Bosnia & Herzegovina | $8,420 |
| 40 | 🇲🇰 North Macedonia | $7,690 |
| 41 | 🇧🇾 Belarus | $7,560 |
| 42 | 🇲🇩 Moldova | $7,490 |
| 43 | 🇽🇰 Kosovo | $6,390 |
| 44 | 🇺🇦 Ukraine | $5,660 |
| N/A | 🇪🇺 EU Average | $44,200 |
Note: Figures are rounded.
Three Nordic countries (Norway, Iceland, Denmark) also place highly, between $70,000-90,000. Other Nordic peers, Sweden and Finland rank just outside the top 10, between $55,000-60,000.
Meanwhile, Europe’s biggest economies in absolute terms, Germany, UK, and France, rank closer to the middle of the top 20, with GDP per capitas around $50,000.
Finally, at the end of the scale, Eastern Europe as a whole tends to have much lower per capita GDPs. In that group, Ukraine ranks last, at $5,660.
A Closer Look at Ukraine
For a broader comparison, Ukraine’s per capita GDP is similar to Iran ($5,310), El Salvador ($5,540), and Guatemala ($5,680).
According to experts, Ukraine’s economy has historically underperformed to expectations. After the fall of the Berlin Wall, the economy contracted for five straight years. Its transition to a Western, liberalized economic structure was overshadowed by widespread corruption, a limited taxpool, and few revenue sources.
Politically, its transformation from authoritarian regime to civil democracy has proved difficult, especially when it comes to institution building.
Finally, after the 2022 invasion of the country, Ukraine’s GDP contracted by 30% in a single year—the largest loss since independence. Large scale emigration—to the tune of six million refugees—is also playing a role.
Despite these challenges, the country’s economic growth has somewhat stabilized while fighting continues.

-

 Markets5 days ago
Mapped: The Most Valuable Company in Each Southeast Asian Country
-

 Markets2 weeks ago
The Top Private Equity Firms by Country
-

 Jobs2 weeks ago
The Best U.S. Companies to Work for According to LinkedIn
-

 Economy2 weeks ago
Ranked: The Top 20 Countries in Debt to China
-

 Politics1 week ago
Charted: Trust in Government Institutions by G7 Countries
-

 Energy1 week ago
Mapped: The Age of Energy Projects in Interconnection Queues, by State
-

 Mining1 week ago
Visualizing Global Gold Production in 2023
-

 Markets1 week ago
Visualized: Interest Rate Forecasts for Advanced Economies